| Param | Original file | Final file |
|---|---|---|
| Filename | modeM0/AS1A10_045T03_9000004052_28043cztM0_level2.evt | modeM0/AS1A10_045T03_9000004052_28043cztM0_level2_quad_clean.evt |
| Size (bytes) | 310,518,720 | 42,186,240 |
| Size | 296.1 MB | 40.2 MB |
| Events in quadrant A | 1,884,646 | 260,830 |
| Events in quadrant B | 1,909,262 | 263,467 |
| Events in quadrant C | 2,134,432 | 250,206 |
| Events in quadrant D | 3,226,682 | 244,199 |
| Mode M0 | |||
|---|---|---|---|
| Quadrant | BADHDUFLAG | Total packets | Discarded packets |
| A | 0 | 7751 | 0 |
| B | 0 | 7834 | 0 |
| C | 0 | 8640 | 0 |
| D | 0 | 12093 | 0 |
| Mode M9 | |||
|---|---|---|---|
| Quadrant | BADHDUFLAG | Total packets | Discarded packets |
| A | 0 | 1 | 0 |
| B | 0 | 1 | 0 |
| C | 0 | 1 | 0 |
| D | 0 | 1 | 0 |
| Quadrant | Total seconds | Saturated seconds | Saturation percentage |
|---|---|---|---|
| A | 3647 | 95 | 2.604881% |
| B | 3647 | 116 | 3.180696% |
| C | 3647 | 193 | 5.292021% |
| D | 3647 | 304 | 8.335618% |
Noise dominated data is calculated using 1-second bins in cleaned event files. If a bin has >2000 counts, and if more than 50% of those come from <1% of pixels, then it is considered to be noise-dominated and hence unusable.
| Quadrant | # 1 sec bins | Bins with >0 counts | Bins with >2000 counts | High rate bins dominated by noise | Noise dominated (total time) | Noise dominated (detector-on time) | Marked lightcurve |
|---|---|---|---|---|---|---|---|
| A | 3812 | 3649 | 0 | 0 | 0.00% | 0.00% | 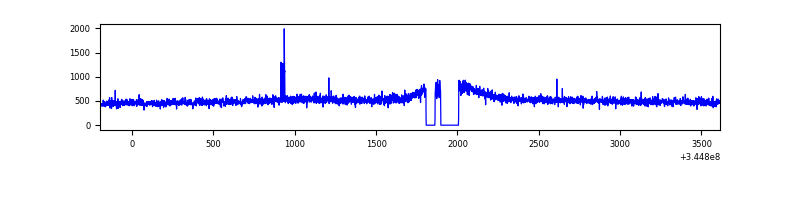 |
| B | 3812 | 3648 | 0 | 0 | 0.00% | 0.00% | 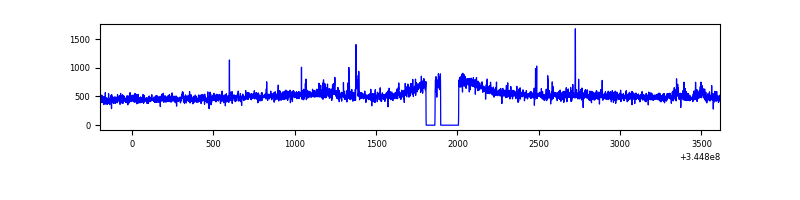 |
| C | 3812 | 3648 | 2 | 2 | 0.05% | 0.05% | 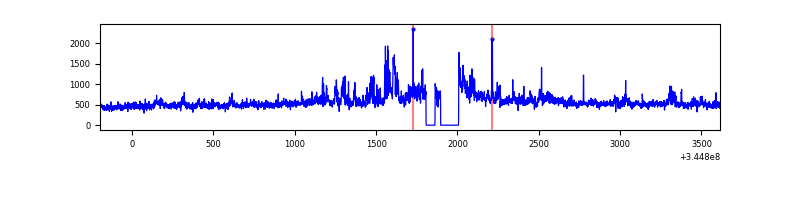 |
| D | 3812 | 3649 | 172 | 172 | 4.51% | 4.71% | 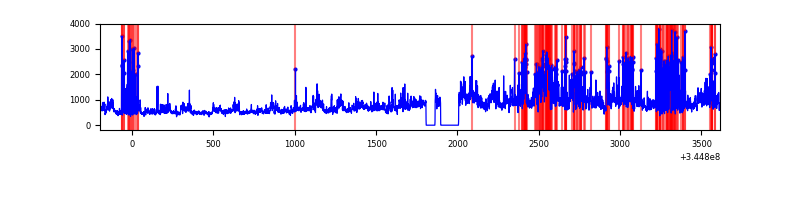 |
Top three noisy pixels from each quadrant. If the there are fewer than three noisy pixels in the level2.evt file, extra rows are filled as -1
| Pixel properties | Quadrant properties | ||||||
|---|---|---|---|---|---|---|---|
| Quadrant | DetID | PixID | Counts | Sigma | Mean | Median | Sigma |
| A | 1 | 113 | 13096 | 128.57 | 482 | 472 | 98.2 |
| A | 0 | 13 | 12047 | 117.89 | 482 | 472 | 98.2 |
| A | 13 | 254 | 6169 | 58.02 | 482 | 472 | 98.2 |
| B | 10 | 245 | 16837 | 178.9 | 472 | 459 | 91.6 |
| B | 12 | 111 | 11126 | 116.51 | 472 | 459 | 91.6 |
| B | 4 | 52 | 10776 | 112.69 | 472 | 459 | 91.6 |
| C | 3 | 233 | 310849 | 2928.26 | 449 | 450 | 106.0 |
| C | 14 | 238 | 70805 | 663.72 | 449 | 450 | 106.0 |
| C | 2 | 16 | 3916 | 32.7 | 449 | 450 | 106.0 |
| D | 8 | 195 | 919058 | 8266.5 | 456 | 441 | 111.1 |
| D | 1 | 52 | 438412 | 3941.24 | 456 | 441 | 111.1 |
| D | 2 | 250 | 53098 | 473.85 | 456 | 441 | 111.1 |
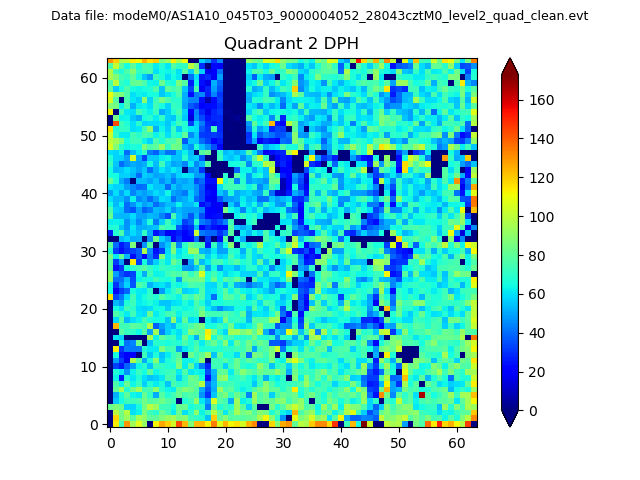
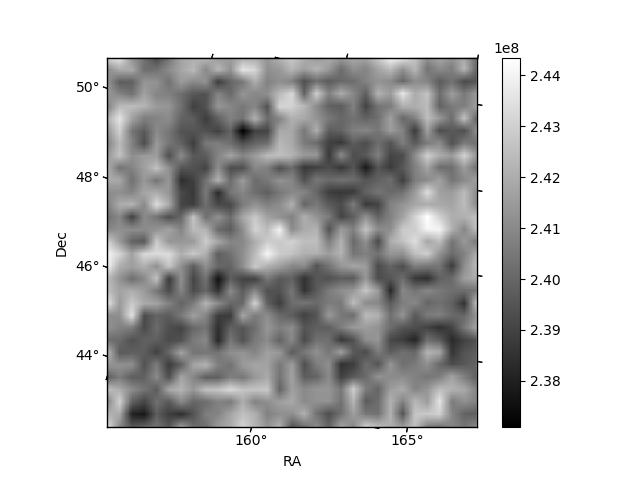
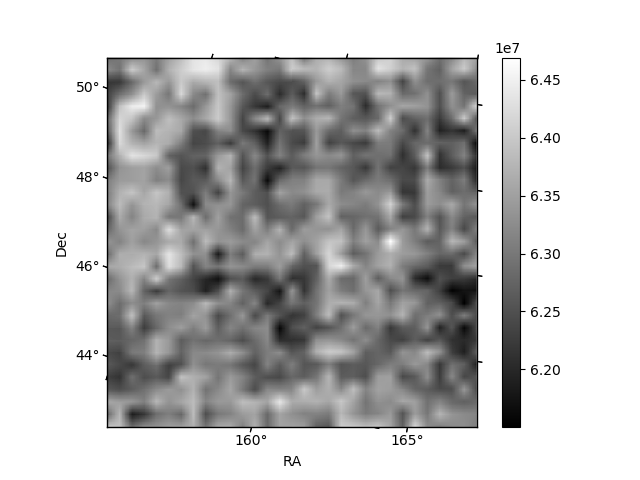
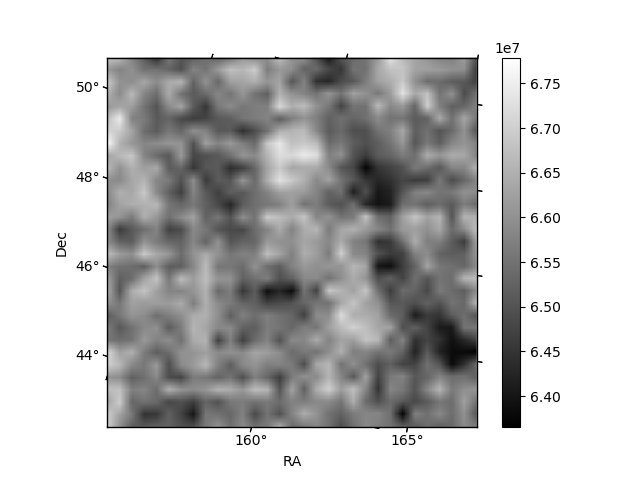
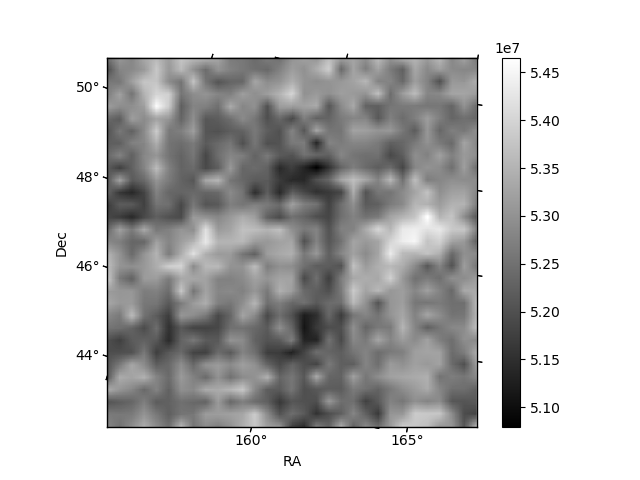
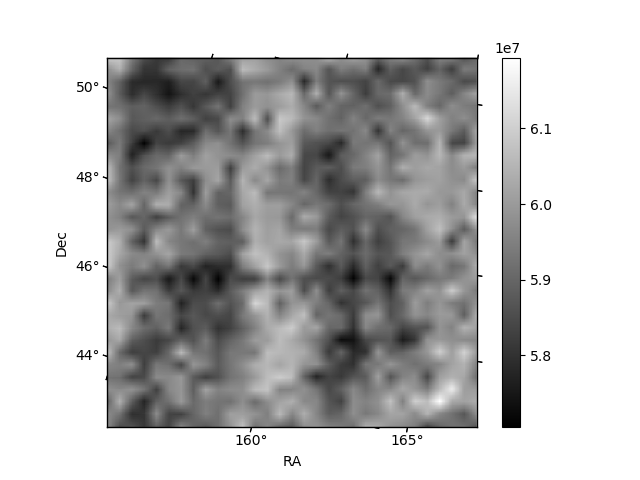
Histogram calculated using DETX and DETY for each event in the final _common_clean file
| Quadrant A | 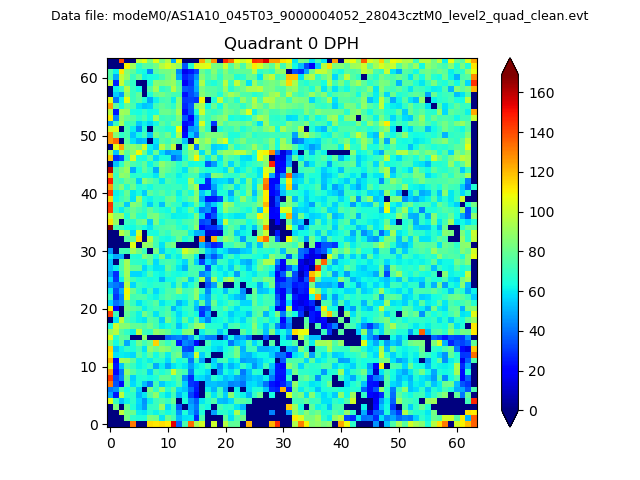 |
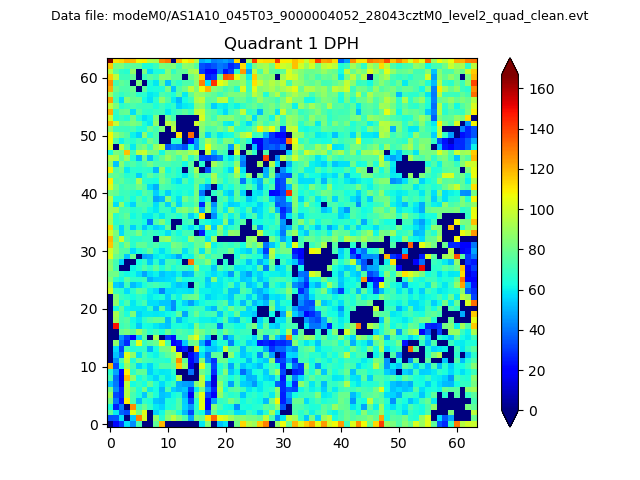 |
Quadrant B |
|---|---|---|---|
| Quadrant D | 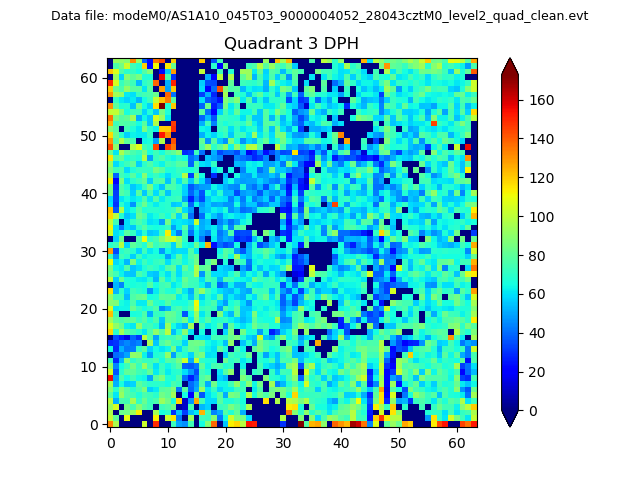 |
 |
Quadrant C |
| Plot type | Count rate plots | Images |
|---|---|---|
| Comparison with Poisson distribution Blue bars denote a histogram of data divided into 1 sec bins. Red curve is a Poisson curve with rate = median count rate of data. |
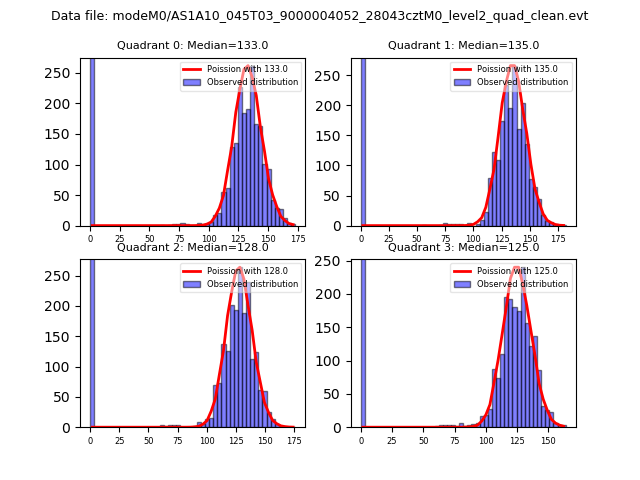 |
 |
| Quadrant-wise count rates Data is divided into 100 sec bins |
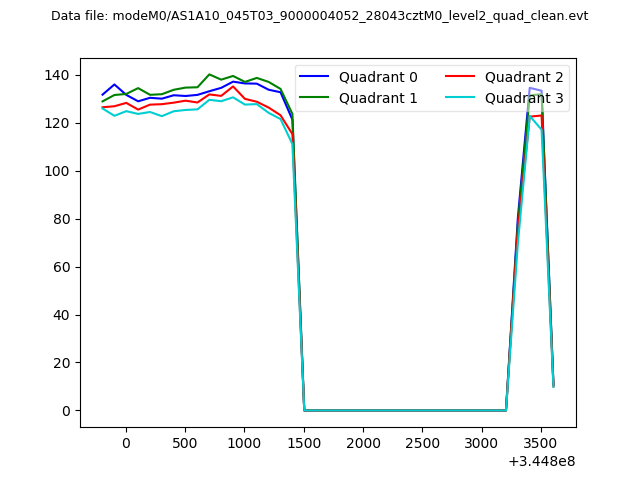 |
|
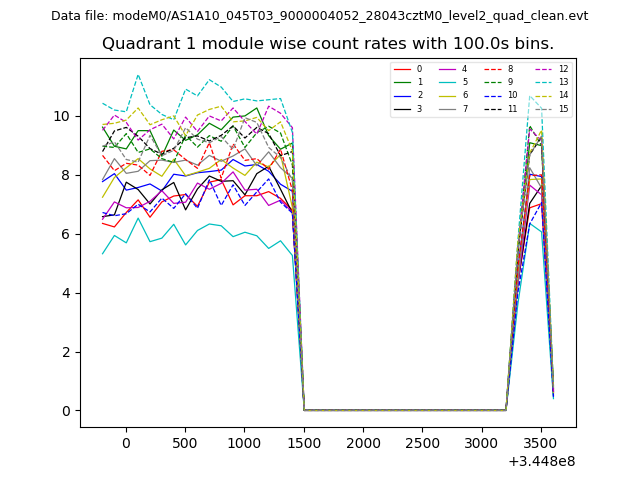
| Module-wise count rates for Quadrant A Data is divided into 100 sec bins |
 |
 |
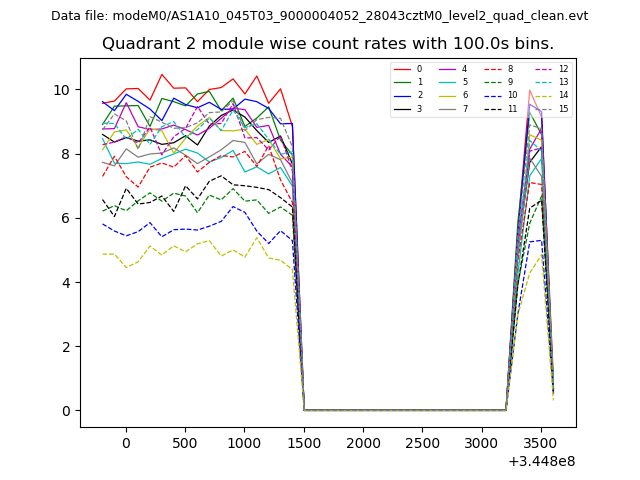
| Module-wise count rates for Quadrant B Data is divided into 100 sec bins |
 |
 |
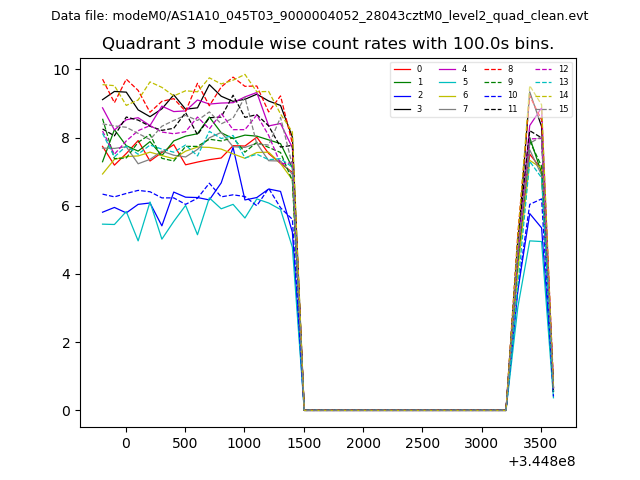
| Module-wise count rates for Quadrant C Data is divided into 100 sec bins |
 |
 |
| Module-wise count rates for Quadrant D Data is divided into 100 sec bins |
 |
 |
| Parameter | Plot |
|---|---|
| CZT HV Monitor | 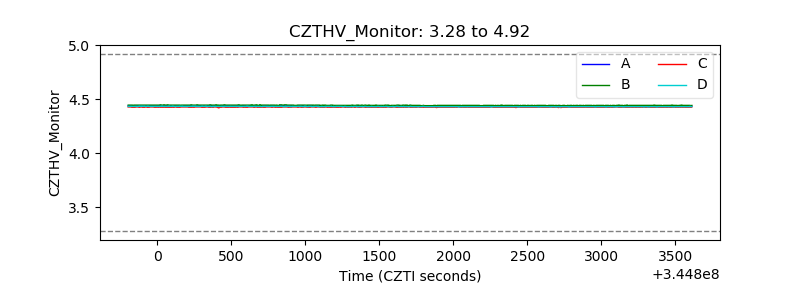 |
| D_VDD | 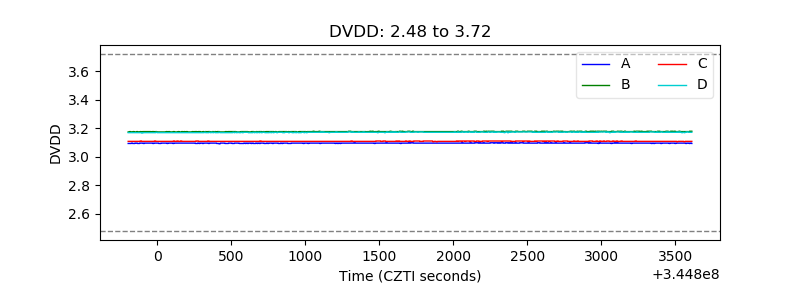 |
| Temperature 1 |  |
| Veto HV Monitor | 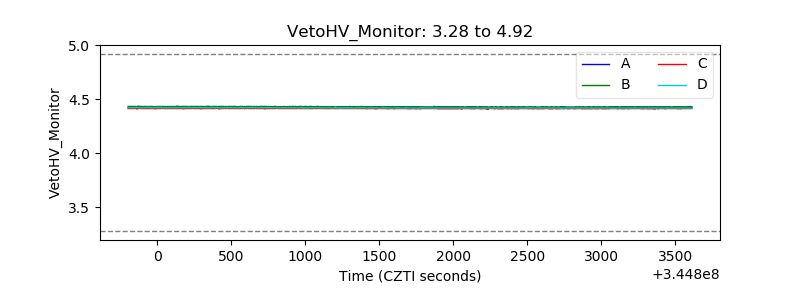 |
| Veto LLD | 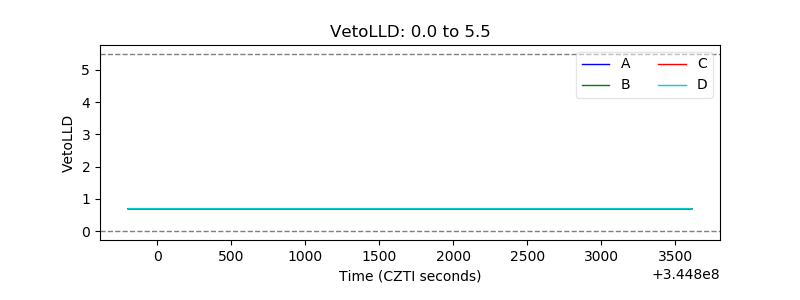 |
| Alpha Counter | 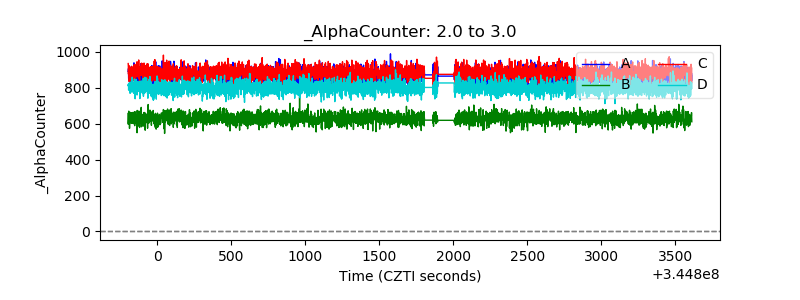 |
| _CPM_Rate | 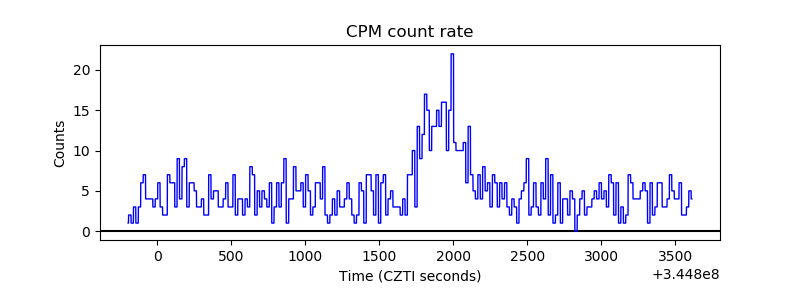 |
| CZT Counter | 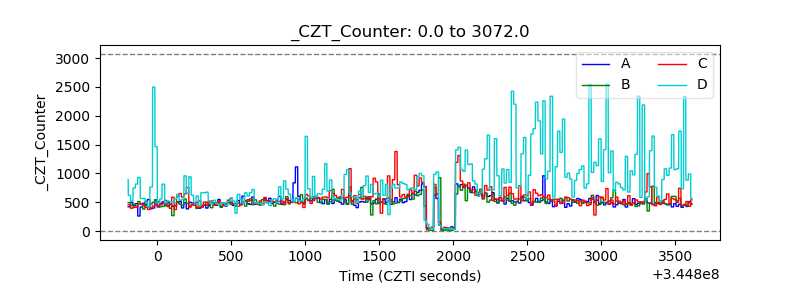 |
| +2.5 Volts monitor |  |
| +5 Volts monitor |  |
| _ROLL_ROT | 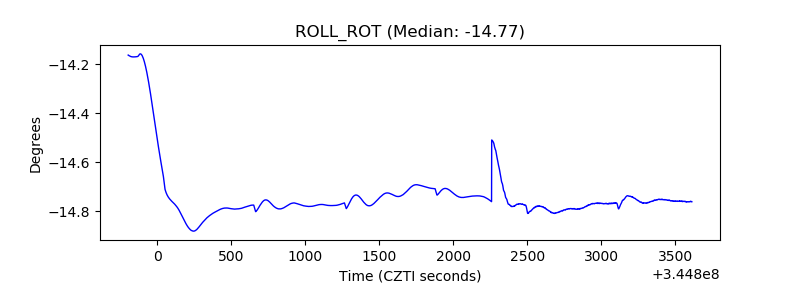 |
| _Roll_DEC | 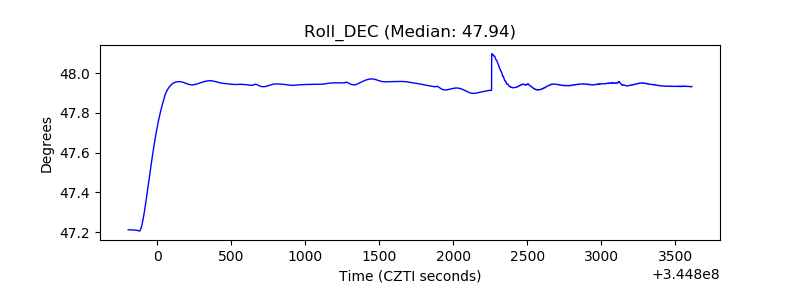 |
| _Roll_RA | 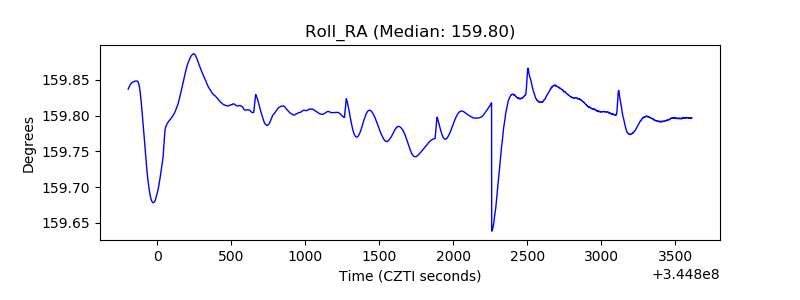 |
| Veto Counter |  |