| Param | Original file | Final file |
|---|---|---|
| Filename | modeM0/AS1A10_045T03_9000004052_28046cztM0_level2.evt | modeM0/AS1A10_045T03_9000004052_28046cztM0_level2_quad_clean.evt |
| Size (bytes) | 1,554,143,040 | 262,869,120 |
| Size | 1.4 GB | 250.7 MB |
| Events in quadrant A | 8,578,521 | 1,737,205 |
| Events in quadrant B | 8,846,017 | 1,738,784 |
| Events in quadrant C | 9,177,076 | 1,665,972 |
| Events in quadrant D | 19,218,985 | 1,545,920 |
| Mode M0 | |||
|---|---|---|---|
| Quadrant | BADHDUFLAG | Total packets | Discarded packets |
| A | 0 | 37748 | 0 |
| B | 0 | 38482 | 0 |
| C | 0 | 39299 | 0 |
| D | 0 | 69877 | 0 |
| Mode M9 | |||
|---|---|---|---|
| Quadrant | BADHDUFLAG | Total packets | Discarded packets |
| A | 0 | 17 | 0 |
| B | 0 | 17 | 0 |
| C | 0 | 17 | 0 |
| D | 0 | 17 | 0 |
| Quadrant | Total seconds | Saturated seconds | Saturation percentage |
|---|---|---|---|
| A | 18483 | 87 | 0.470703% |
| B | 18484 | 148 | 0.800692% |
| C | 18484 | 253 | 1.368751% |
| D | 18484 | 2595 | 14.039169% |
Noise dominated data is calculated using 1-second bins in cleaned event files. If a bin has >2000 counts, and if more than 50% of those come from <1% of pixels, then it is considered to be noise-dominated and hence unusable.
| Quadrant | # 1 sec bins | Bins with >0 counts | Bins with >2000 counts | High rate bins dominated by noise | Noise dominated (total time) | Noise dominated (detector-on time) | Marked lightcurve |
|---|---|---|---|---|---|---|---|
| A | 20203 | 18486 | 0 | 0 | 0.00% | 0.00% | 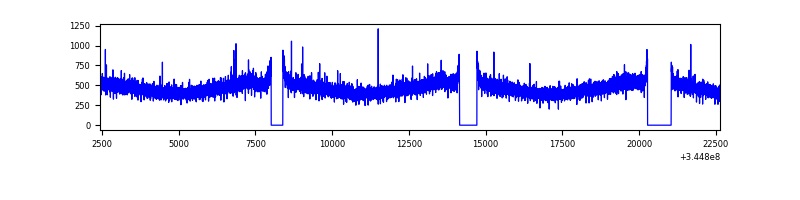 |
| B | 20204 | 18485 | 39 | 39 | 0.19% | 0.21% | 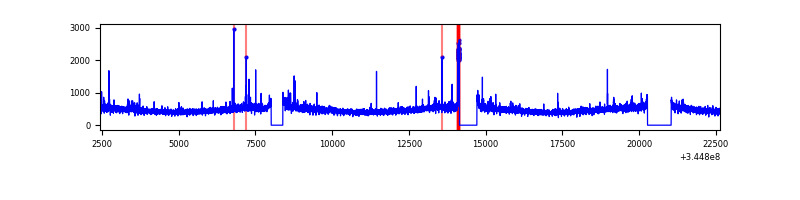 |
| C | 20204 | 18486 | 2 | 2 | 0.01% | 0.01% | 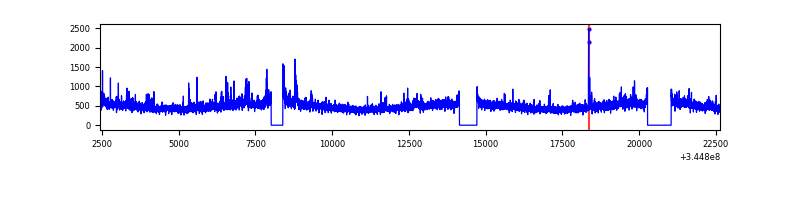 |
| D | 20204 | 18485 | 2312 | 2312 | 11.44% | 12.51% | 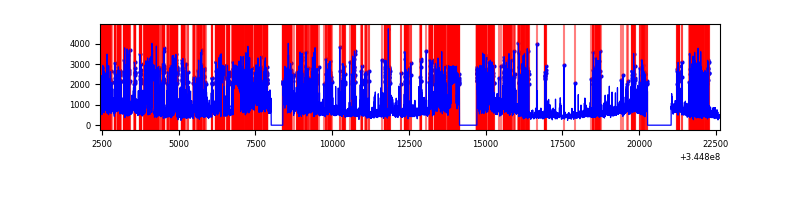 |
Top three noisy pixels from each quadrant. If the there are fewer than three noisy pixels in the level2.evt file, extra rows are filled as -1
| Pixel properties | Quadrant properties | ||||||
|---|---|---|---|---|---|---|---|
| Quadrant | DetID | PixID | Counts | Sigma | Mean | Median | Sigma |
| A | 0 | 13 | 35811 | 76.08 | 2210 | 2167 | 442.2 |
| A | 13 | 254 | 31889 | 67.21 | 2210 | 2167 | 442.2 |
| A | 3 | 137 | 21513 | 43.75 | 2210 | 2167 | 442.2 |
| B | 10 | 245 | 132873 | 318.41 | 2184 | 2132 | 410.6 |
| B | 4 | 200 | 53074 | 124.07 | 2184 | 2132 | 410.6 |
| B | 12 | 111 | 52159 | 121.84 | 2184 | 2132 | 410.6 |
| C | 3 | 233 | 581032 | 1180.62 | 2110 | 2123 | 490.3 |
| C | 14 | 238 | 337883 | 684.75 | 2110 | 2123 | 490.3 |
| C | 15 | 208 | 33596 | 64.19 | 2110 | 2123 | 490.3 |
| D | 8 | 195 | 4426025 | 9199.51 | 2018 | 1966 | 480.9 |
| D | 1 | 52 | 4411182 | 9168.65 | 2018 | 1966 | 480.9 |
| D | 7 | 69 | 1248759 | 2592.62 | 2018 | 1966 | 480.9 |
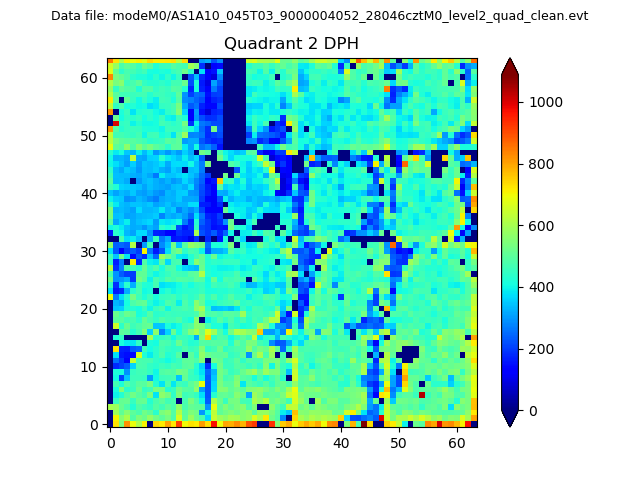
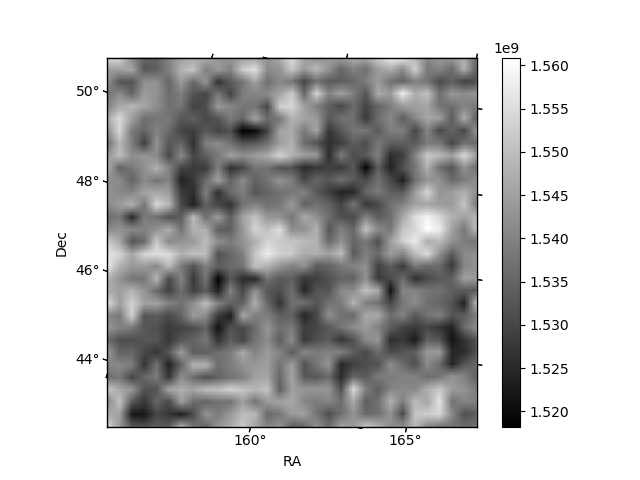
Histogram calculated using DETX and DETY for each event in the final _common_clean file
| Quadrant A | 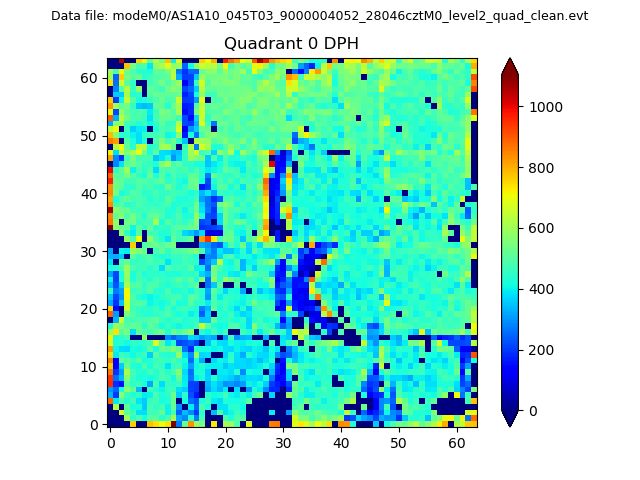 |
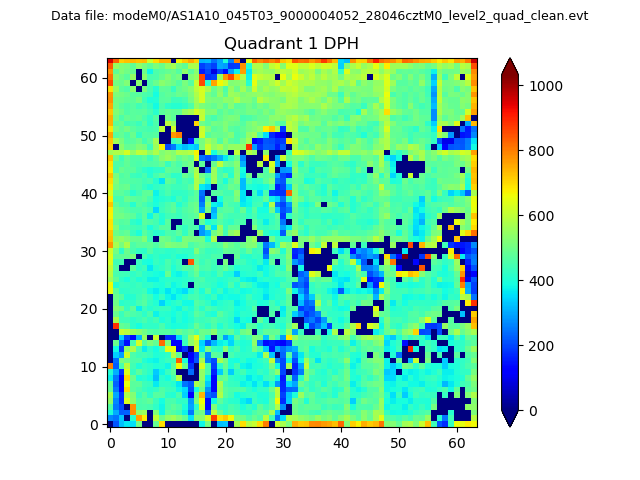 |
Quadrant B |
|---|---|---|---|
| Quadrant D | 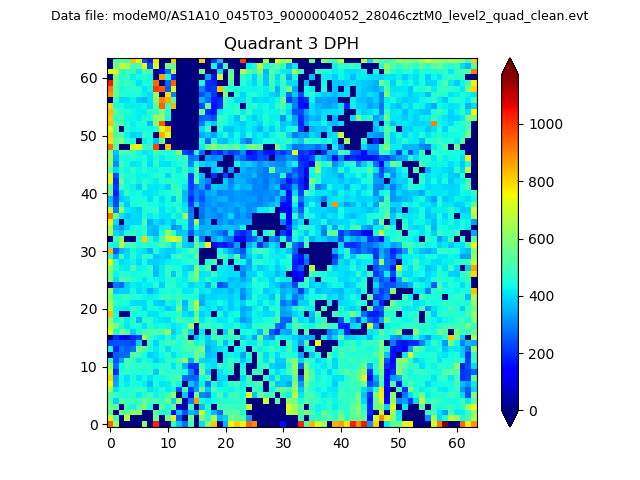 |
 |
Quadrant C |
| Plot type | Count rate plots | Images |
|---|---|---|
| Comparison with Poisson distribution Blue bars denote a histogram of data divided into 1 sec bins. Red curve is a Poisson curve with rate = median count rate of data. |
 |
 |
| Quadrant-wise count rates Data is divided into 100 sec bins |
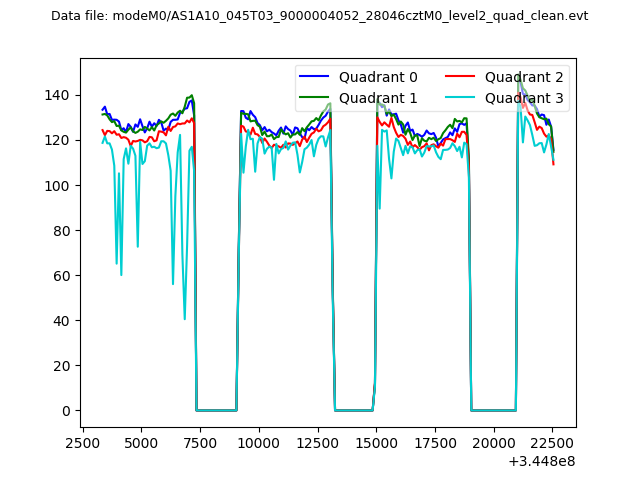 |
|
| Module-wise count rates for Quadrant A Data is divided into 100 sec bins |
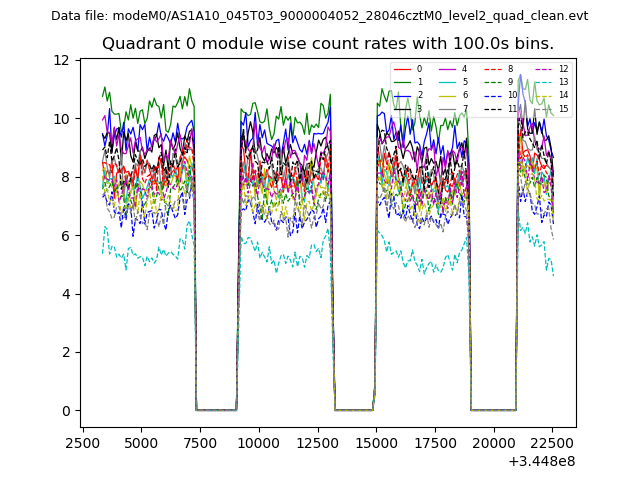 |
 |
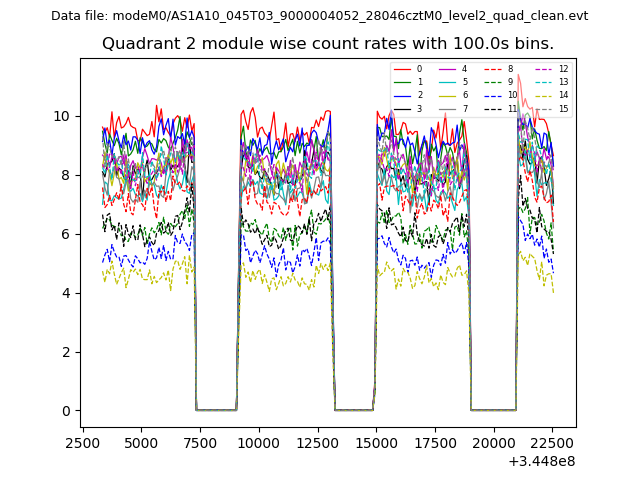
| Module-wise count rates for Quadrant B Data is divided into 100 sec bins |
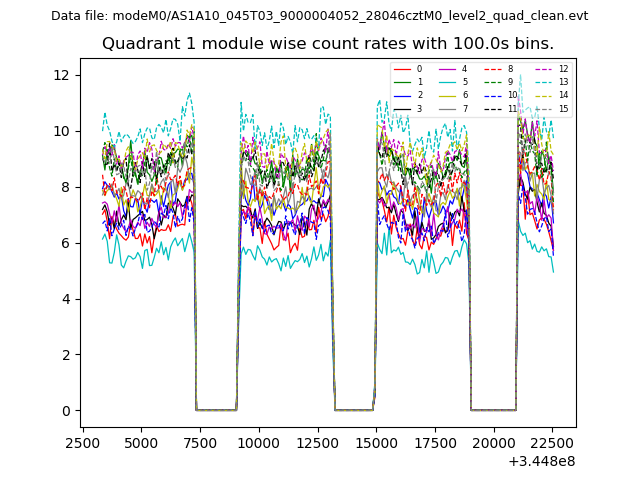 |
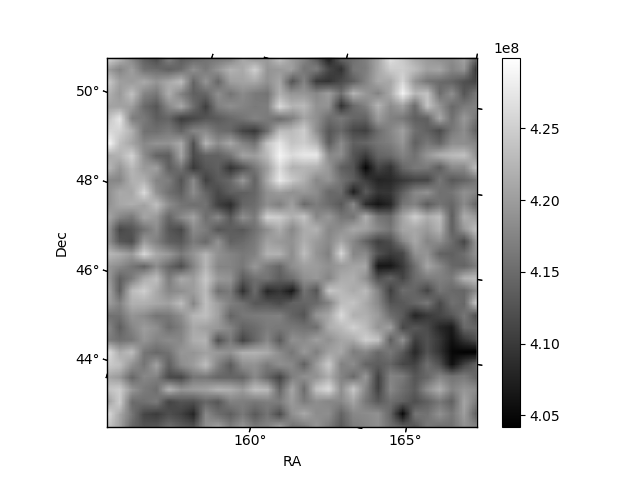 |
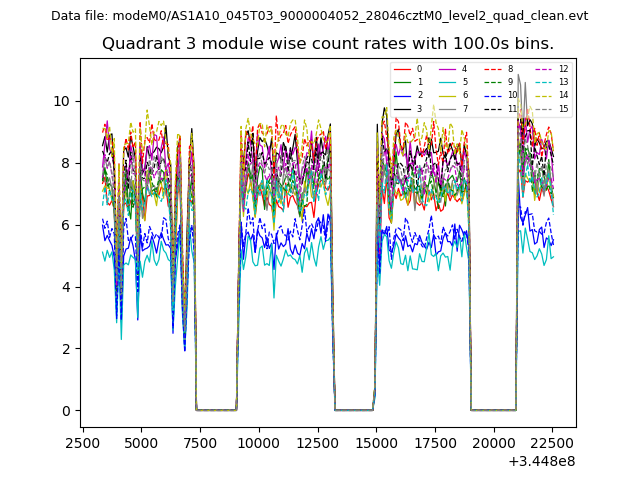
| Module-wise count rates for Quadrant C Data is divided into 100 sec bins |
 |
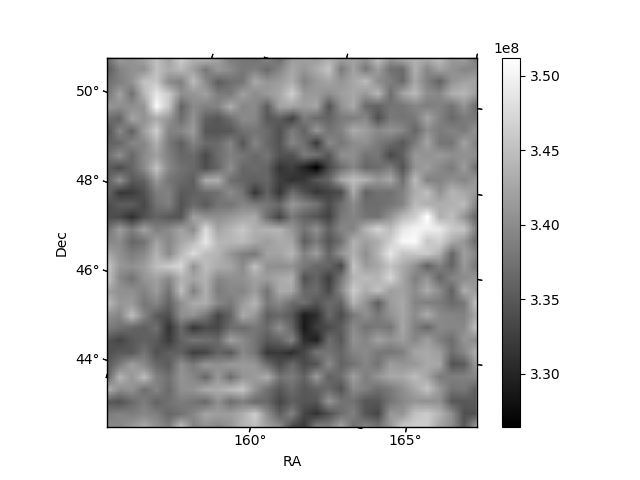 |
| Module-wise count rates for Quadrant D Data is divided into 100 sec bins |
 |
 |
| Parameter | Plot |
|---|---|
| CZT HV Monitor | 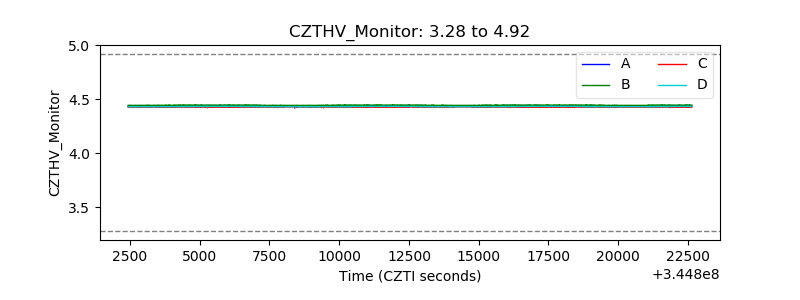 |
| D_VDD | 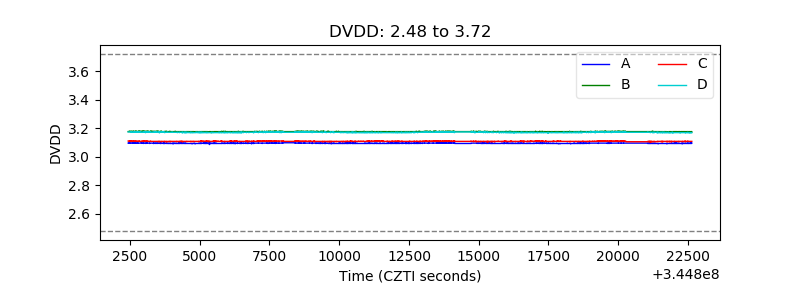 |
| Temperature 1 | 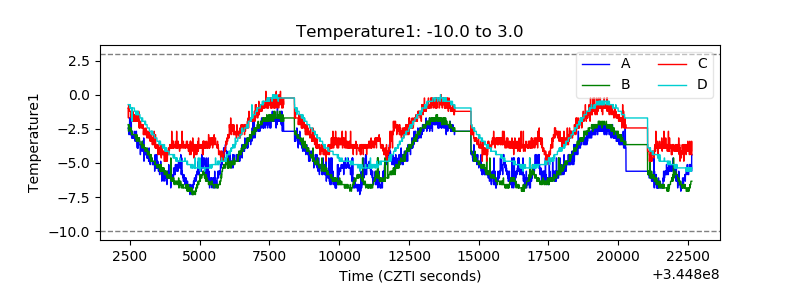 |
| Veto HV Monitor | 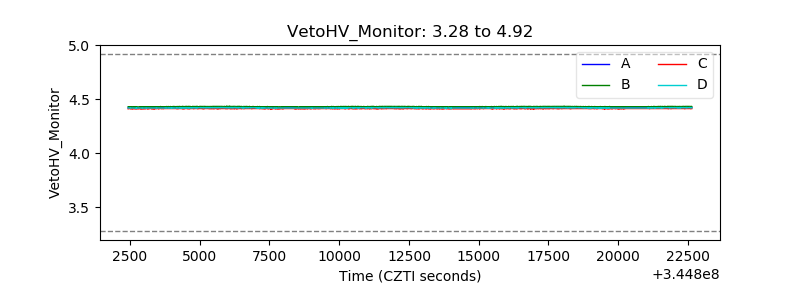 |
| Veto LLD | 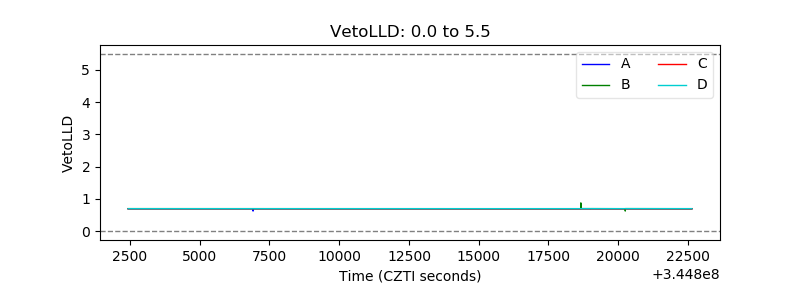 |
| Alpha Counter | 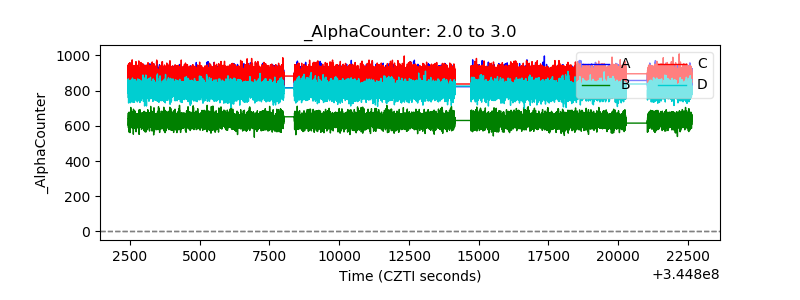 |
| _CPM_Rate | 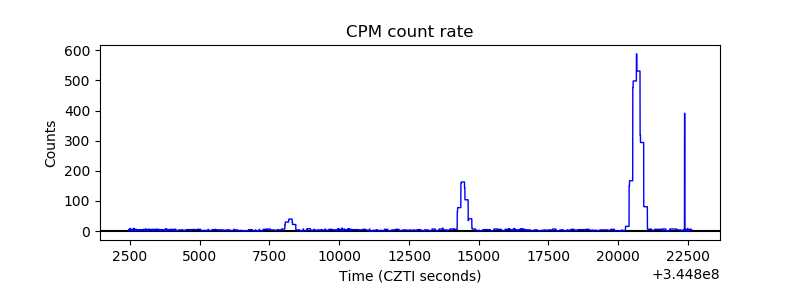 |
| CZT Counter | 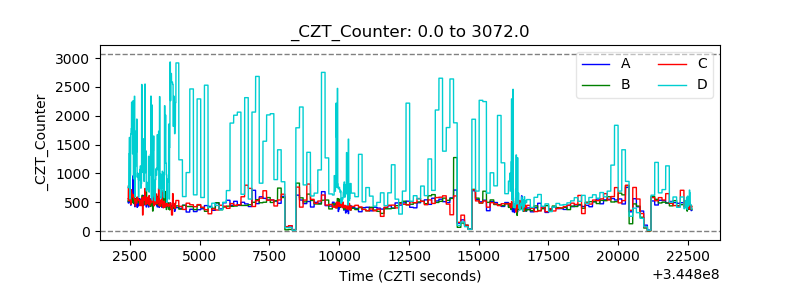 |
| +2.5 Volts monitor |  |
| +5 Volts monitor | 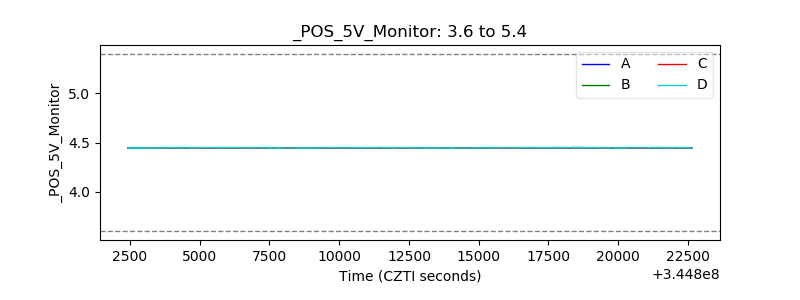 |
| _ROLL_ROT | 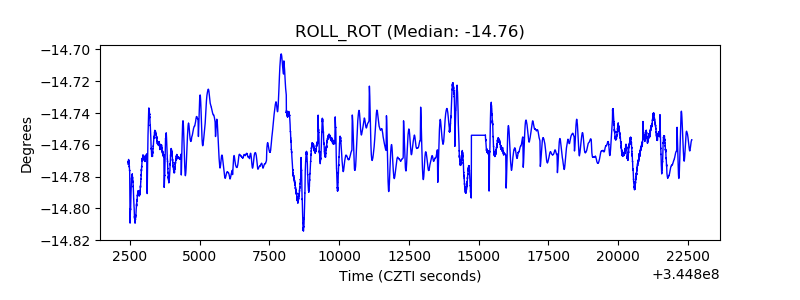 |
| _Roll_DEC |  |
| _Roll_RA | 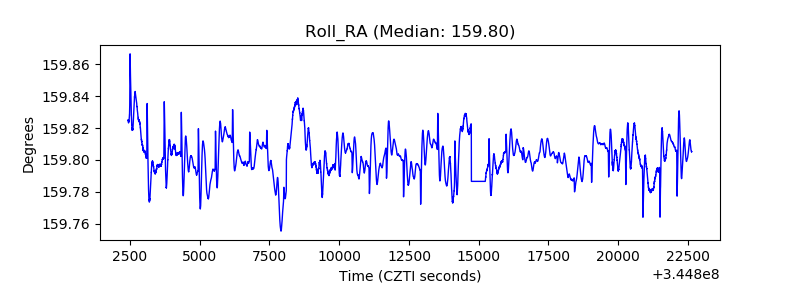 |
| Veto Counter | 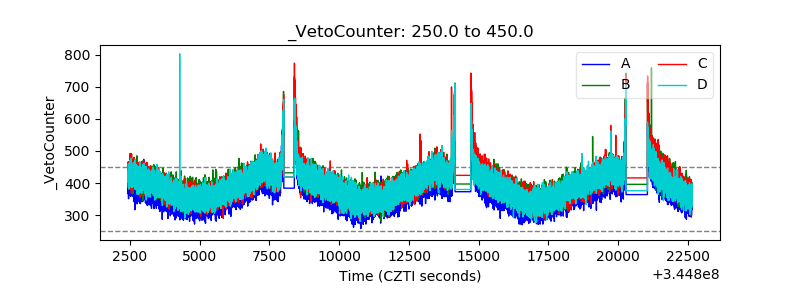 |