| Param | Original file | Final file |
|---|---|---|
| Filename | modeM0/AS1A10_045T03_9000004052_28047cztM0_level2.evt | modeM0/AS1A10_045T03_9000004052_28047cztM0_level2_quad_clean.evt |
| Size (bytes) | 525,720,960 | 105,197,760 |
| Size | 501.4 MB | 100.3 MB |
| Events in quadrant A | 3,211,246 | 695,757 |
| Events in quadrant B | 3,277,502 | 699,454 |
| Events in quadrant C | 3,580,260 | 664,920 |
| Events in quadrant D | 5,383,825 | 644,428 |
| Mode M0 | |||
|---|---|---|---|
| Quadrant | BADHDUFLAG | Total packets | Discarded packets |
| A | 0 | 14100 | 0 |
| B | 0 | 14282 | 0 |
| C | 0 | 15115 | 0 |
| D | 0 | 20800 | 0 |
| Mode M9 | |||
|---|---|---|---|
| Quadrant | BADHDUFLAG | Total packets | Discarded packets |
| A | 0 | 16 | 0 |
| B | 0 | 16 | 0 |
| C | 0 | 16 | 0 |
| D | 0 | 16 | 0 |
| Quadrant | Total seconds | Saturated seconds | Saturation percentage |
|---|---|---|---|
| A | 6903 | 33 | 0.478053% |
| B | 6903 | 61 | 0.883674% |
| C | 6903 | 99 | 1.434159% |
| D | 6904 | 406 | 5.880649% |
Noise dominated data is calculated using 1-second bins in cleaned event files. If a bin has >2000 counts, and if more than 50% of those come from <1% of pixels, then it is considered to be noise-dominated and hence unusable.
| Quadrant | # 1 sec bins | Bins with >0 counts | Bins with >2000 counts | High rate bins dominated by noise | Noise dominated (total time) | Noise dominated (detector-on time) | Marked lightcurve |
|---|---|---|---|---|---|---|---|
| A | 8618 | 6905 | 0 | 0 | 0.00% | 0.00% | 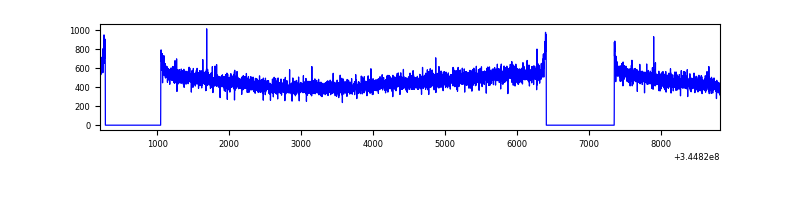 |
| B | 8618 | 6903 | 5 | 5 | 0.06% | 0.07% | 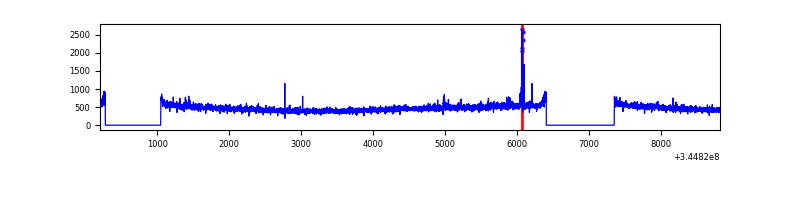 |
| C | 8618 | 6904 | 0 | 0 | 0.00% | 0.00% | 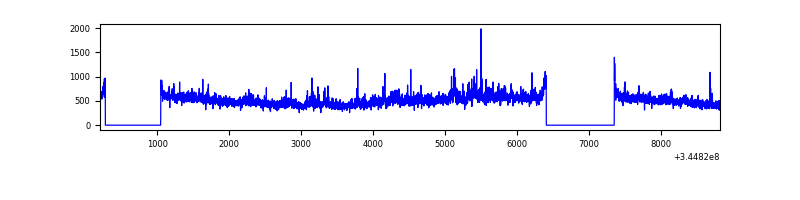 |
| D | 8619 | 6906 | 328 | 328 | 3.81% | 4.75% | 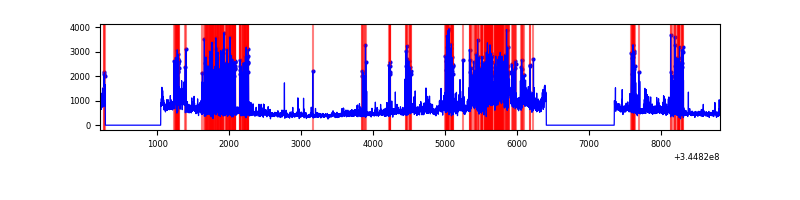 |
Top three noisy pixels from each quadrant. If the there are fewer than three noisy pixels in the level2.evt file, extra rows are filled as -1
| Pixel properties | Quadrant properties | ||||||
|---|---|---|---|---|---|---|---|
| Quadrant | DetID | PixID | Counts | Sigma | Mean | Median | Sigma |
| A | 13 | 254 | 11199 | 62.63 | 830 | 812 | 165.9 |
| A | 0 | 13 | 9596 | 52.96 | 830 | 812 | 165.9 |
| A | 3 | 137 | 8021 | 43.47 | 830 | 812 | 165.9 |
| B | 4 | 52 | 28080 | 172.78 | 824 | 804 | 157.9 |
| B | 12 | 111 | 19478 | 118.29 | 824 | 804 | 157.9 |
| B | 11 | 111 | 17762 | 107.42 | 824 | 804 | 157.9 |
| C | 3 | 233 | 327057 | 1775.55 | 793 | 798 | 183.8 |
| C | 14 | 238 | 129994 | 703.11 | 793 | 798 | 183.8 |
| C | 2 | 16 | 27952 | 147.78 | 793 | 798 | 183.8 |
| D | 8 | 195 | 1568388 | 8315.2 | 783 | 761 | 188.5 |
| D | 1 | 52 | 386441 | 2045.77 | 783 | 761 | 188.5 |
| D | 2 | 250 | 272316 | 1440.41 | 783 | 761 | 188.5 |
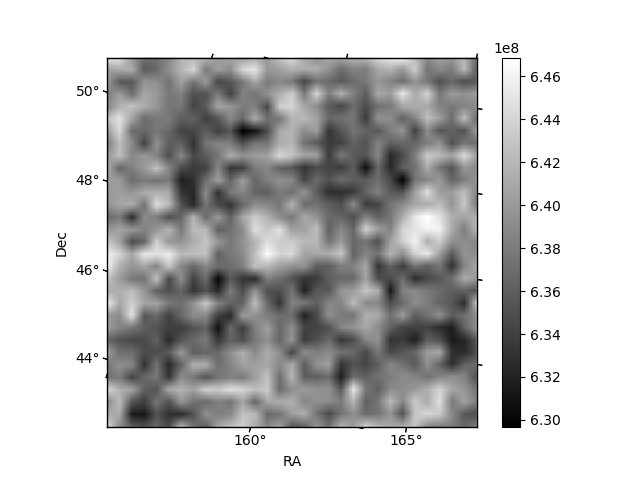
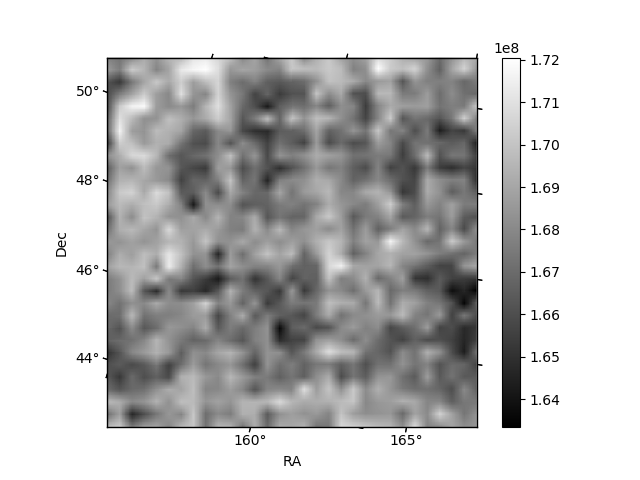
Histogram calculated using DETX and DETY for each event in the final _common_clean file
| Quadrant A | 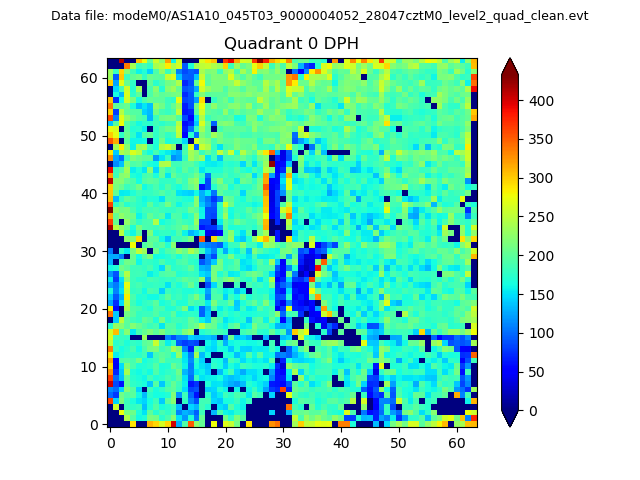 |
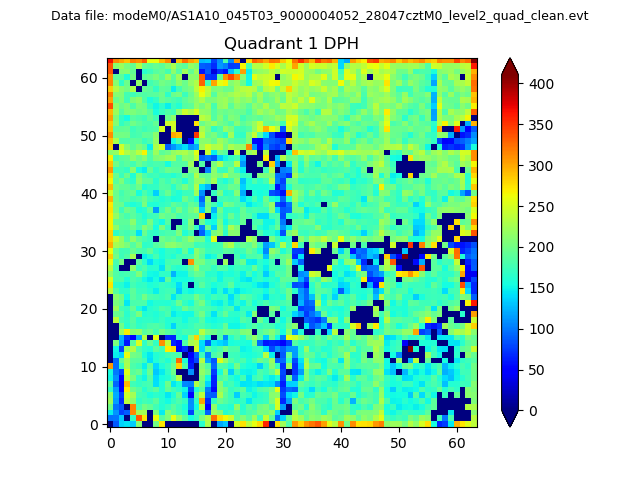 |
Quadrant B |
|---|---|---|---|
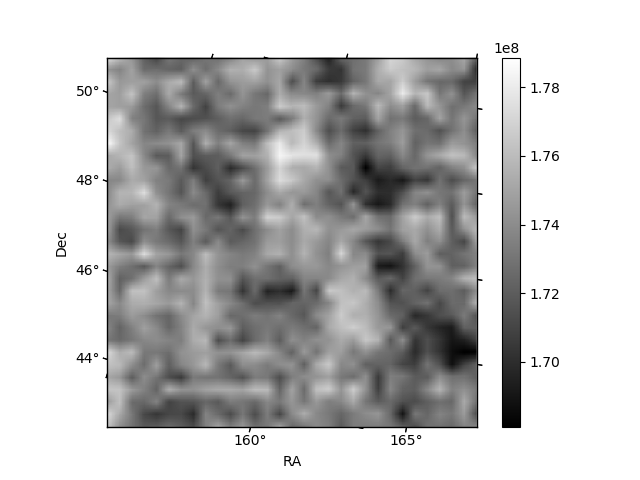
| Quadrant D | 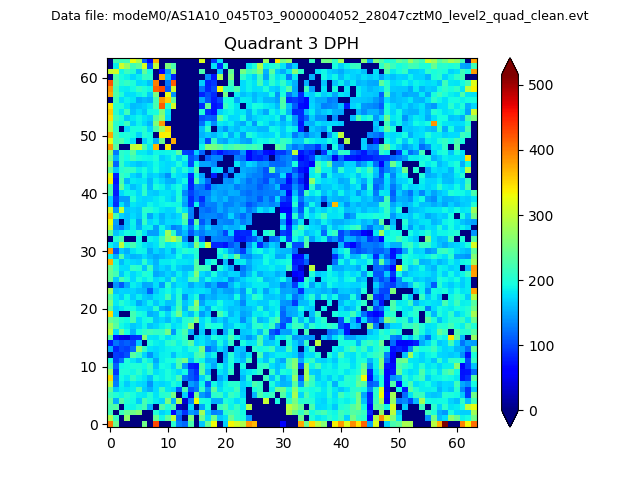 |
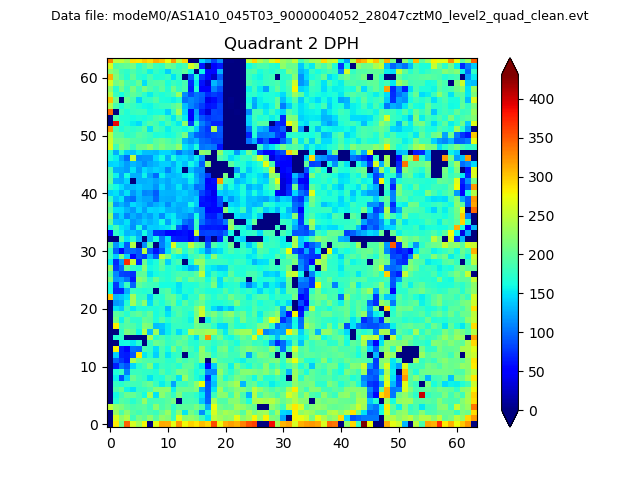 |
Quadrant C |
| Plot type | Count rate plots | Images |
|---|---|---|
| Comparison with Poisson distribution Blue bars denote a histogram of data divided into 1 sec bins. Red curve is a Poisson curve with rate = median count rate of data. |
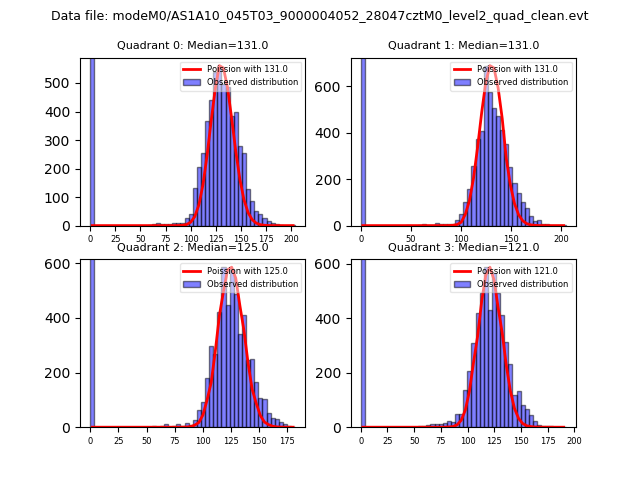 |
 |
| Quadrant-wise count rates Data is divided into 100 sec bins |
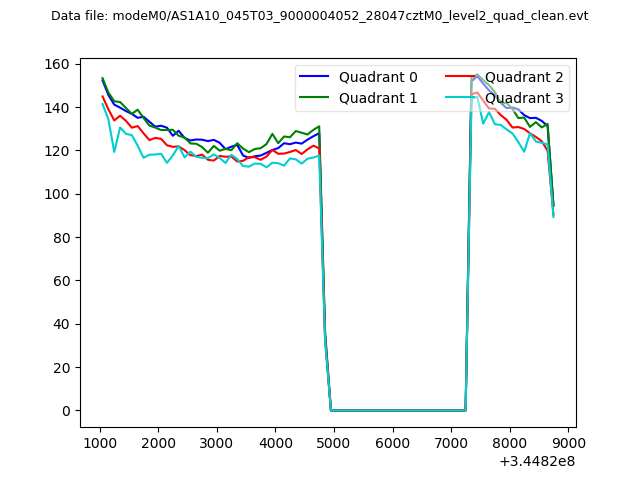 |
|
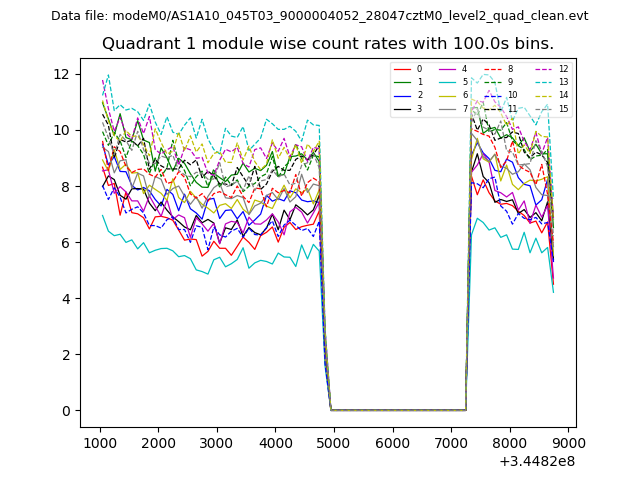
| Module-wise count rates for Quadrant A Data is divided into 100 sec bins |
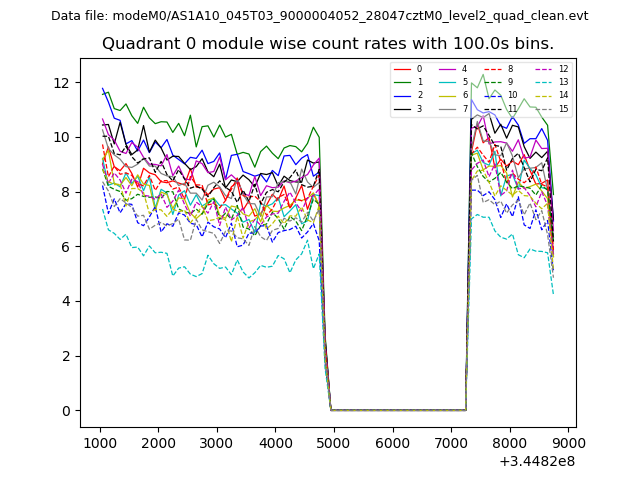 |
 |
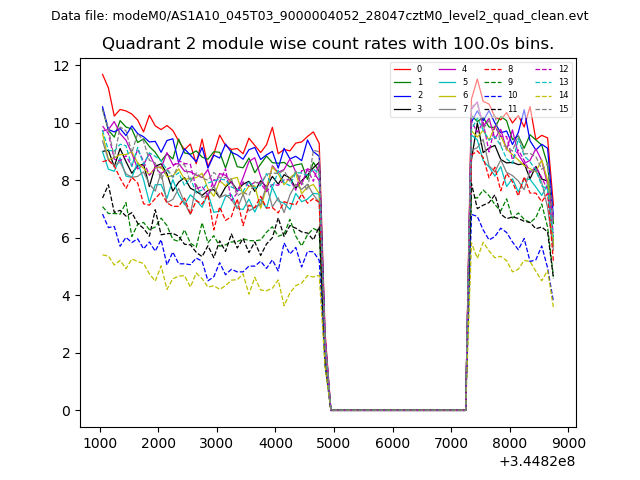
| Module-wise count rates for Quadrant B Data is divided into 100 sec bins |
 |
 |
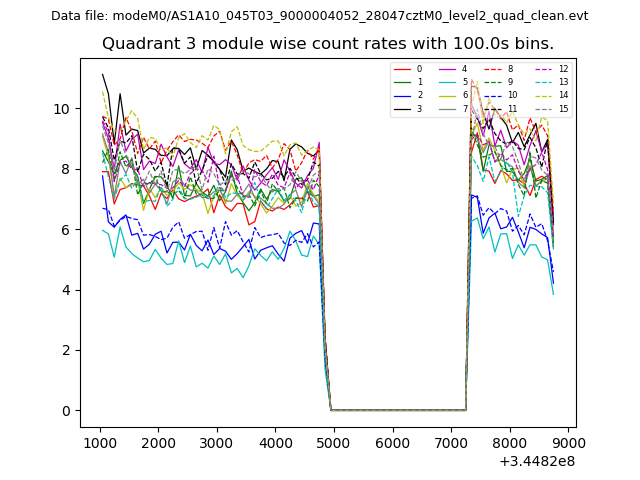
| Module-wise count rates for Quadrant C Data is divided into 100 sec bins |
 |
 |
| Module-wise count rates for Quadrant D Data is divided into 100 sec bins |
 |
 |
| Parameter | Plot |
|---|---|
| CZT HV Monitor | 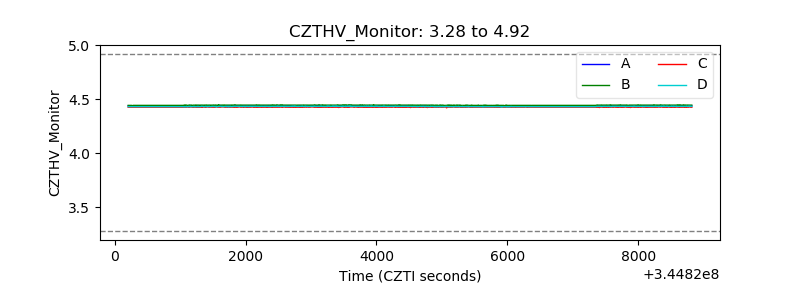 |
| D_VDD | 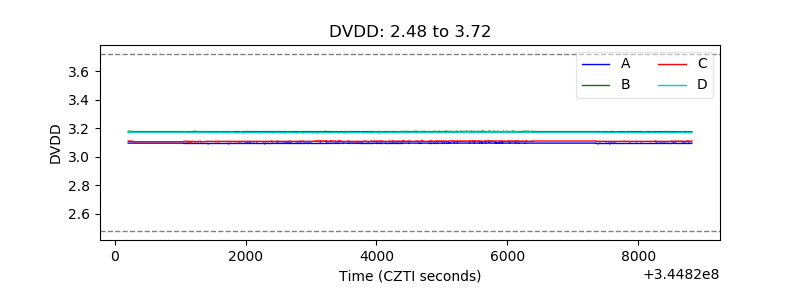 |
| Temperature 1 |  |
| Veto HV Monitor | 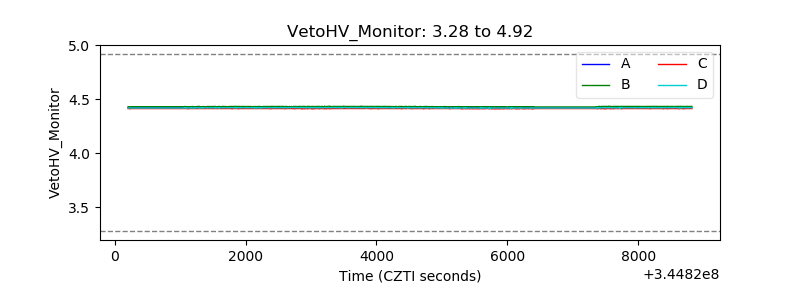 |
| Veto LLD | 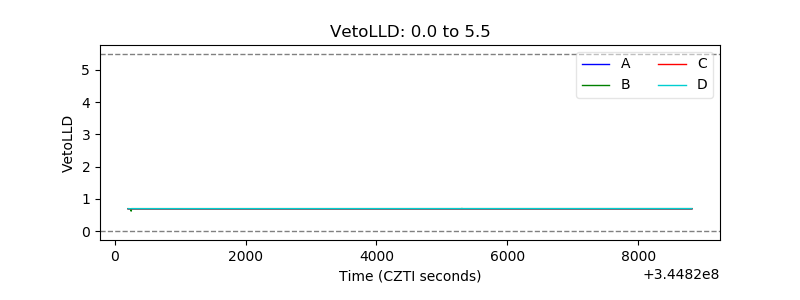 |
| Alpha Counter | 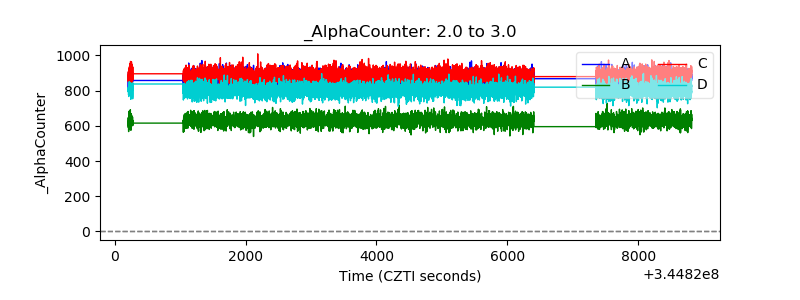 |
| _CPM_Rate | 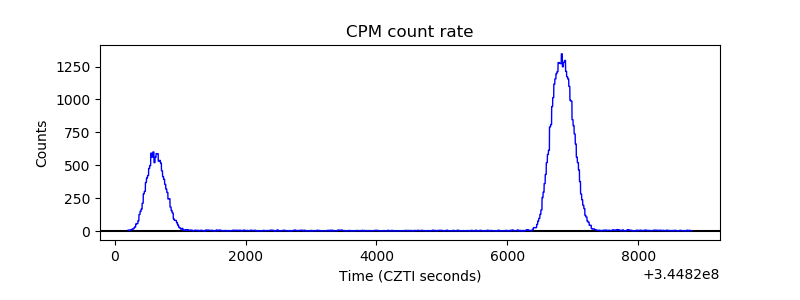 |
| CZT Counter | 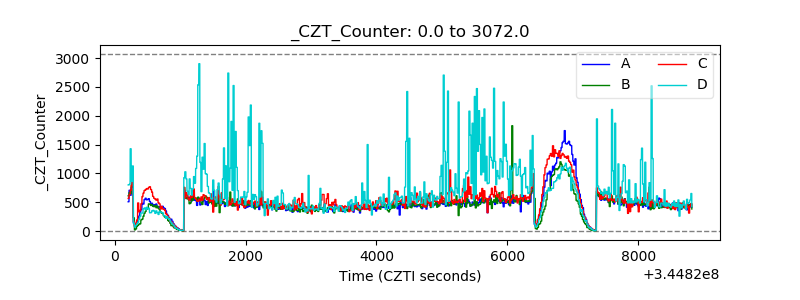 |
| +2.5 Volts monitor |  |
| +5 Volts monitor |  |
| _ROLL_ROT | 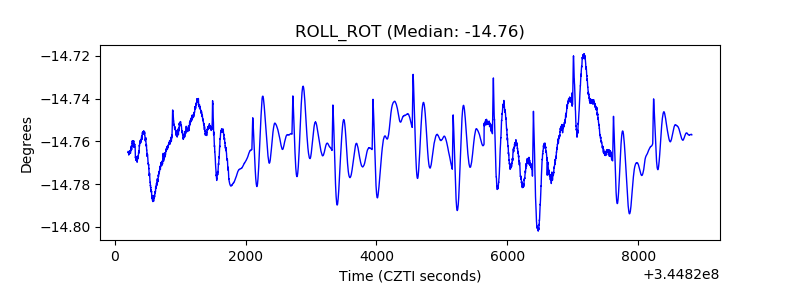 |
| _Roll_DEC | 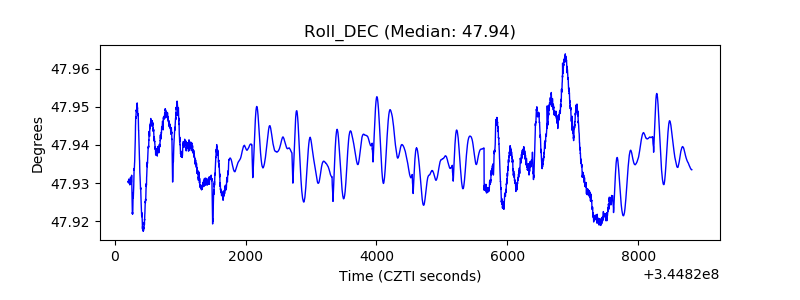 |
| _Roll_RA | 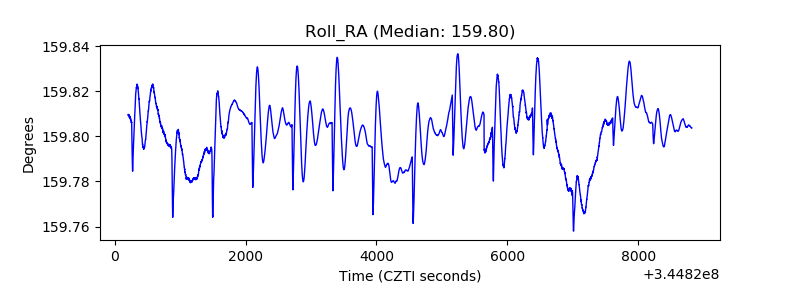 |
| Veto Counter | 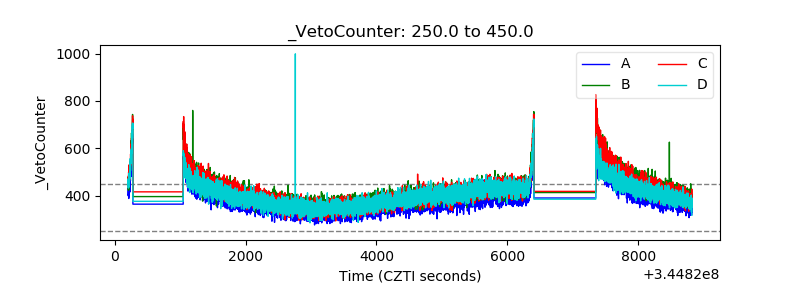 |