| Param | Original file | Final file |
|---|---|---|
| Filename | modeM0/AS1A10_045T03_9000004052_28050cztM0_level2.evt | modeM0/AS1A10_045T03_9000004052_28050cztM0_level2_quad_clean.evt |
| Size (bytes) | 1,325,897,280 | 236,381,760 |
| Size | 1.2 GB | 225.4 MB |
| Events in quadrant A | 7,987,607 | 1,550,493 |
| Events in quadrant B | 7,943,374 | 1,567,901 |
| Events in quadrant C | 8,722,781 | 1,479,061 |
| Events in quadrant D | 14,383,837 | 1,420,872 |
| Mode M0 | |||
|---|---|---|---|
| Quadrant | BADHDUFLAG | Total packets | Discarded packets |
| A | 0 | 34500 | 0 |
| B | 0 | 34332 | 0 |
| C | 0 | 36643 | 0 |
| D | 0 | 54085 | 0 |
| Mode M9 | |||
|---|---|---|---|
| Quadrant | BADHDUFLAG | Total packets | Discarded packets |
| A | 0 | 32 | 0 |
| B | 0 | 32 | 0 |
| C | 0 | 32 | 0 |
| D | 0 | 32 | 0 |
| Quadrant | Total seconds | Saturated seconds | Saturation percentage |
|---|---|---|---|
| A | 16553 | 89 | 0.537667% |
| B | 16554 | 134 | 0.809472% |
| C | 16554 | 233 | 1.407515% |
| D | 16554 | 1654 | 9.991543% |
Noise dominated data is calculated using 1-second bins in cleaned event files. If a bin has >2000 counts, and if more than 50% of those come from <1% of pixels, then it is considered to be noise-dominated and hence unusable.
| Quadrant | # 1 sec bins | Bins with >0 counts | Bins with >2000 counts | High rate bins dominated by noise | Noise dominated (total time) | Noise dominated (detector-on time) | Marked lightcurve |
|---|---|---|---|---|---|---|---|
| A | 19733 | 16554 | 0 | 0 | 0.00% | 0.00% | 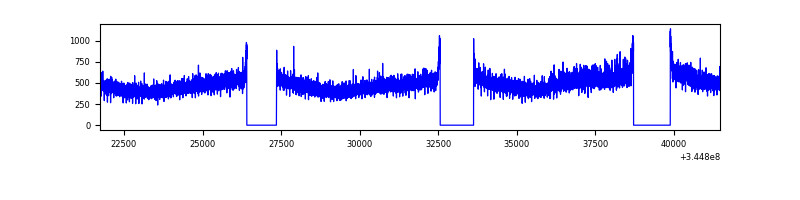 |
| B | 19734 | 16554 | 7 | 7 | 0.04% | 0.04% | 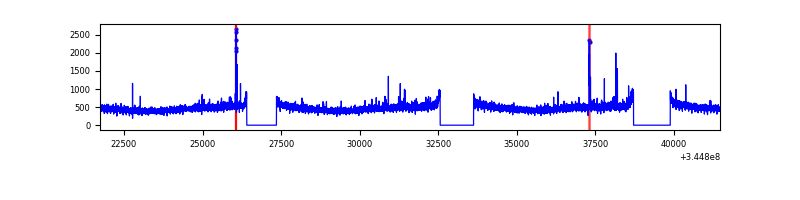 |
| C | 19734 | 16555 | 22 | 22 | 0.11% | 0.13% | 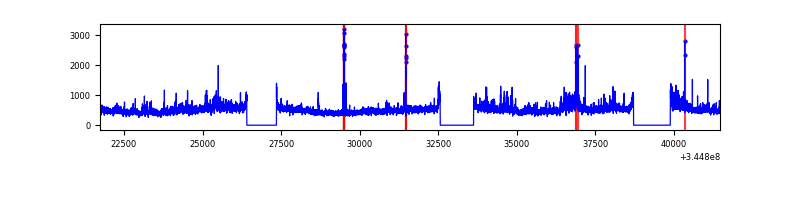 |
| D | 19734 | 16556 | 1521 | 1521 | 7.71% | 9.19% | 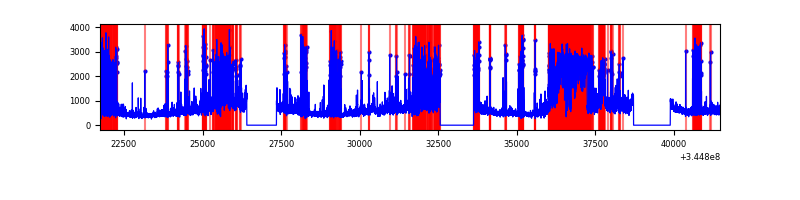 |
Top three noisy pixels from each quadrant. If the there are fewer than three noisy pixels in the level2.evt file, extra rows are filled as -1
| Pixel properties | Quadrant properties | ||||||
|---|---|---|---|---|---|---|---|
| Quadrant | DetID | PixID | Counts | Sigma | Mean | Median | Sigma |
| A | 0 | 13 | 212852 | 530.33 | 2015 | 1975 | 397.6 |
| A | 13 | 254 | 26223 | 60.98 | 2015 | 1975 | 397.6 |
| A | 3 | 137 | 19068 | 42.99 | 2015 | 1975 | 397.6 |
| B | 12 | 111 | 46128 | 118.58 | 1990 | 1943 | 372.6 |
| B | 4 | 52 | 43285 | 110.95 | 1990 | 1943 | 372.6 |
| B | 11 | 111 | 41738 | 106.8 | 1990 | 1943 | 372.6 |
| C | 3 | 233 | 713964 | 1627.17 | 1910 | 1925 | 437.6 |
| C | 14 | 238 | 313397 | 711.79 | 1910 | 1925 | 437.6 |
| C | 15 | 208 | 185339 | 419.14 | 1910 | 1925 | 437.6 |
| D | 8 | 195 | 3596013 | 8156.84 | 1866 | 1815 | 440.6 |
| D | 7 | 223 | 2042509 | 4631.25 | 1866 | 1815 | 440.6 |
| D | 2 | 250 | 699323 | 1582.96 | 1866 | 1815 | 440.6 |
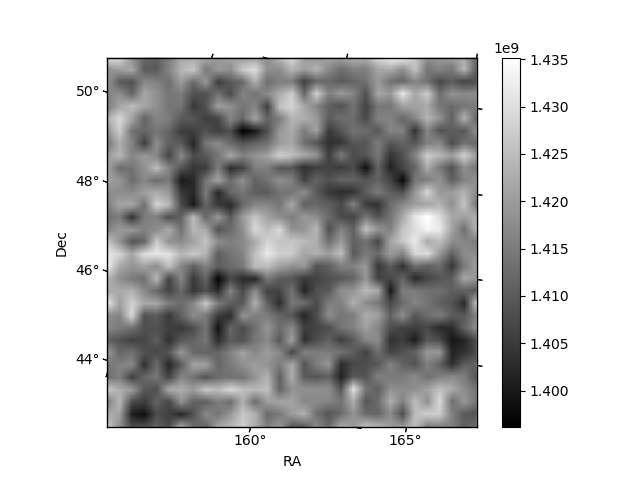
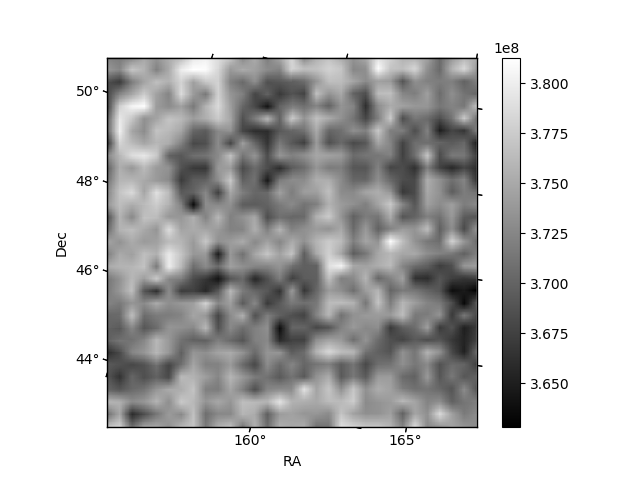
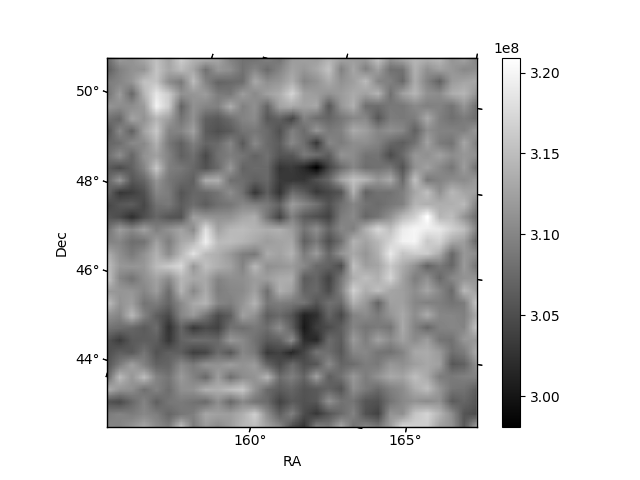
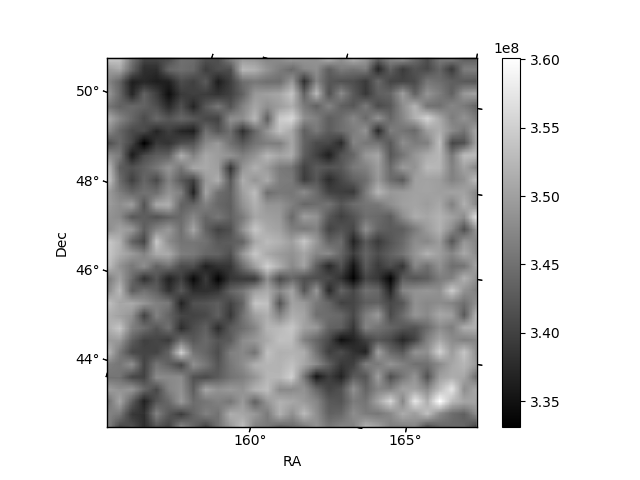
Histogram calculated using DETX and DETY for each event in the final _common_clean file
| Quadrant A | 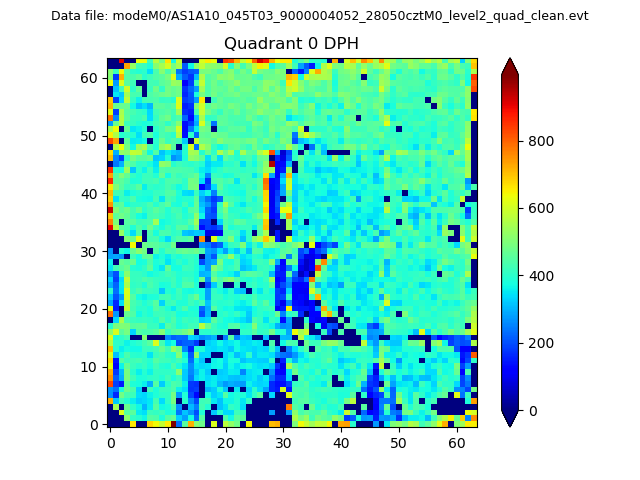 |
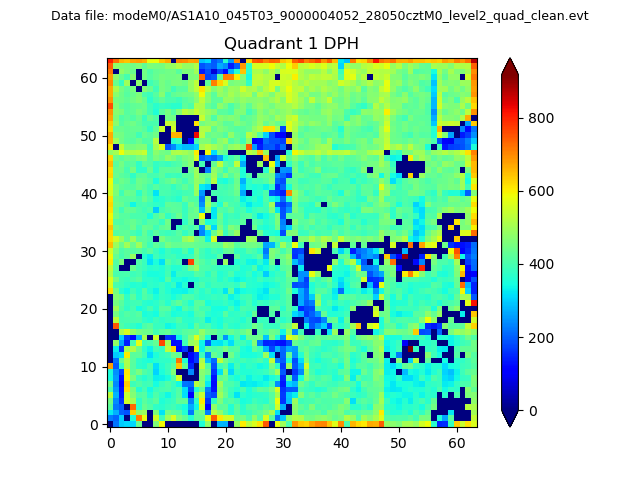 |
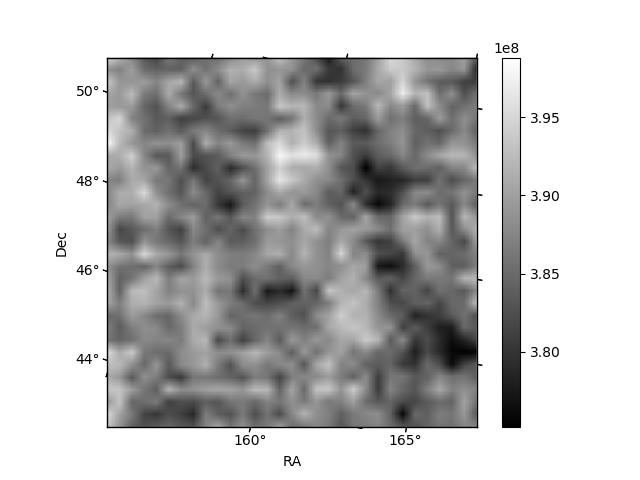
Quadrant B |
|---|---|---|---|
| Quadrant D | 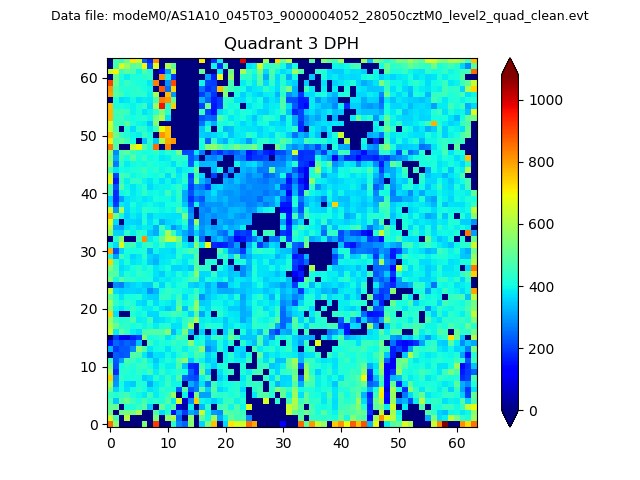 |
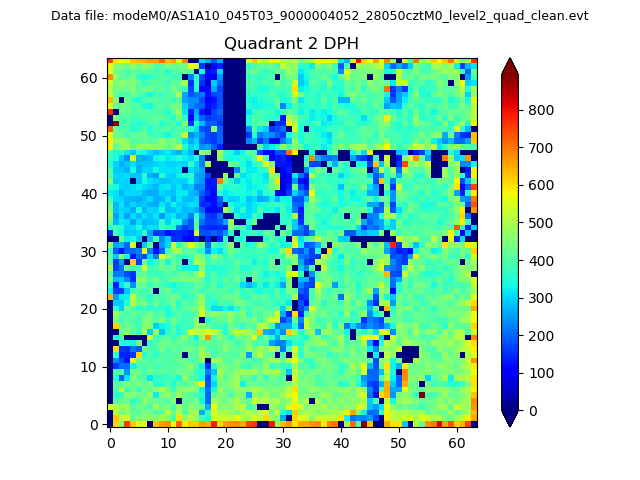 |
Quadrant C |
| Plot type | Count rate plots | Images |
|---|---|---|
| Comparison with Poisson distribution Blue bars denote a histogram of data divided into 1 sec bins. Red curve is a Poisson curve with rate = median count rate of data. |
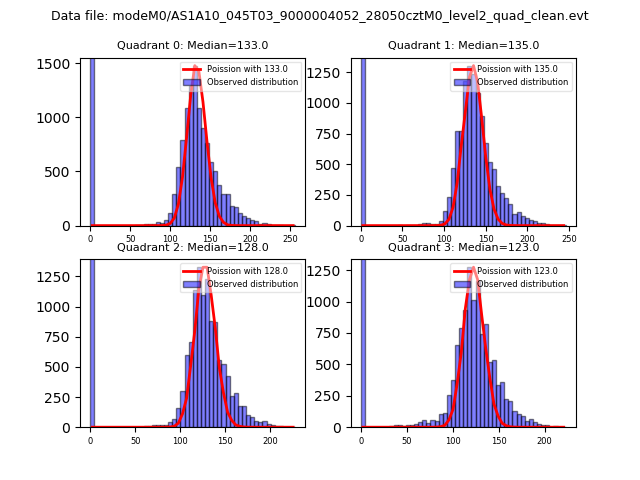 |
 |
| Quadrant-wise count rates Data is divided into 100 sec bins |
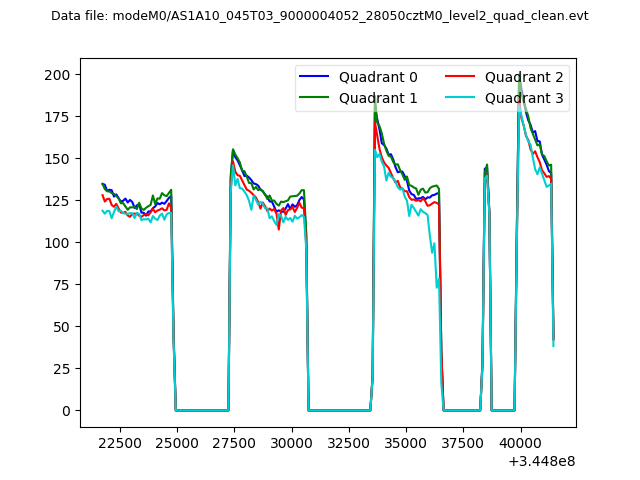 |
|
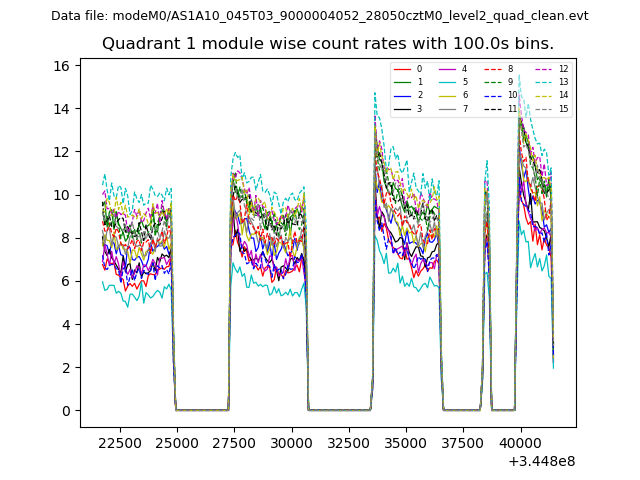
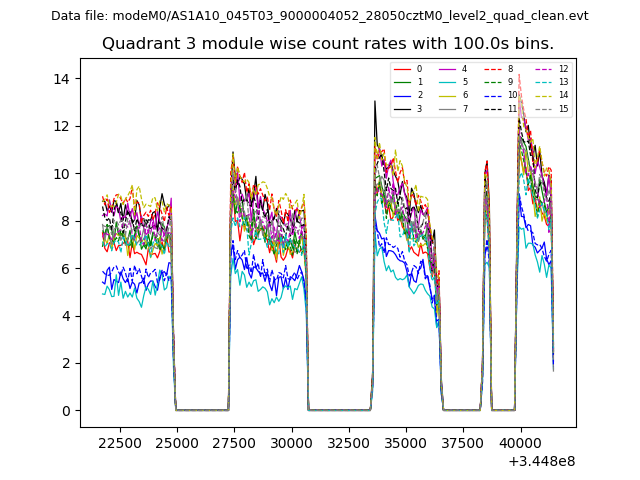
| Module-wise count rates for Quadrant A Data is divided into 100 sec bins |
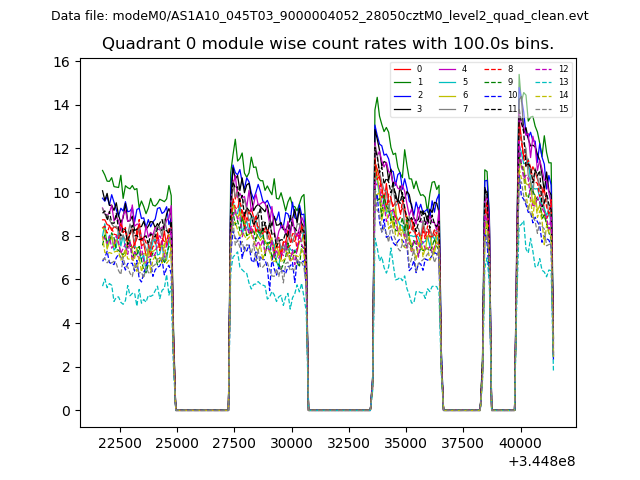 |
 |
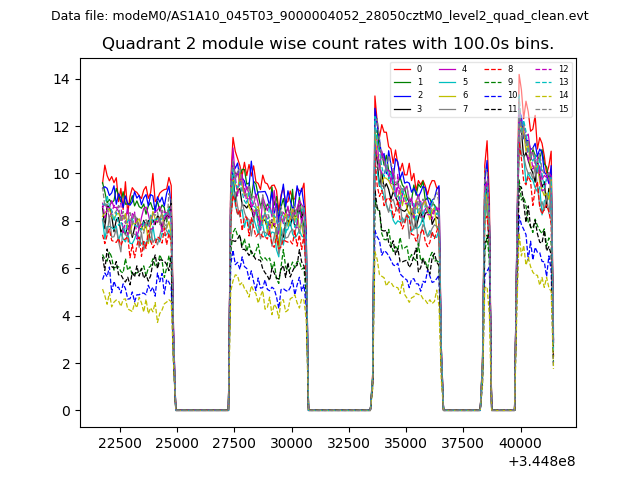
| Module-wise count rates for Quadrant B Data is divided into 100 sec bins |
 |
 |
| Module-wise count rates for Quadrant C Data is divided into 100 sec bins |
 |
 |
| Module-wise count rates for Quadrant D Data is divided into 100 sec bins |
 |
 |
| Parameter | Plot |
|---|---|
| CZT HV Monitor | 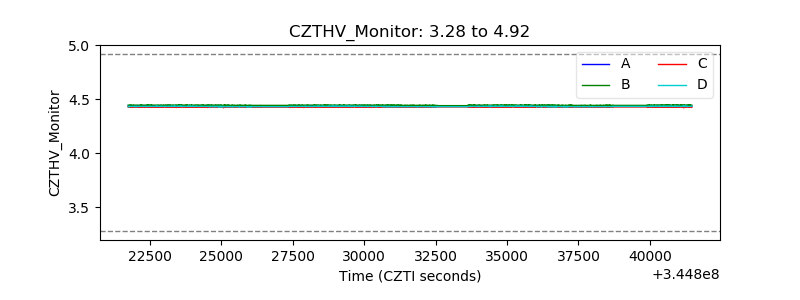 |
| D_VDD | 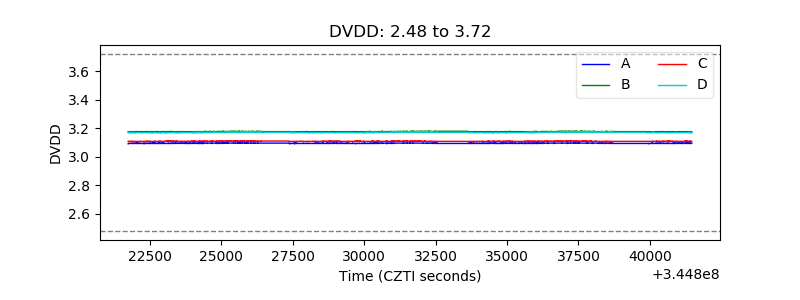 |
| Temperature 1 |  |
| Veto HV Monitor | 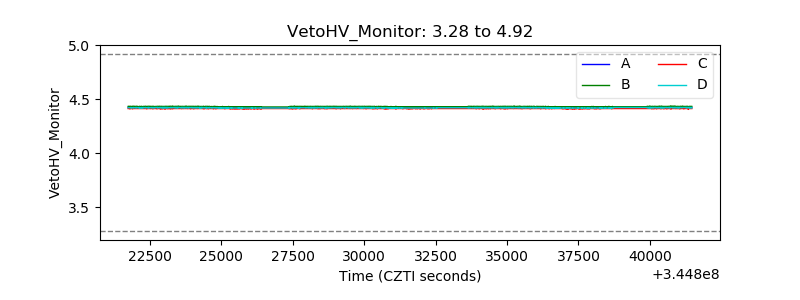 |
| Veto LLD | 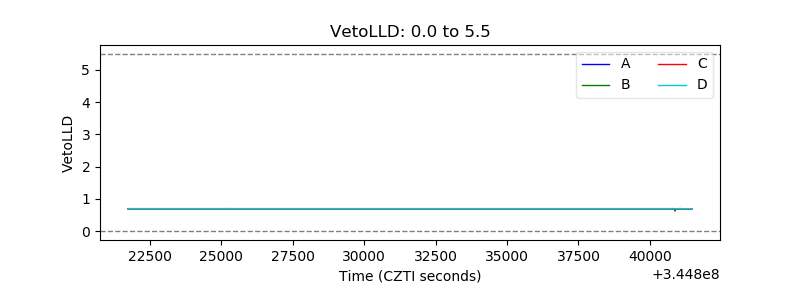 |
| Alpha Counter | 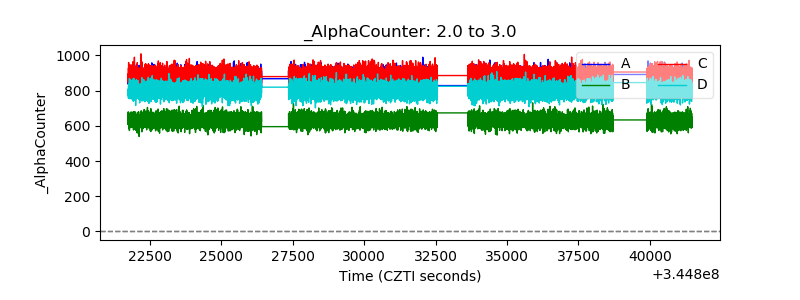 |
| _CPM_Rate | 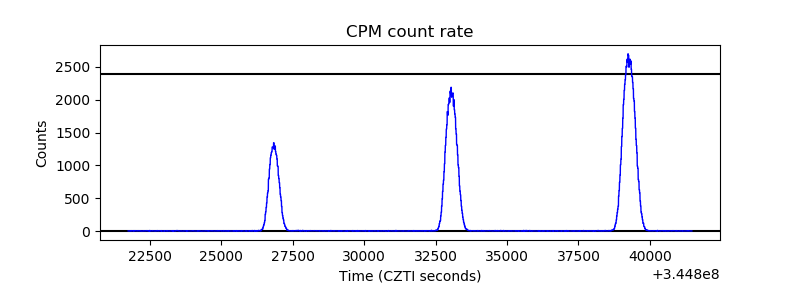 |
| CZT Counter | 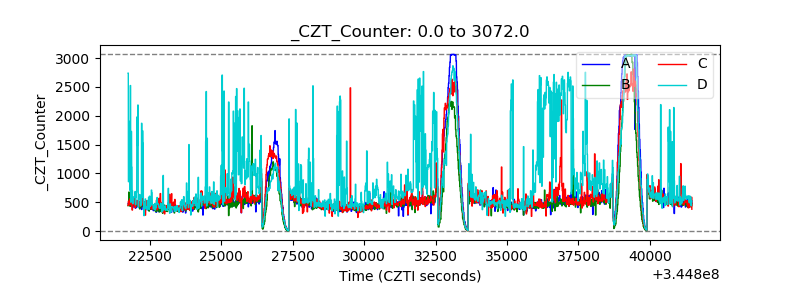 |
| +2.5 Volts monitor |  |
| +5 Volts monitor |  |
| _ROLL_ROT | 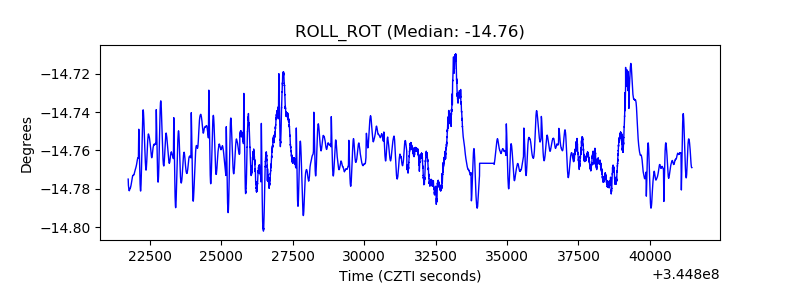 |
| _Roll_DEC | 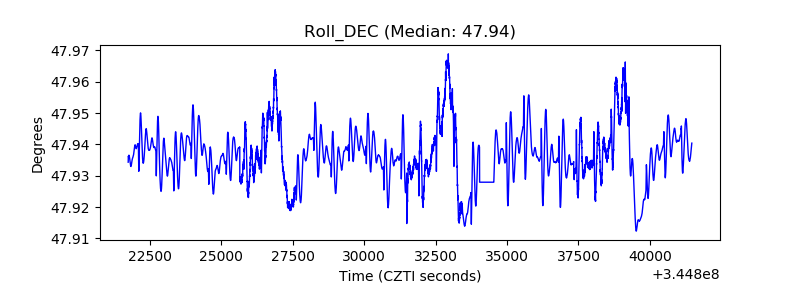 |
| _Roll_RA | 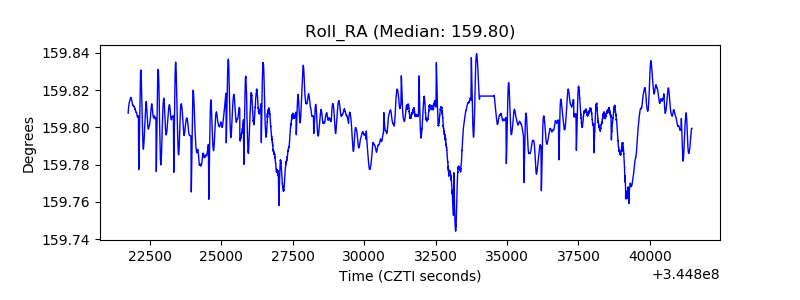 |
| Veto Counter | 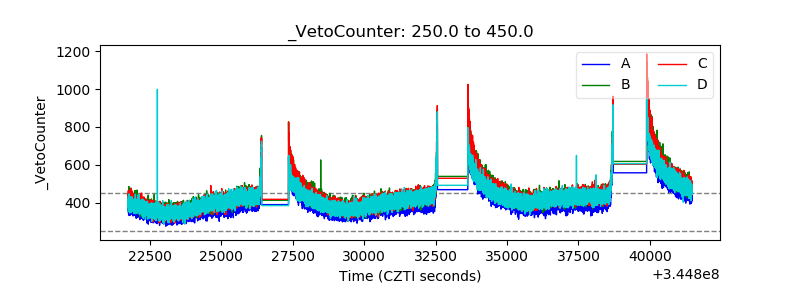 |