| Param | Original file | Final file |
|---|---|---|
| Filename | modeM0/AS1A10_045T03_9000004052_28051cztM0_level2.evt | modeM0/AS1A10_045T03_9000004052_28051cztM0_level2_quad_clean.evt |
| Size (bytes) | 466,499,520 | 94,057,920 |
| Size | 444.9 MB | 89.7 MB |
| Events in quadrant A | 3,188,622 | 630,675 |
| Events in quadrant B | 2,975,098 | 636,199 |
| Events in quadrant C | 3,180,867 | 595,064 |
| Events in quadrant D | 4,386,480 | 577,813 |
| Mode M0 | |||
|---|---|---|---|
| Quadrant | BADHDUFLAG | Total packets | Discarded packets |
| A | 0 | 12839 | 0 |
| B | 0 | 12254 | 0 |
| C | 0 | 12970 | 0 |
| D | 0 | 16978 | 0 |
| Mode M9 | |||
|---|---|---|---|
| Quadrant | BADHDUFLAG | Total packets | Discarded packets |
| A | 0 | 13 | 0 |
| B | 0 | 13 | 0 |
| C | 0 | 13 | 0 |
| D | 0 | 13 | 0 |
| Quadrant | Total seconds | Saturated seconds | Saturation percentage |
|---|---|---|---|
| A | 5853 | 30 | 0.512558% |
| B | 5853 | 36 | 0.615069% |
| C | 5854 | 64 | 1.093270% |
| D | 5854 | 137 | 2.340280% |
Noise dominated data is calculated using 1-second bins in cleaned event files. If a bin has >2000 counts, and if more than 50% of those come from <1% of pixels, then it is considered to be noise-dominated and hence unusable.
| Quadrant | # 1 sec bins | Bins with >0 counts | Bins with >2000 counts | High rate bins dominated by noise | Noise dominated (total time) | Noise dominated (detector-on time) | Marked lightcurve |
|---|---|---|---|---|---|---|---|
| A | 7133 | 5853 | 0 | 0 | 0.00% | 0.00% | 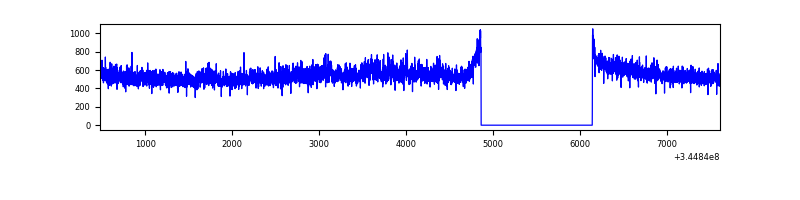 |
| B | 7133 | 5853 | 2 | 2 | 0.03% | 0.03% | 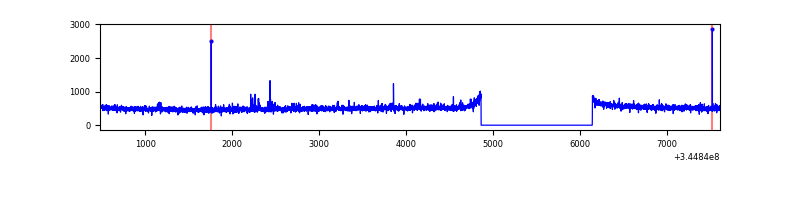 |
| C | 7134 | 5855 | 2 | 2 | 0.03% | 0.03% | 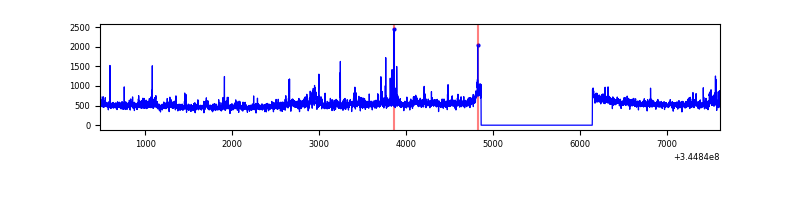 |
| D | 7134 | 5855 | 132 | 132 | 1.85% | 2.25% | 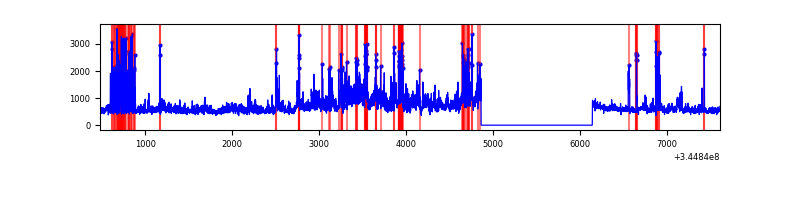 |
Top three noisy pixels from each quadrant. If the there are fewer than three noisy pixels in the level2.evt file, extra rows are filled as -1
| Pixel properties | Quadrant properties | ||||||
|---|---|---|---|---|---|---|---|
| Quadrant | DetID | PixID | Counts | Sigma | Mean | Median | Sigma |
| A | 0 | 13 | 230284 | 1502.44 | 766 | 754 | 152.8 |
| A | 13 | 254 | 9392 | 56.54 | 766 | 754 | 152.8 |
| A | 3 | 137 | 6722 | 39.06 | 766 | 754 | 152.8 |
| B | 12 | 111 | 16535 | 114.15 | 748 | 732 | 138.4 |
| B | 11 | 111 | 14819 | 101.76 | 748 | 732 | 138.4 |
| B | 14 | 111 | 14152 | 96.94 | 748 | 732 | 138.4 |
| C | 3 | 233 | 202707 | 1223.28 | 716 | 721 | 165.1 |
| C | 14 | 238 | 121314 | 730.34 | 716 | 721 | 165.1 |
| C | 15 | 208 | 66776 | 400.05 | 716 | 721 | 165.1 |
| D | 8 | 195 | 1030218 | 6102.92 | 722 | 704 | 168.7 |
| D | 2 | 250 | 367065 | 2171.77 | 722 | 704 | 168.7 |
| D | 1 | 52 | 162766 | 960.7 | 722 | 704 | 168.7 |
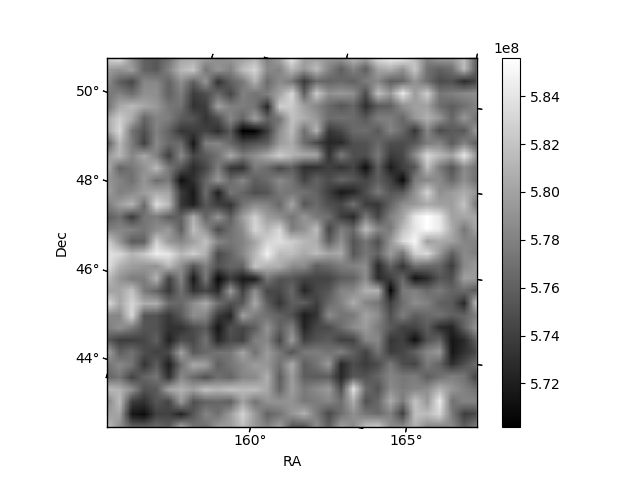
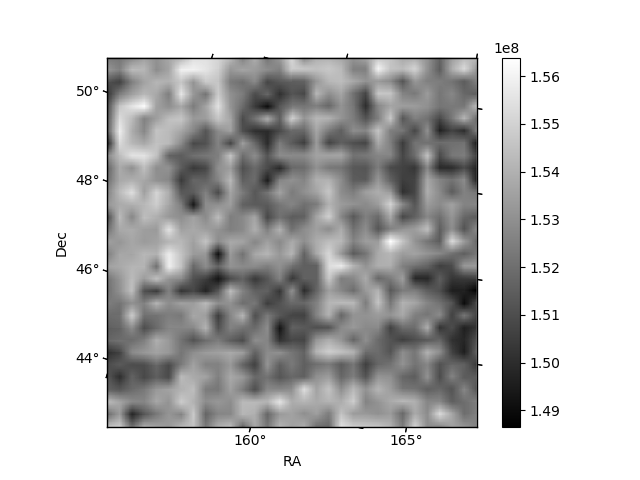
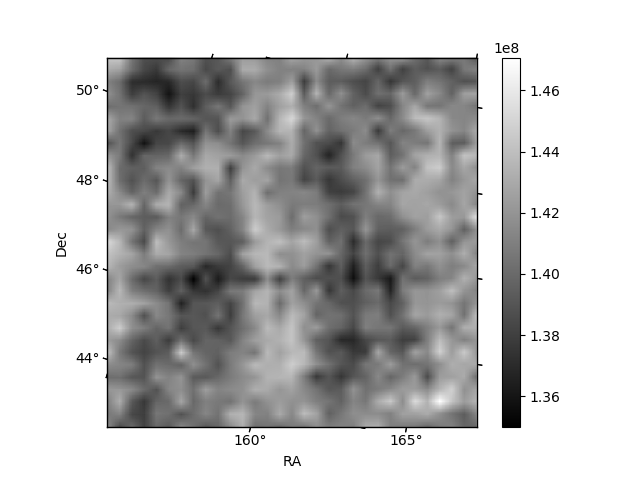
Histogram calculated using DETX and DETY for each event in the final _common_clean file
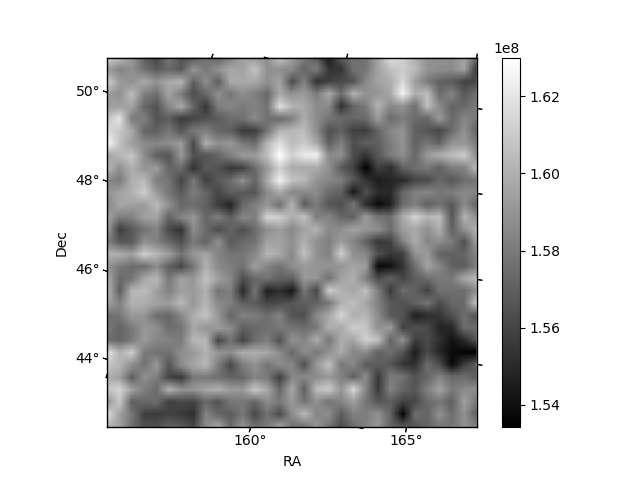
| Quadrant A | 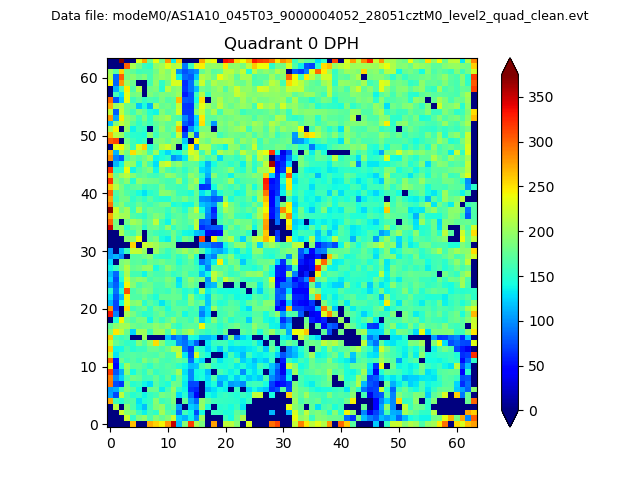 |
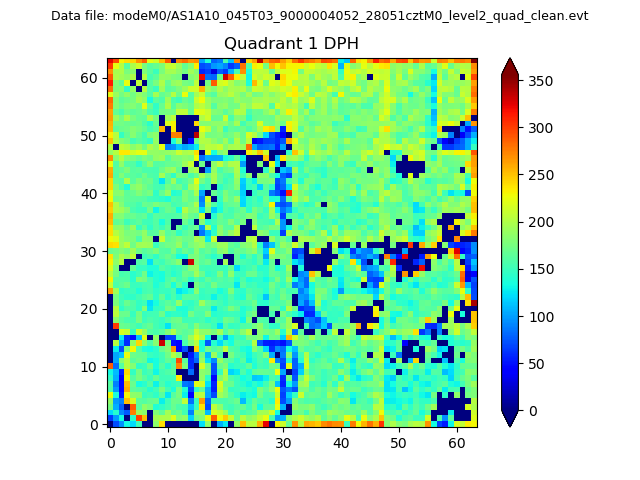 |
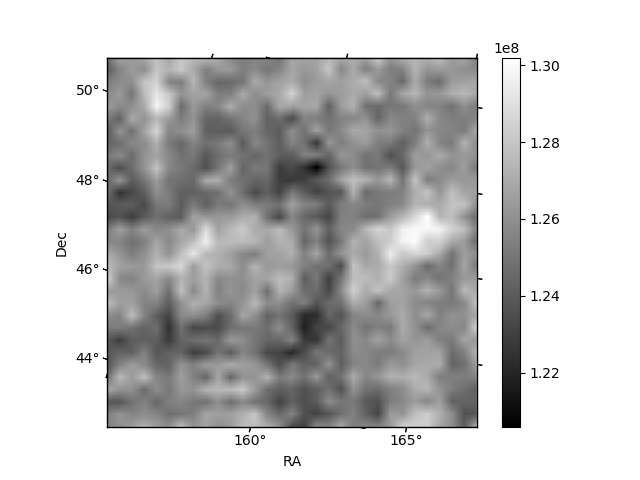
Quadrant B |
|---|---|---|---|
| Quadrant D |  |
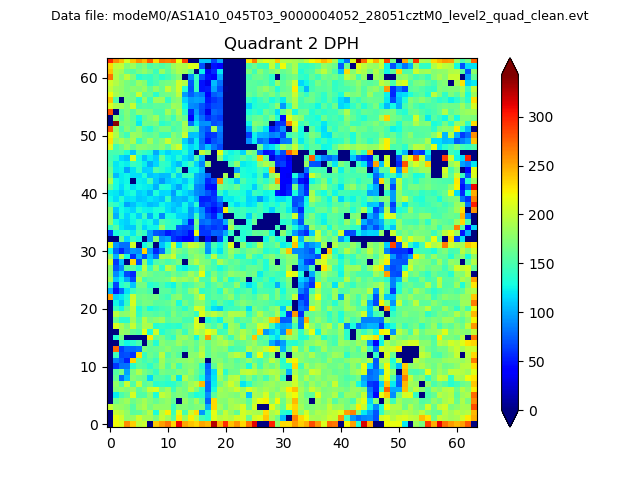 |
Quadrant C |
| Plot type | Count rate plots | Images |
|---|---|---|
| Comparison with Poisson distribution Blue bars denote a histogram of data divided into 1 sec bins. Red curve is a Poisson curve with rate = median count rate of data. |
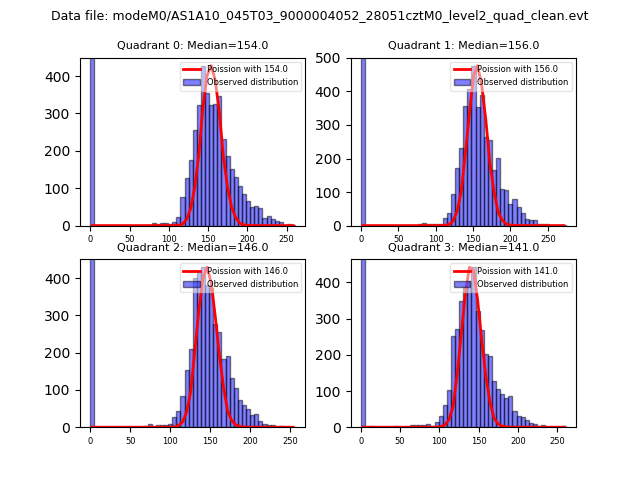 |
 |
| Quadrant-wise count rates Data is divided into 100 sec bins |
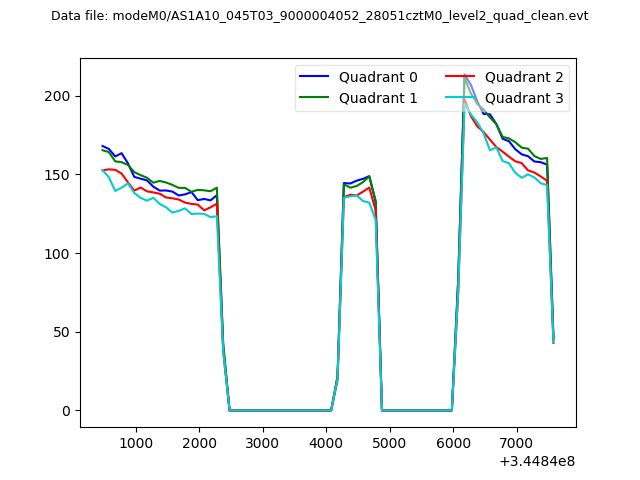 |
|
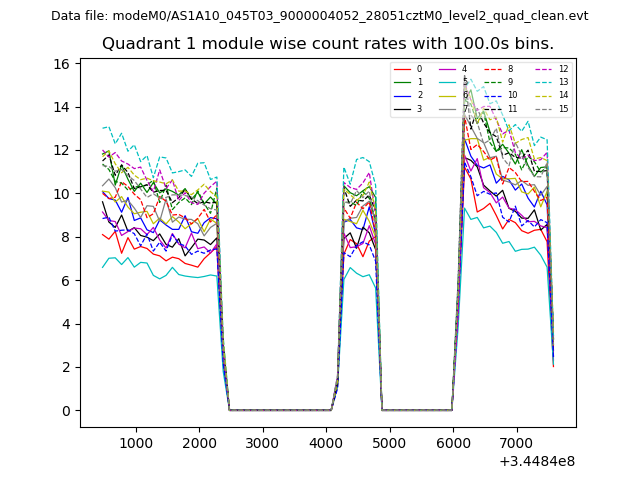
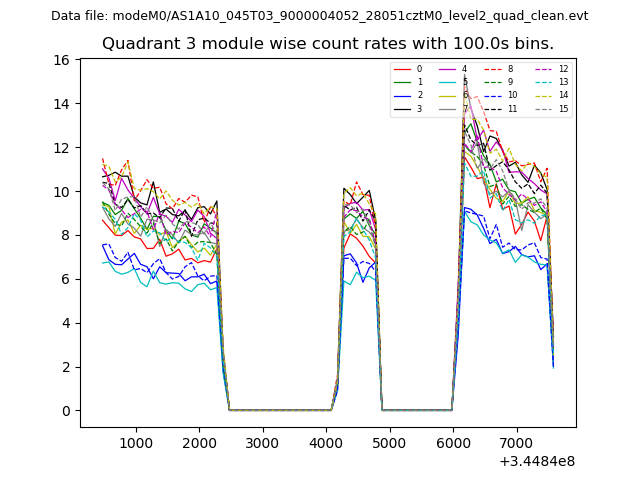
| Module-wise count rates for Quadrant A Data is divided into 100 sec bins |
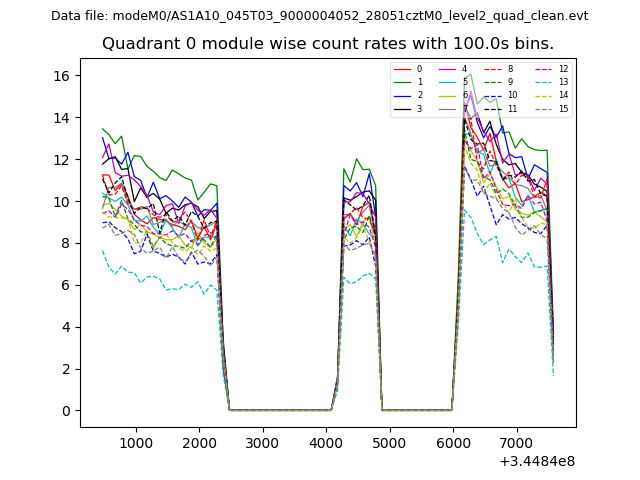 |
 |
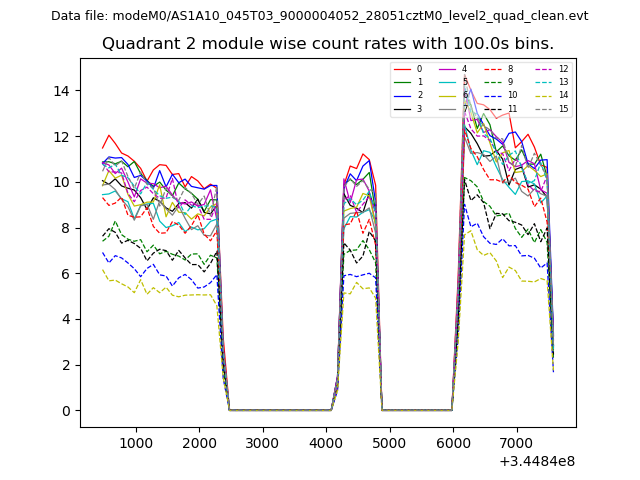
| Module-wise count rates for Quadrant B Data is divided into 100 sec bins |
 |
 |
| Module-wise count rates for Quadrant C Data is divided into 100 sec bins |
 |
 |
| Module-wise count rates for Quadrant D Data is divided into 100 sec bins |
 |
 |
| Parameter | Plot |
|---|---|
| CZT HV Monitor | 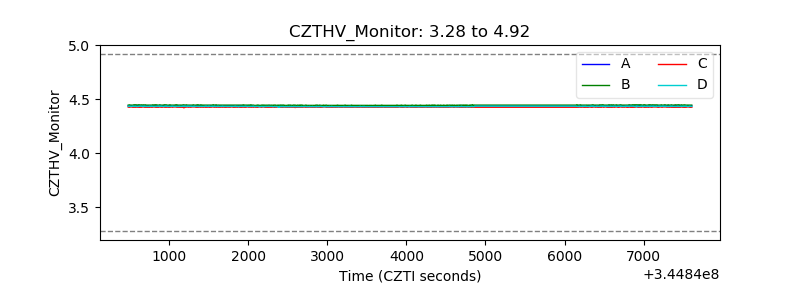 |
| D_VDD | 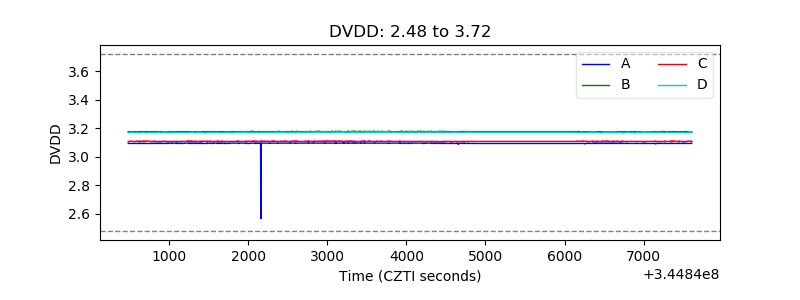 |
| Temperature 1 |  |
| Veto HV Monitor | 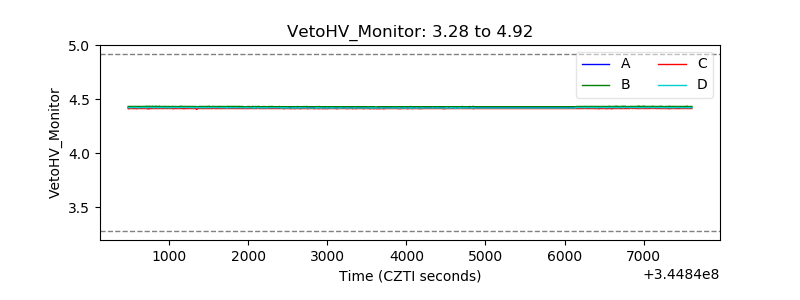 |
| Veto LLD | 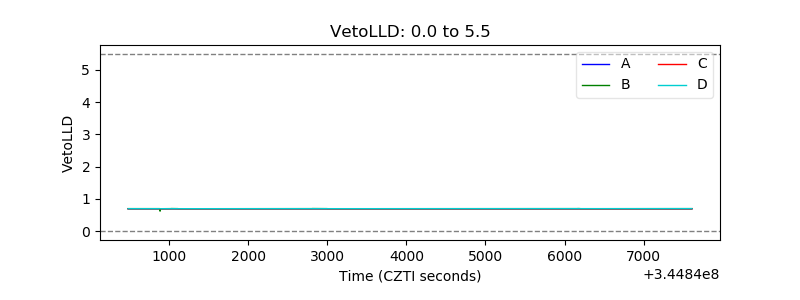 |
| Alpha Counter | 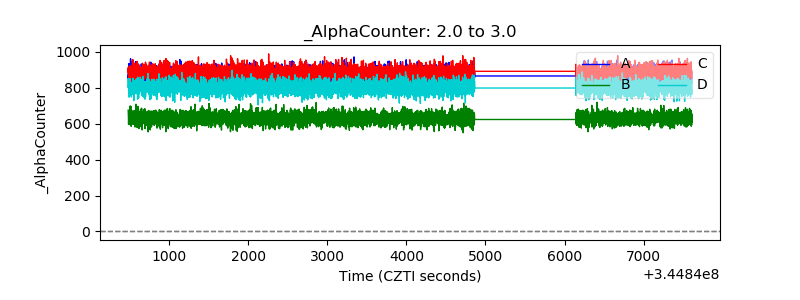 |
| _CPM_Rate | 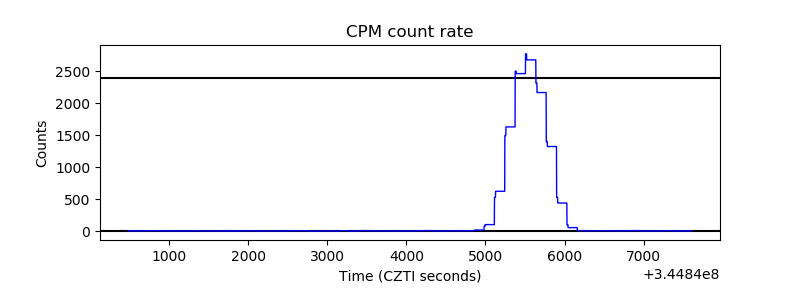 |
| CZT Counter | 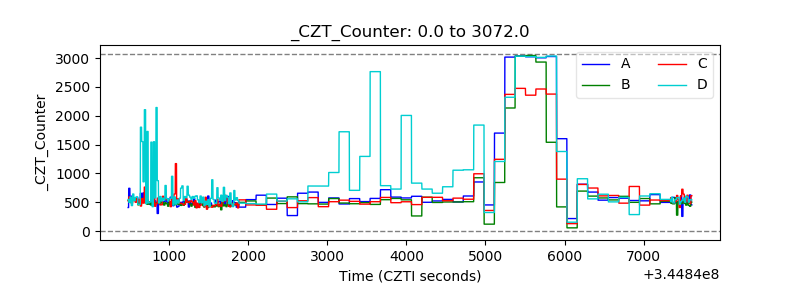 |
| +2.5 Volts monitor |  |
| +5 Volts monitor |  |
| _ROLL_ROT | 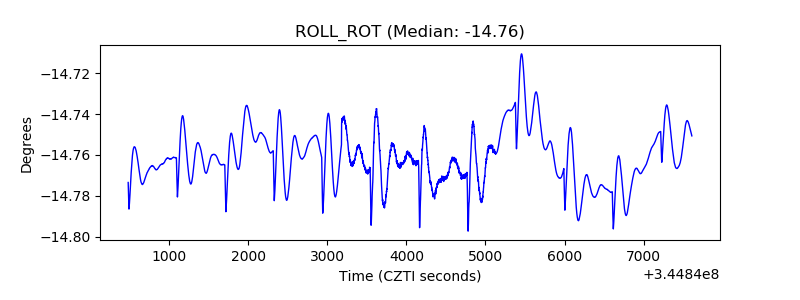 |
| _Roll_DEC | 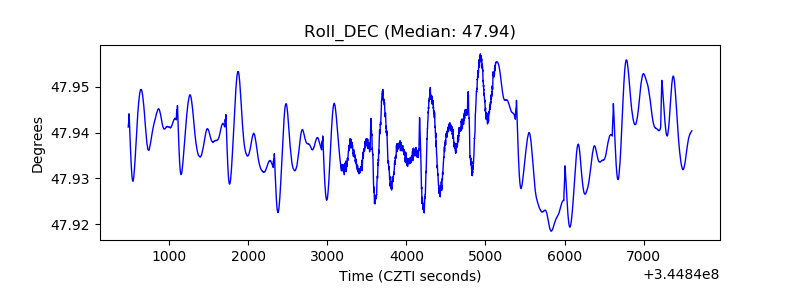 |
| _Roll_RA | 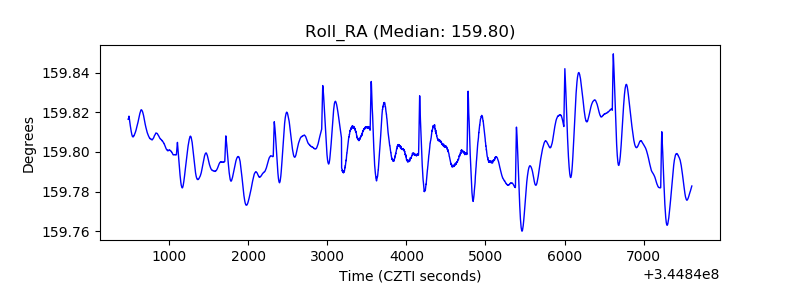 |
| Veto Counter | 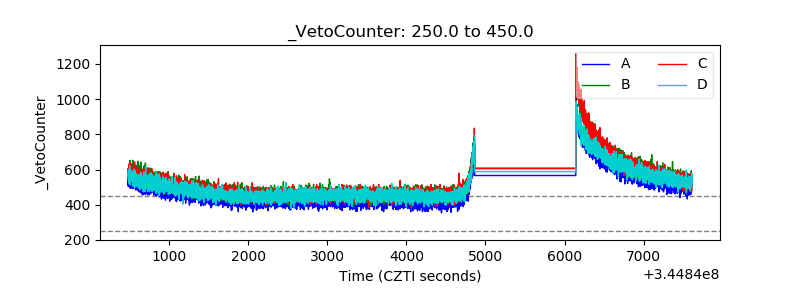 |