| Param | Original file | Final file |
|---|---|---|
| Filename | modeM0/AS1A10_045T03_9000004052_28052cztM0_level2.evt | modeM0/AS1A10_045T03_9000004052_28052cztM0_level2_quad_clean.evt |
| Size (bytes) | 457,678,080 | 89,962,560 |
| Size | 436.5 MB | 85.8 MB |
| Events in quadrant A | 2,997,676 | 603,691 |
| Events in quadrant B | 2,887,485 | 607,752 |
| Events in quadrant C | 3,182,474 | 569,237 |
| Events in quadrant D | 4,416,027 | 554,832 |
| Mode M0 | |||
|---|---|---|---|
| Quadrant | BADHDUFLAG | Total packets | Discarded packets |
| A | 0 | 12006 | 0 |
| B | 0 | 11671 | 0 |
| C | 0 | 12748 | 0 |
| D | 0 | 17016 | 0 |
| Mode M9 | |||
|---|---|---|---|
| Quadrant | BADHDUFLAG | Total packets | Discarded packets |
| A | 0 | 14 | 0 |
| B | 0 | 14 | 0 |
| C | 0 | 14 | 0 |
| D | 0 | 14 | 0 |
| Quadrant | Total seconds | Saturated seconds | Saturation percentage |
|---|---|---|---|
| A | 5563 | 42 | 0.754988% |
| B | 5564 | 45 | 0.808771% |
| C | 5564 | 67 | 1.204170% |
| D | 5564 | 185 | 3.324946% |
Noise dominated data is calculated using 1-second bins in cleaned event files. If a bin has >2000 counts, and if more than 50% of those come from <1% of pixels, then it is considered to be noise-dominated and hence unusable.
| Quadrant | # 1 sec bins | Bins with >0 counts | Bins with >2000 counts | High rate bins dominated by noise | Noise dominated (total time) | Noise dominated (detector-on time) | Marked lightcurve |
|---|---|---|---|---|---|---|---|
| A | 6928 | 5564 | 0 | 0 | 0.00% | 0.00% | 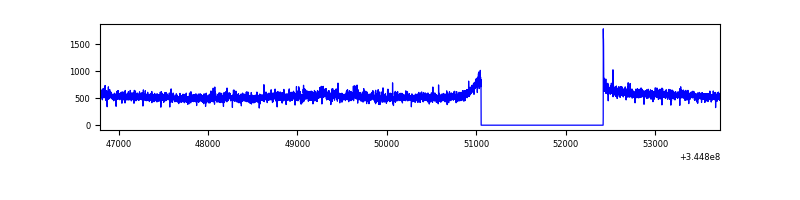 |
| B | 6929 | 5564 | 2 | 2 | 0.03% | 0.04% | 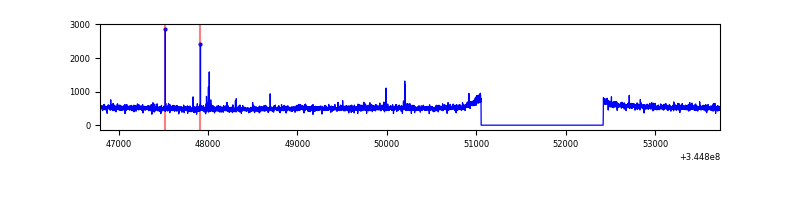 |
| C | 6929 | 5564 | 7 | 7 | 0.10% | 0.13% | 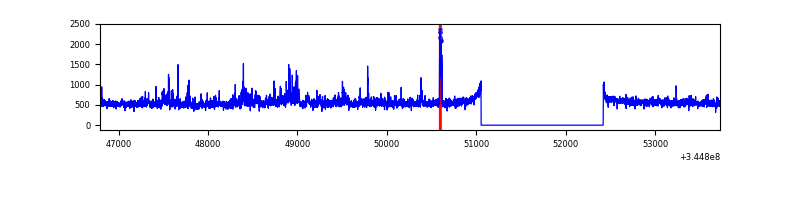 |
| D | 6929 | 5565 | 150 | 150 | 2.16% | 2.70% | 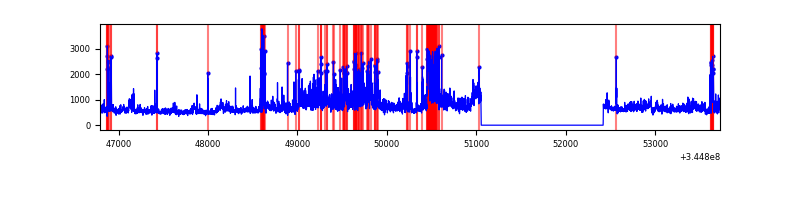 |
Top three noisy pixels from each quadrant. If the there are fewer than three noisy pixels in the level2.evt file, extra rows are filled as -1
| Pixel properties | Quadrant properties | ||||||
|---|---|---|---|---|---|---|---|
| Quadrant | DetID | PixID | Counts | Sigma | Mean | Median | Sigma |
| A | 0 | 13 | 103595 | 697.85 | 749 | 736 | 147.4 |
| A | 13 | 254 | 9041 | 56.35 | 749 | 736 | 147.4 |
| A | 0 | 226 | 6615 | 39.89 | 749 | 736 | 147.4 |
| B | 12 | 111 | 15820 | 111.26 | 728 | 710 | 135.8 |
| B | 11 | 111 | 14627 | 102.48 | 728 | 710 | 135.8 |
| B | 14 | 111 | 13552 | 94.56 | 728 | 710 | 135.8 |
| C | 3 | 233 | 330146 | 2043.11 | 700 | 705 | 161.2 |
| C | 14 | 238 | 117461 | 724.09 | 700 | 705 | 161.2 |
| C | 13 | 61 | 4888 | 25.94 | 700 | 705 | 161.2 |
| D | 8 | 195 | 810647 | 4888.14 | 710 | 692 | 165.7 |
| D | 2 | 250 | 484103 | 2917.42 | 710 | 692 | 165.7 |
| D | 1 | 52 | 378693 | 2281.26 | 710 | 692 | 165.7 |
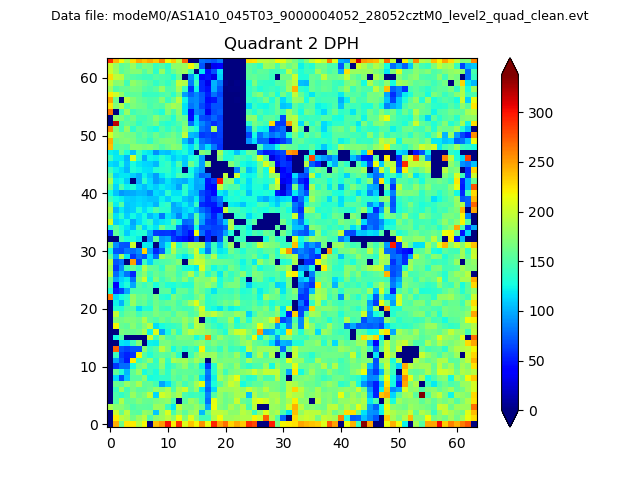
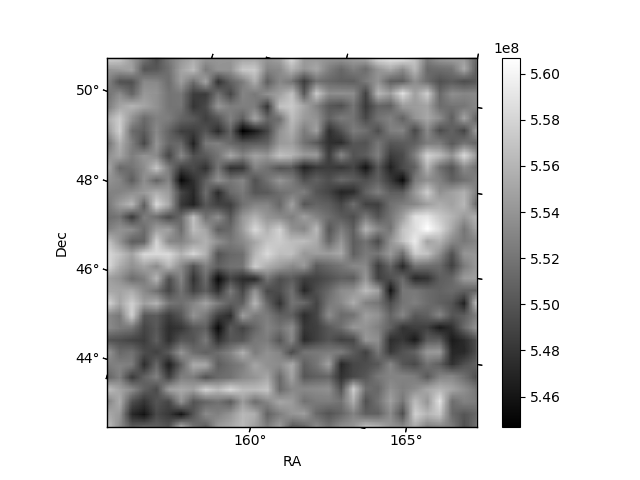
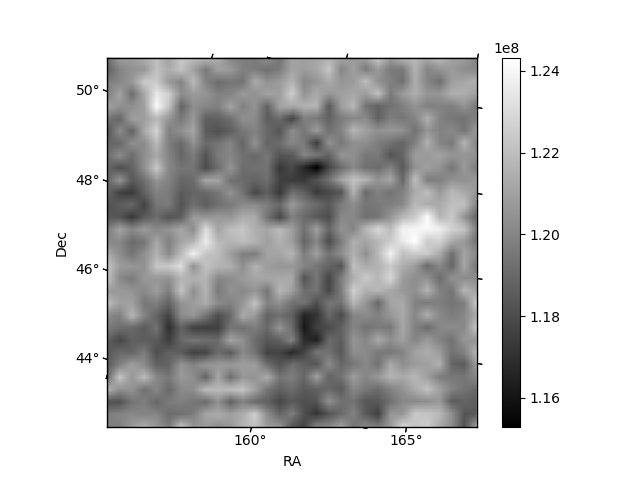
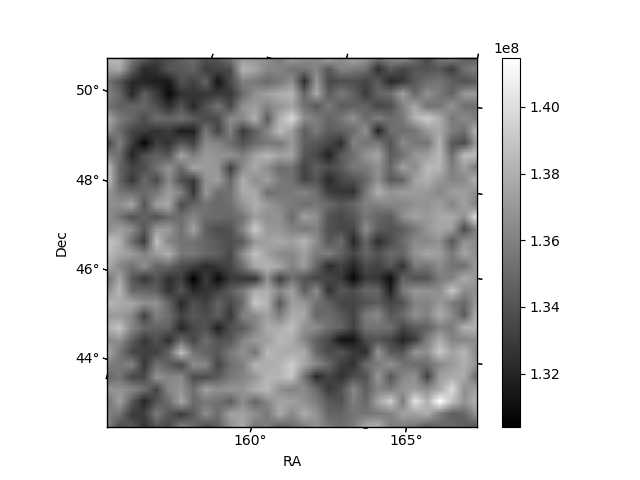
Histogram calculated using DETX and DETY for each event in the final _common_clean file
| Quadrant A | 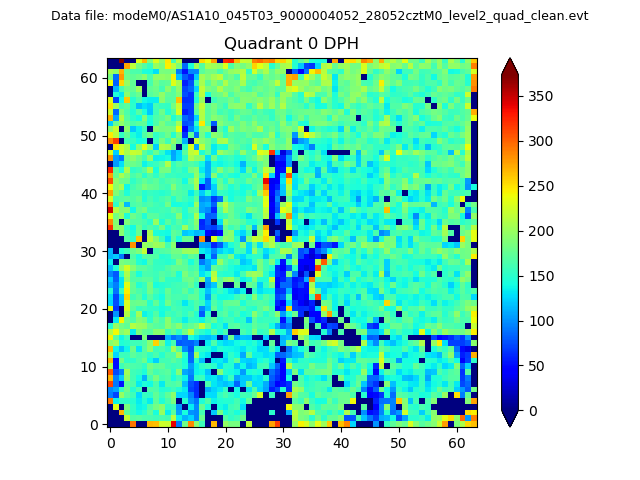 |
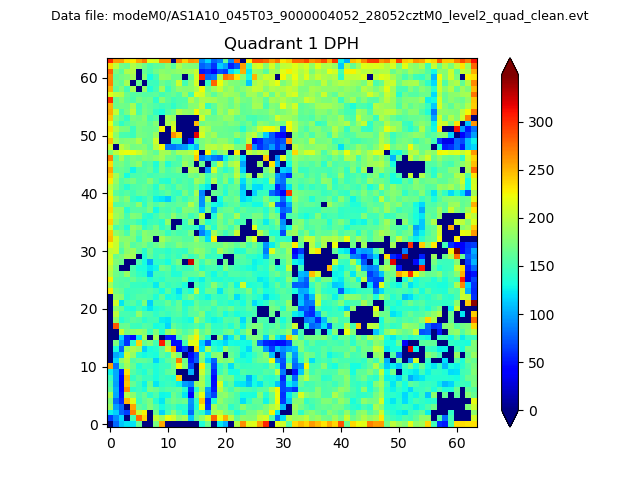 |
Quadrant B |
|---|---|---|---|
| Quadrant D | 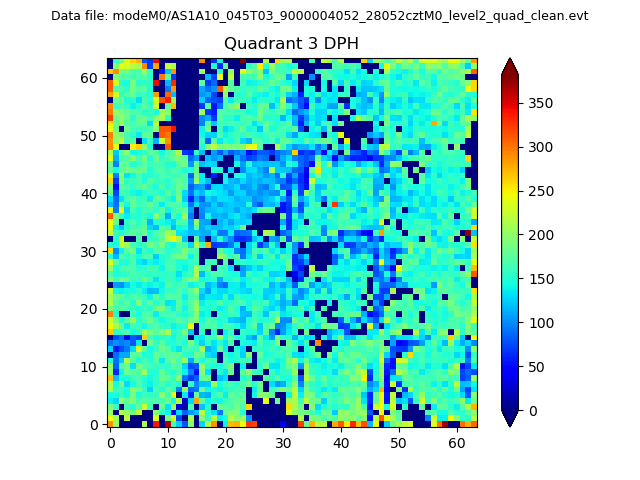 |
 |
Quadrant C |
| Plot type | Count rate plots | Images |
|---|---|---|
| Comparison with Poisson distribution Blue bars denote a histogram of data divided into 1 sec bins. Red curve is a Poisson curve with rate = median count rate of data. |
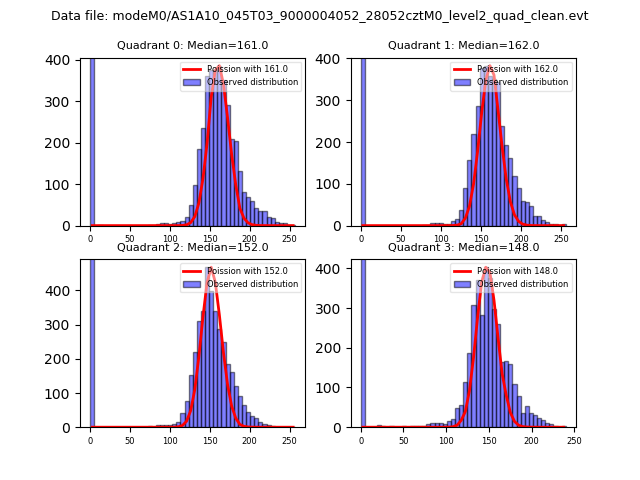 |
 |
| Quadrant-wise count rates Data is divided into 100 sec bins |
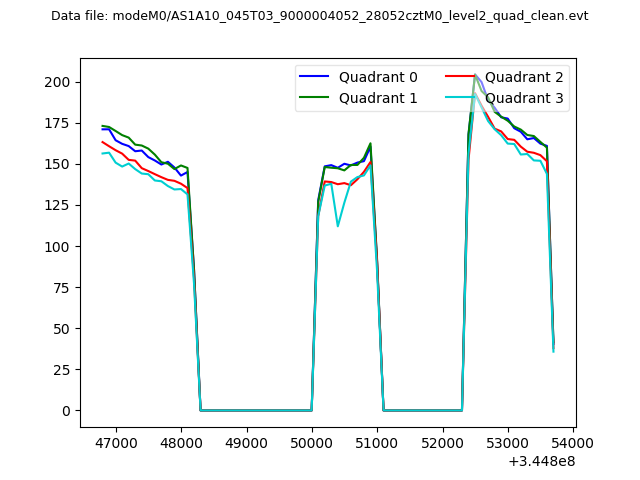 |
|
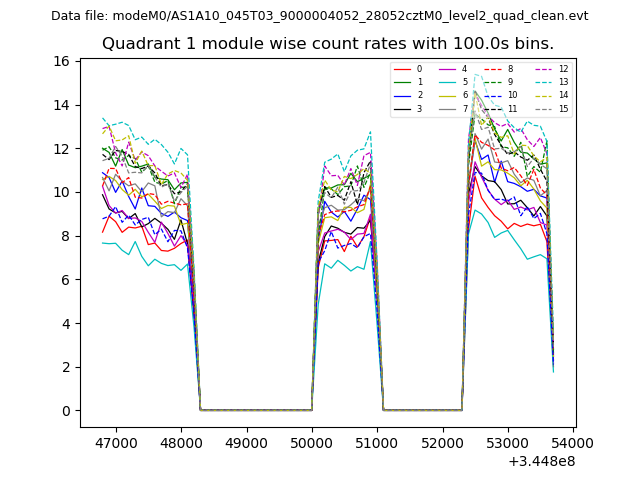
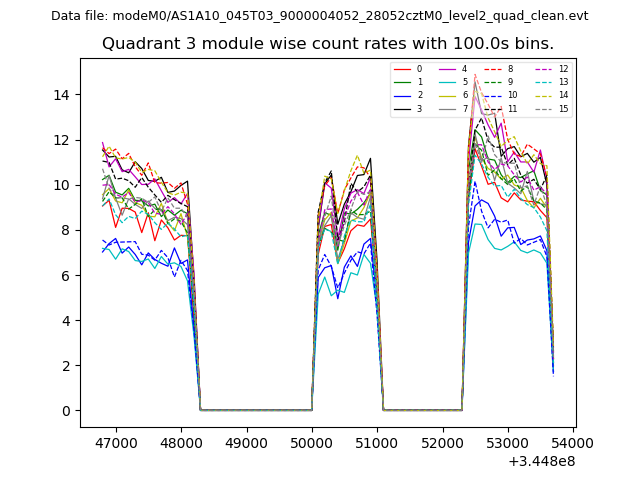
| Module-wise count rates for Quadrant A Data is divided into 100 sec bins |
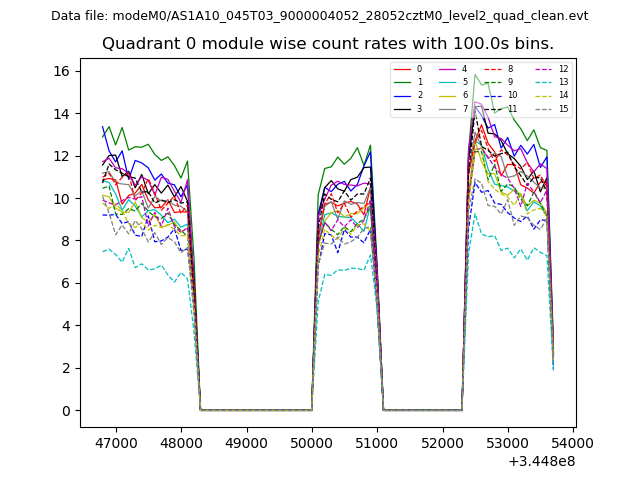 |
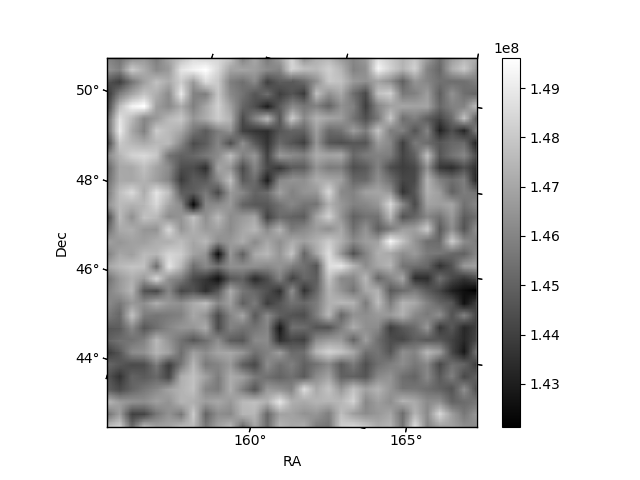 |
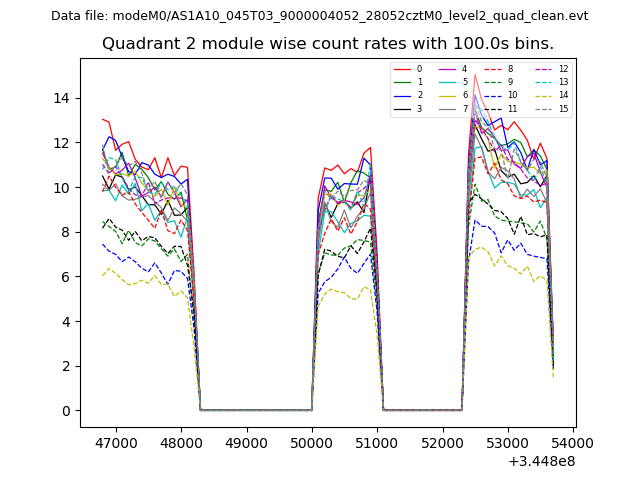
| Module-wise count rates for Quadrant B Data is divided into 100 sec bins |
 |
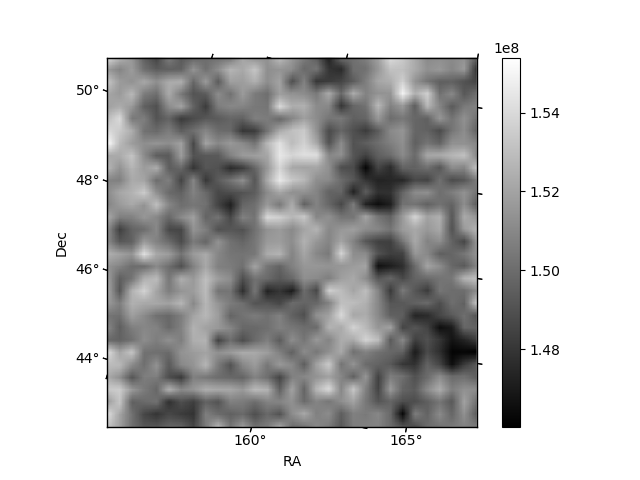 |
| Module-wise count rates for Quadrant C Data is divided into 100 sec bins |
 |
 |
| Module-wise count rates for Quadrant D Data is divided into 100 sec bins |
 |
 |
| Parameter | Plot |
|---|---|
| CZT HV Monitor | 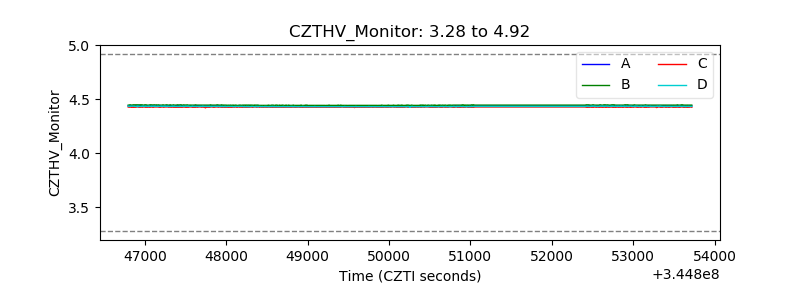 |
| D_VDD | 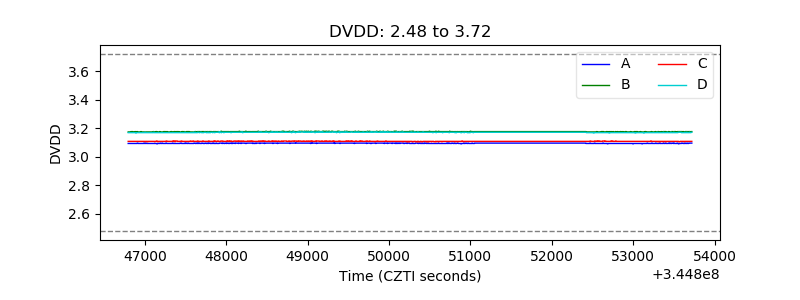 |
| Temperature 1 |  |
| Veto HV Monitor | 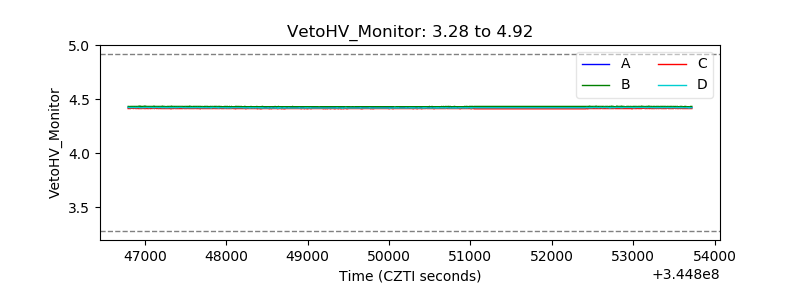 |
| Veto LLD | 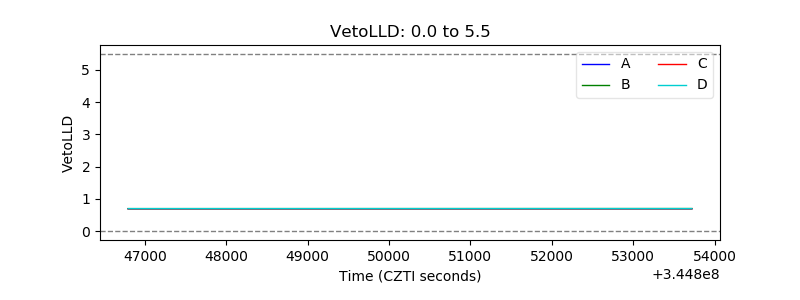 |
| Alpha Counter | 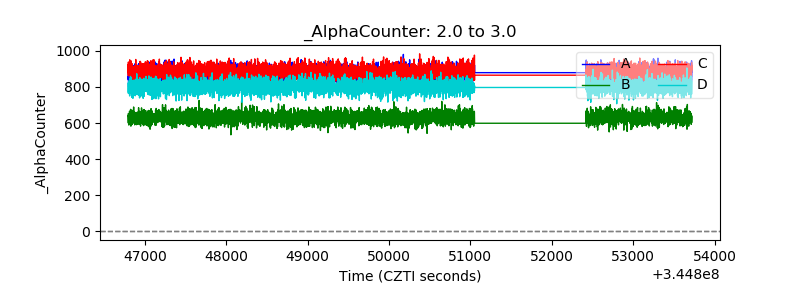 |
| _CPM_Rate | 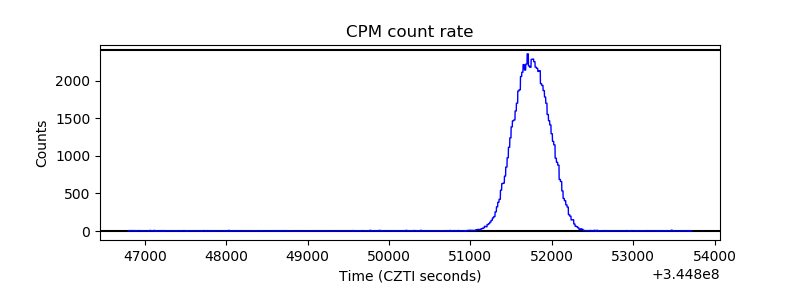 |
| CZT Counter | 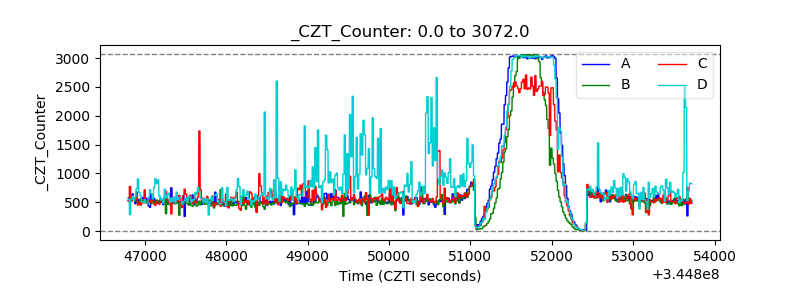 |
| +2.5 Volts monitor |  |
| +5 Volts monitor |  |
| _ROLL_ROT | 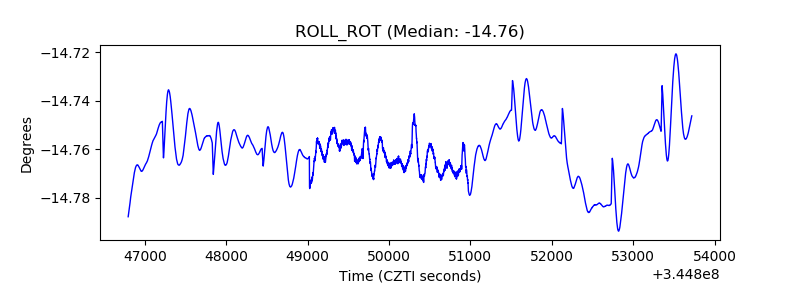 |
| _Roll_DEC | 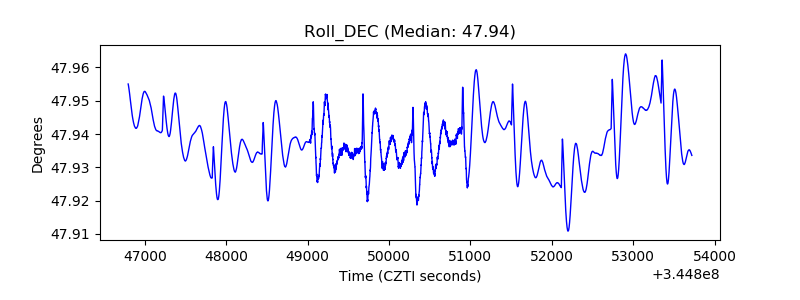 |
| _Roll_RA | 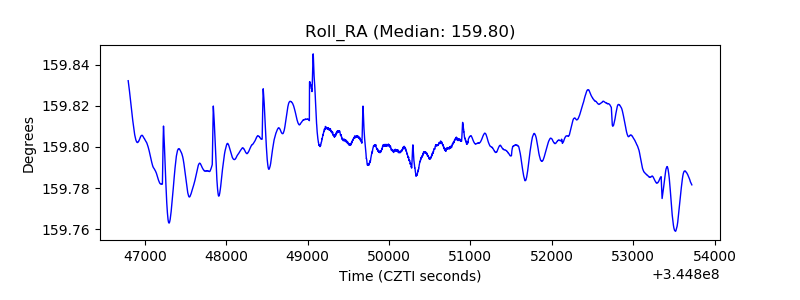 |
| Veto Counter | 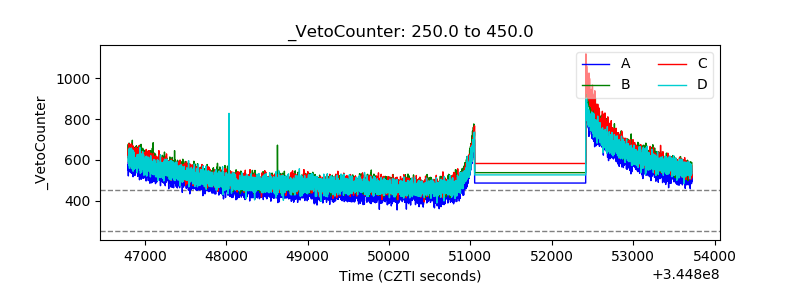 |