| Param | Original file | Final file |
|---|---|---|
| Filename | modeM0/AS1A10_045T03_9000004052_28053cztM0_level2.evt | modeM0/AS1A10_045T03_9000004052_28053cztM0_level2_quad_clean.evt |
| Size (bytes) | 356,886,720 | 56,041,920 |
| Size | 340.4 MB | 53.4 MB |
| Events in quadrant A | 2,123,669 | 363,965 |
| Events in quadrant B | 2,105,796 | 362,594 |
| Events in quadrant C | 2,432,167 | 341,639 |
| Events in quadrant D | 3,865,764 | 337,459 |
| Mode M0 | |||
|---|---|---|---|
| Quadrant | BADHDUFLAG | Total packets | Discarded packets |
| A | 0 | 8507 | 0 |
| B | 0 | 8525 | 0 |
| C | 0 | 9740 | 0 |
| D | 0 | 14414 | 0 |
| Quadrant | Total seconds | Saturated seconds | Saturation percentage |
|---|---|---|---|
| A | 4132 | 1 | 0.024201% |
| B | 4133 | 8 | 0.193564% |
| C | 4133 | 32 | 0.774256% |
| D | 4133 | 172 | 4.161626% |
Noise dominated data is calculated using 1-second bins in cleaned event files. If a bin has >2000 counts, and if more than 50% of those come from <1% of pixels, then it is considered to be noise-dominated and hence unusable.
| Quadrant | # 1 sec bins | Bins with >0 counts | Bins with >2000 counts | High rate bins dominated by noise | Noise dominated (total time) | Noise dominated (detector-on time) | Marked lightcurve |
|---|---|---|---|---|---|---|---|
| A | 4132 | 4132 | 0 | 0 | 0.00% | 0.00% | 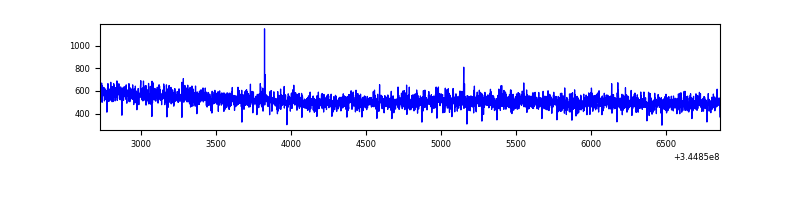 |
| B | 4133 | 4133 | 5 | 5 | 0.12% | 0.12% | 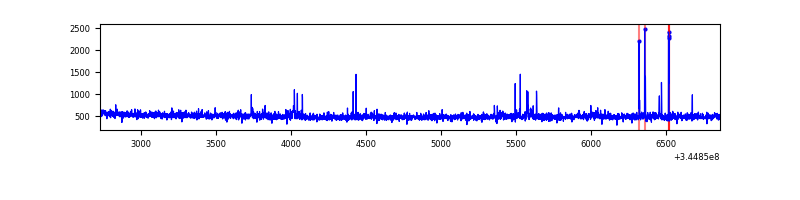 |
| C | 4133 | 4133 | 4 | 4 | 0.10% | 0.10% | 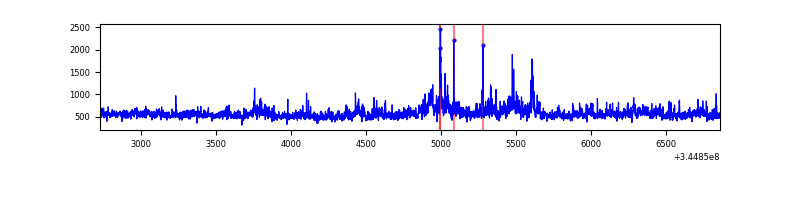 |
| D | 4133 | 4133 | 177 | 177 | 4.28% | 4.28% | 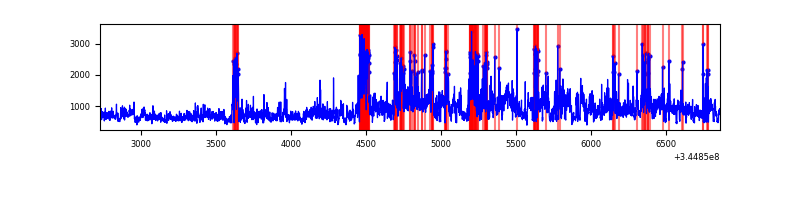 |
Top three noisy pixels from each quadrant. If the there are fewer than three noisy pixels in the level2.evt file, extra rows are filled as -1
| Pixel properties | Quadrant properties | ||||||
|---|---|---|---|---|---|---|---|
| Quadrant | DetID | PixID | Counts | Sigma | Mean | Median | Sigma |
| A | 0 | 13 | 37044 | 337.06 | 540 | 533 | 108.3 |
| A | 13 | 254 | 7552 | 64.8 | 540 | 533 | 108.3 |
| A | 0 | 226 | 4841 | 39.77 | 540 | 533 | 108.3 |
| B | 15 | 222 | 22338 | 221.31 | 524 | 511 | 98.6 |
| B | 4 | 200 | 13973 | 136.49 | 524 | 511 | 98.6 |
| B | 4 | 52 | 11885 | 115.32 | 524 | 511 | 98.6 |
| C | 3 | 233 | 365062 | 3105.42 | 507 | 511 | 117.4 |
| C | 14 | 238 | 83186 | 704.27 | 507 | 511 | 117.4 |
| C | 15 | 208 | 7598 | 60.37 | 507 | 511 | 117.4 |
| D | 8 | 195 | 1163486 | 9578.8 | 514 | 502 | 121.4 |
| D | 1 | 52 | 339736 | 2794.06 | 514 | 502 | 121.4 |
| D | 12 | 233 | 200631 | 1648.34 | 514 | 502 | 121.4 |
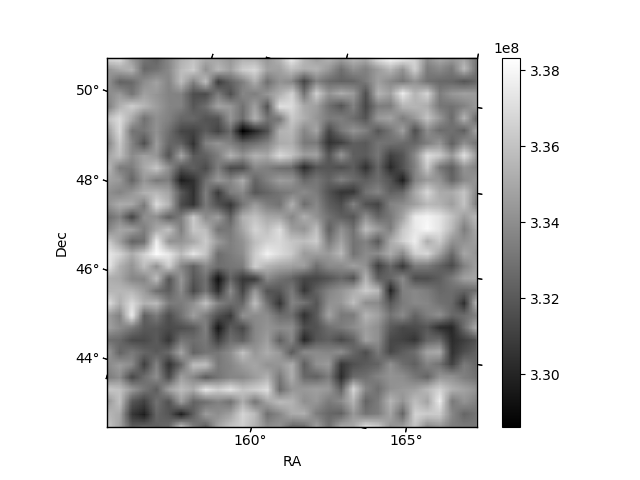
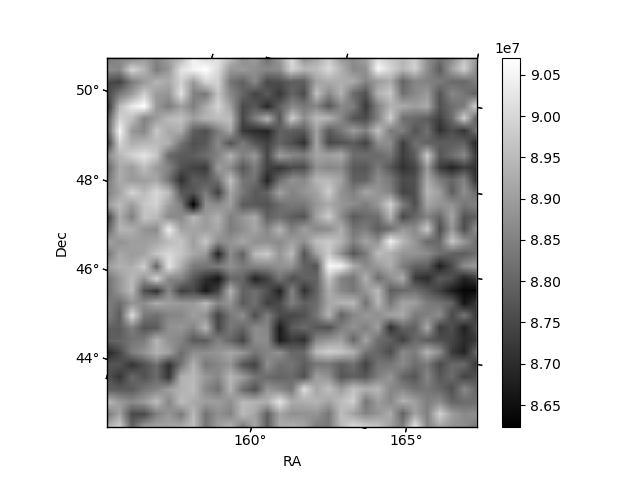
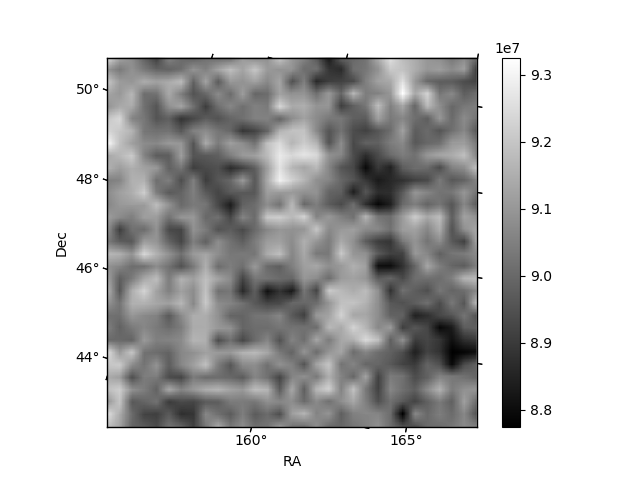
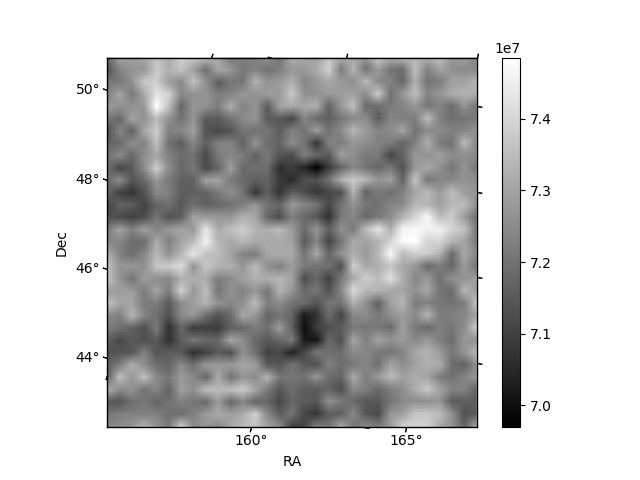
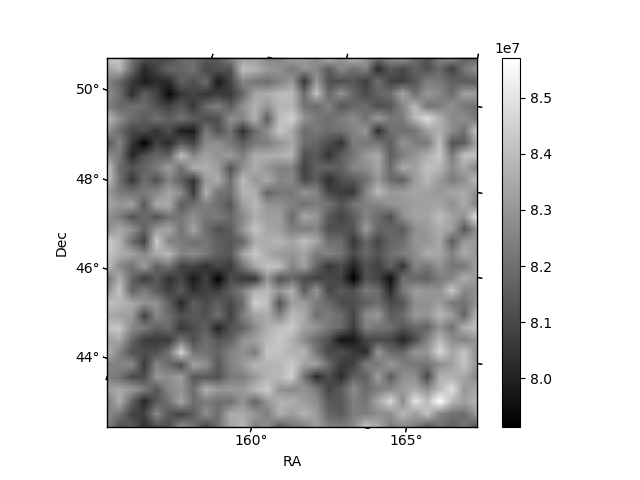
Histogram calculated using DETX and DETY for each event in the final _common_clean file
| Quadrant A | 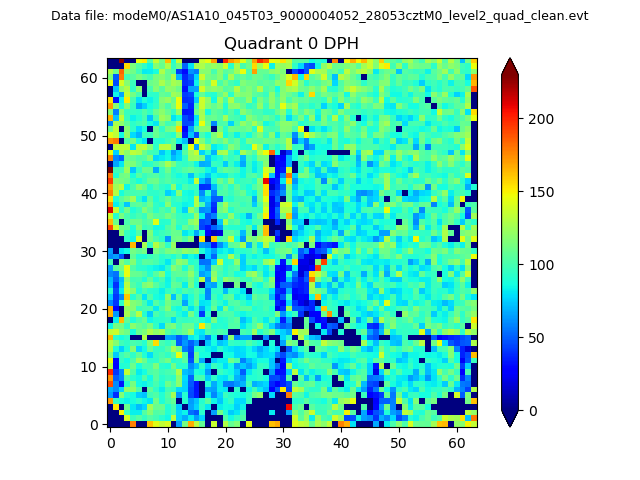 |
 |
Quadrant B |
|---|---|---|---|
| Quadrant D | 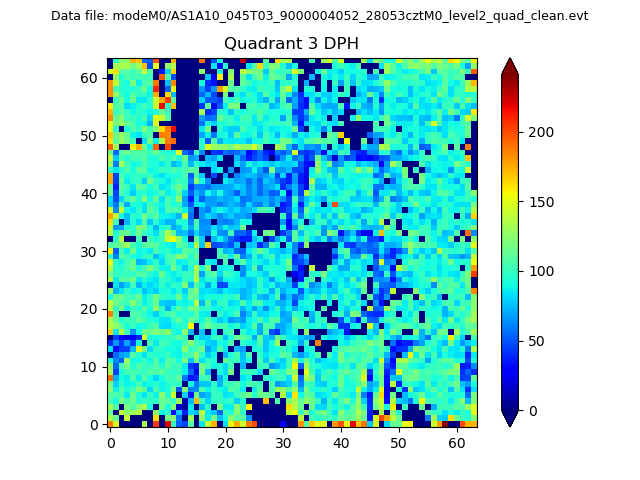 |
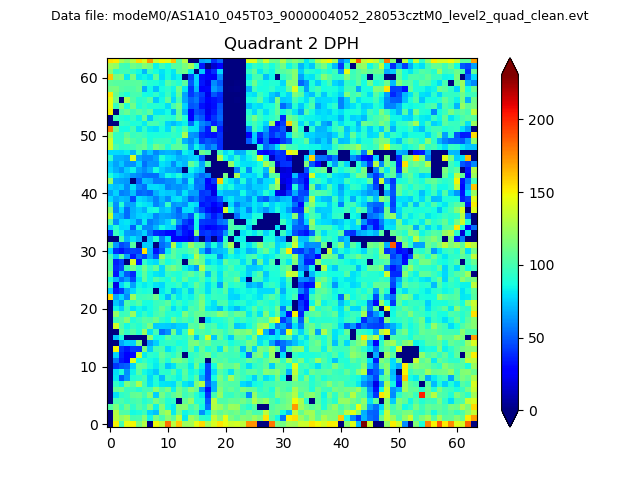 |
Quadrant C |
| Plot type | Count rate plots | Images |
|---|---|---|
| Comparison with Poisson distribution Blue bars denote a histogram of data divided into 1 sec bins. Red curve is a Poisson curve with rate = median count rate of data. |
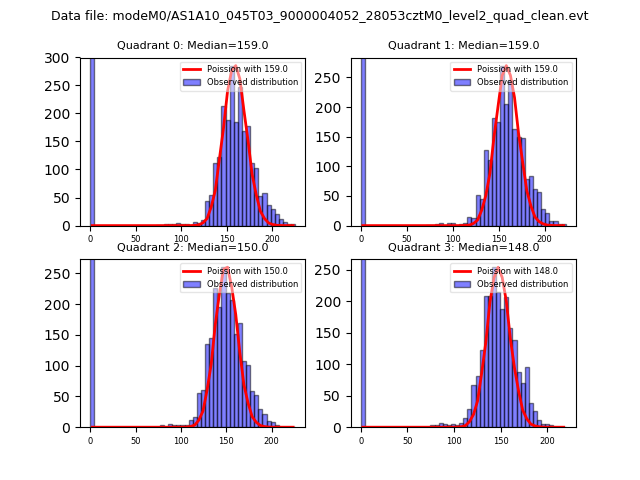 |
 |
| Quadrant-wise count rates Data is divided into 100 sec bins |
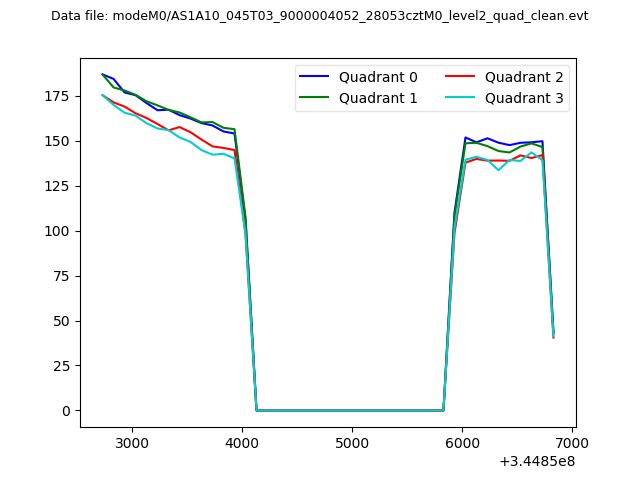 |
|
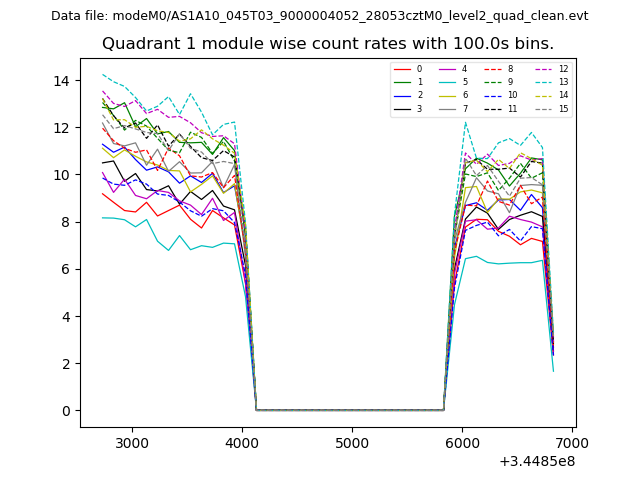
| Module-wise count rates for Quadrant A Data is divided into 100 sec bins |
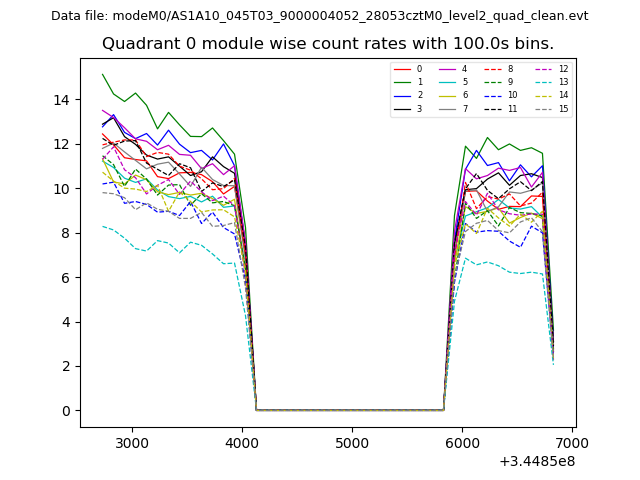 |
 |
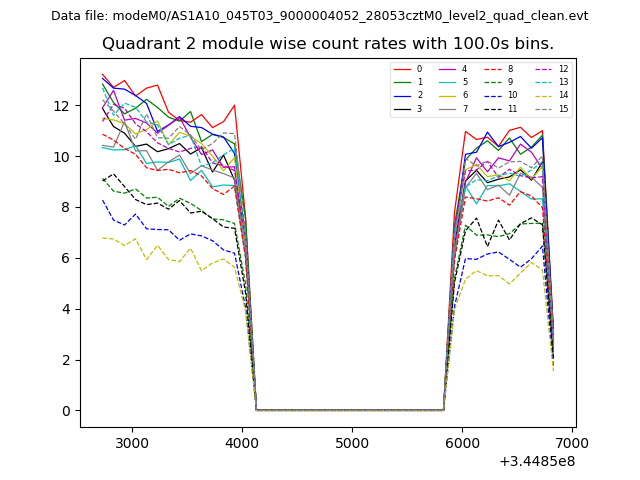
| Module-wise count rates for Quadrant B Data is divided into 100 sec bins |
 |
 |
| Module-wise count rates for Quadrant C Data is divided into 100 sec bins |
 |
 |
| Module-wise count rates for Quadrant D Data is divided into 100 sec bins |
 |
 |
| Parameter | Plot |
|---|---|
| CZT HV Monitor | 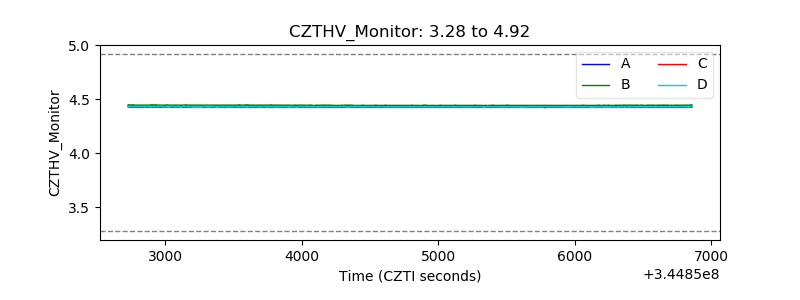 |
| D_VDD | 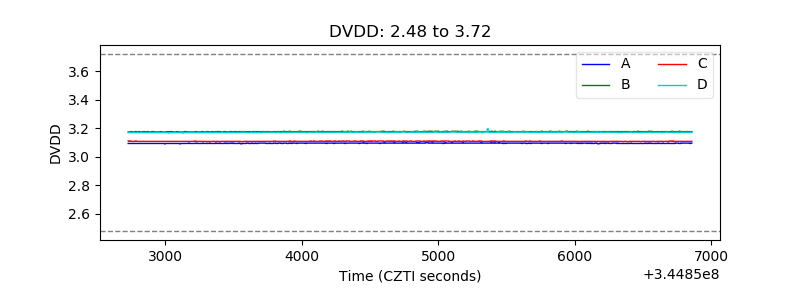 |
| Temperature 1 | 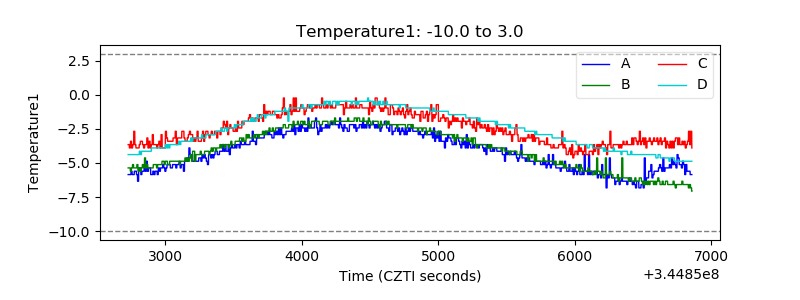 |
| Veto HV Monitor | 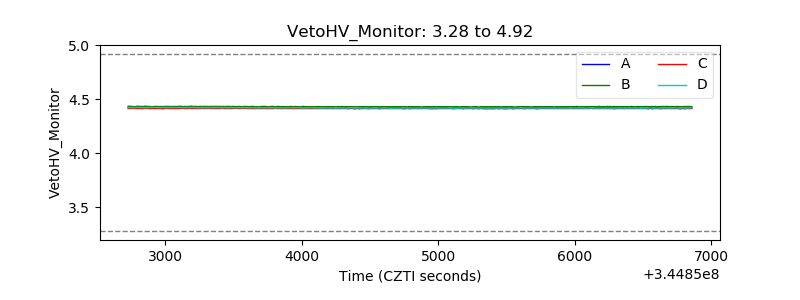 |
| Veto LLD | 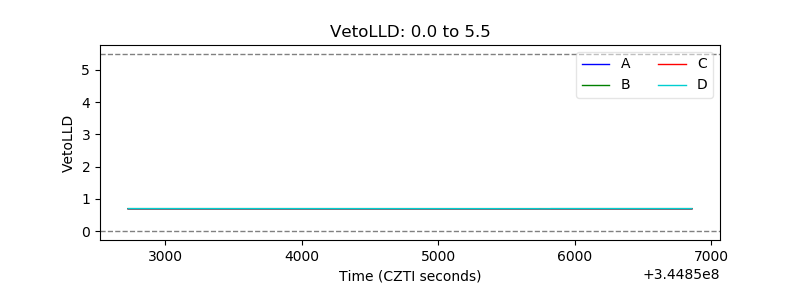 |
| Alpha Counter | 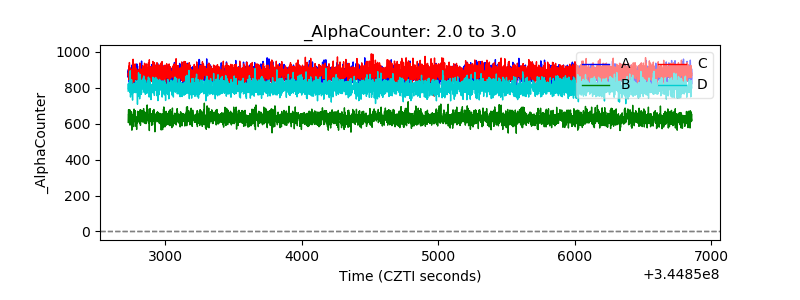 |
| _CPM_Rate | 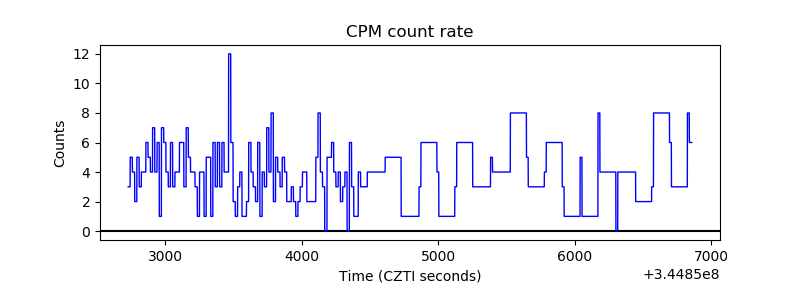 |
| CZT Counter | 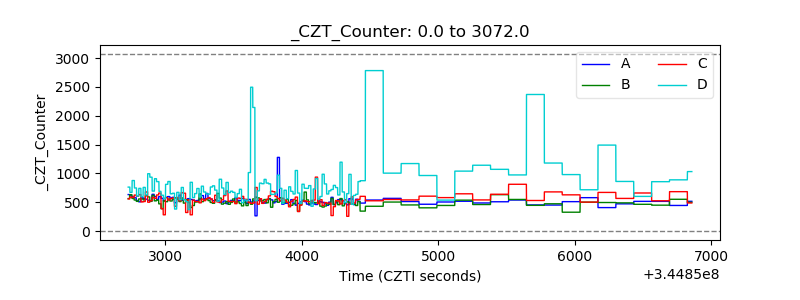 |
| +2.5 Volts monitor |  |
| +5 Volts monitor |  |
| _ROLL_ROT | 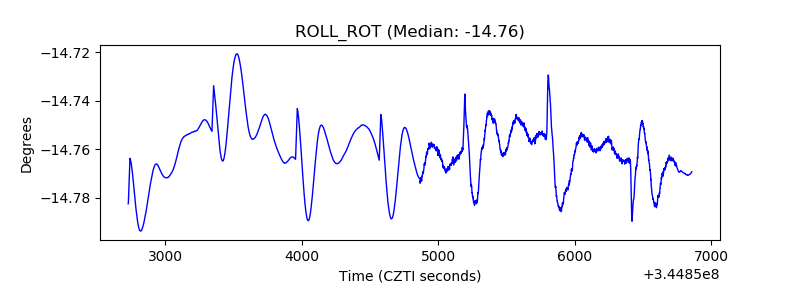 |
| _Roll_DEC | 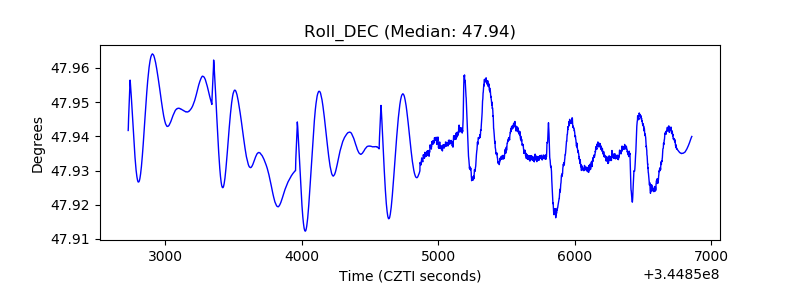 |
| _Roll_RA | 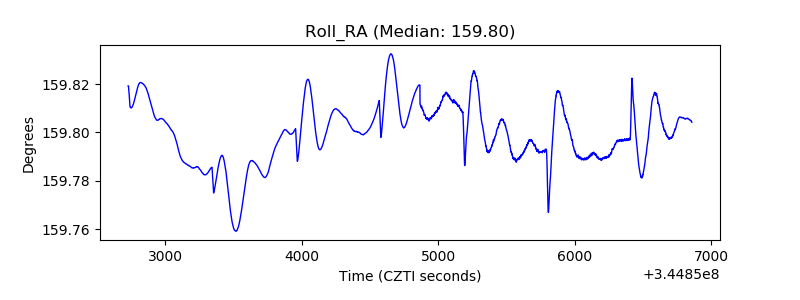 |
| Veto Counter |  |