| Param | Original file | Final file |
|---|---|---|
| Filename | modeM0/AS1A10_057T02_9000004054_28053cztM0_level2.evt | modeM0/AS1A10_057T02_9000004054_28053cztM0_level2_quad_clean.evt |
| Size (bytes) | 148,452,480 | 12,130,560 |
| Size | 141.6 MB | 11.6 MB |
| Events in quadrant A | 997,149 | 62,509 |
| Events in quadrant B | 957,154 | 63,844 |
| Events in quadrant C | 971,894 | 60,404 |
| Events in quadrant D | 1,455,822 | 58,854 |
| Mode M9 | |||
|---|---|---|---|
| Quadrant | BADHDUFLAG | Total packets | Discarded packets |
| A | 0 | 12 | 0 |
| B | 0 | 12 | 0 |
| C | 0 | 12 | 0 |
| D | 0 | 12 | 0 |
| Mode M0 | |||
|---|---|---|---|
| Quadrant | BADHDUFLAG | Total packets | Discarded packets |
| A | 0 | 4126 | 0 |
| B | 0 | 3847 | 0 |
| C | 0 | 3944 | 0 |
| D | 0 | 5520 | 0 |
| Quadrant | Total seconds | Saturated seconds | Saturation percentage |
|---|---|---|---|
| A | 1638 | 12 | 0.732601% |
| B | 1638 | 15 | 0.915751% |
| C | 1638 | 32 | 1.953602% |
| D | 1638 | 64 | 3.907204% |
Noise dominated data is calculated using 1-second bins in cleaned event files. If a bin has >2000 counts, and if more than 50% of those come from <1% of pixels, then it is considered to be noise-dominated and hence unusable.
| Quadrant | # 1 sec bins | Bins with >0 counts | Bins with >2000 counts | High rate bins dominated by noise | Noise dominated (total time) | Noise dominated (detector-on time) | Marked lightcurve |
|---|---|---|---|---|---|---|---|
| A | 1638 | 1638 | 0 | 0 | 0.00% | 0.00% | 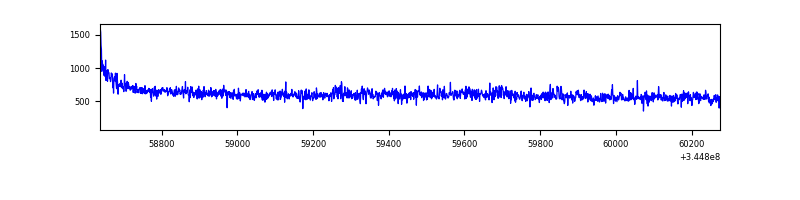 |
| B | 1638 | 1638 | 0 | 0 | 0.00% | 0.00% | 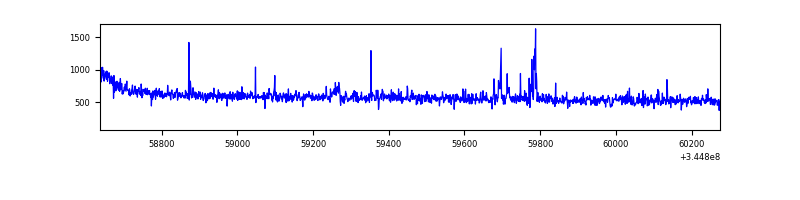 |
| C | 1638 | 1638 | 0 | 0 | 0.00% | 0.00% | 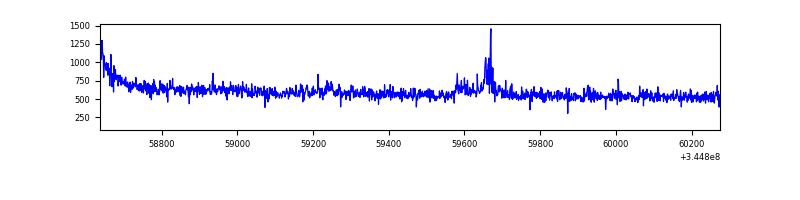 |
| D | 1638 | 1638 | 55 | 55 | 3.36% | 3.36% | 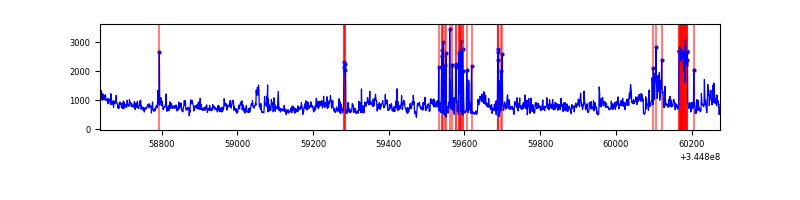 |
Top three noisy pixels from each quadrant. If the there are fewer than three noisy pixels in the level2.evt file, extra rows are filled as -1
| Pixel properties | Quadrant properties | ||||||
|---|---|---|---|---|---|---|---|
| Quadrant | DetID | PixID | Counts | Sigma | Mean | Median | Sigma |
| A | 0 | 13 | 49118 | 982.33 | 245 | 240 | 49.8 |
| A | 13 | 254 | 2824 | 51.93 | 245 | 240 | 49.8 |
| A | 8 | 192 | 2778 | 51.01 | 245 | 240 | 49.8 |
| B | 0 | 156 | 12983 | 278.11 | 238 | 233 | 45.8 |
| B | 12 | 111 | 5219 | 108.76 | 238 | 233 | 45.8 |
| B | 11 | 111 | 4663 | 96.63 | 238 | 233 | 45.8 |
| C | 3 | 233 | 40788 | 749.1 | 228 | 230 | 54.1 |
| C | 14 | 238 | 38401 | 705.01 | 228 | 230 | 54.1 |
| C | 13 | 61 | 1534 | 24.08 | 228 | 230 | 54.1 |
| D | 8 | 195 | 377335 | 6804.73 | 231 | 226 | 55.4 |
| D | 1 | 52 | 158815 | 2861.65 | 231 | 226 | 55.4 |
| D | 2 | 250 | 29137 | 521.68 | 231 | 226 | 55.4 |
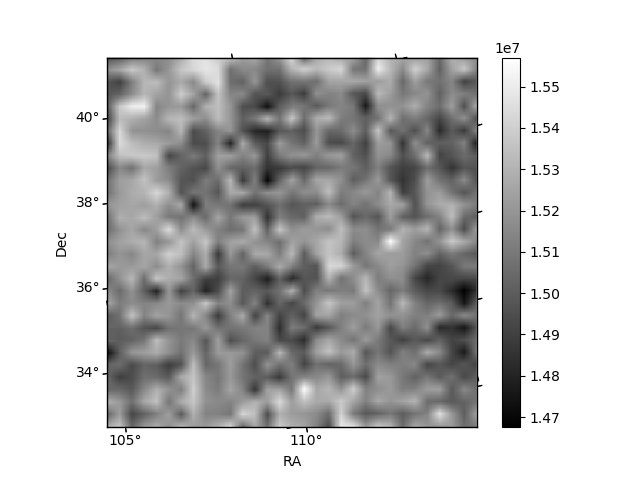
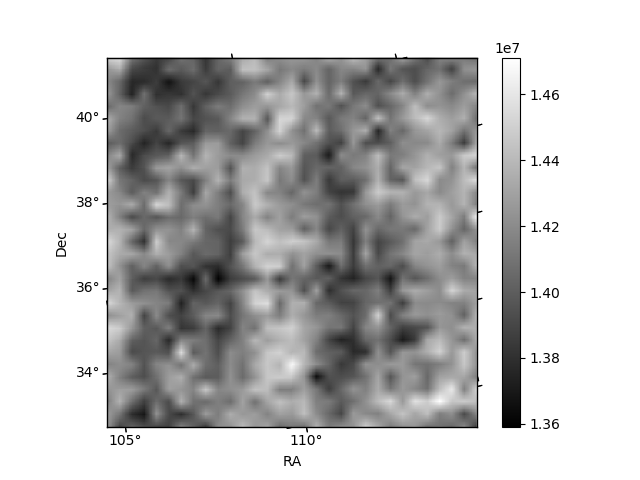
Histogram calculated using DETX and DETY for each event in the final _common_clean file
| Quadrant A |  |
 |
Quadrant B |
|---|---|---|---|
| Quadrant D |  |
 |
Quadrant C |
| Plot type | Count rate plots | Images |
|---|---|---|
| Comparison with Poisson distribution Blue bars denote a histogram of data divided into 1 sec bins. Red curve is a Poisson curve with rate = median count rate of data. |
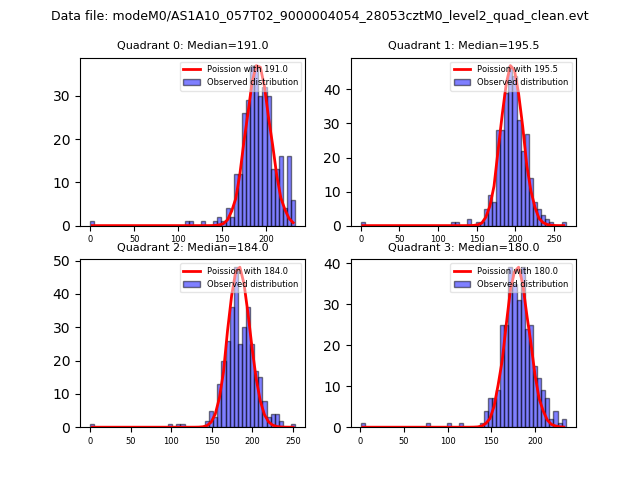 |
 |
| Quadrant-wise count rates Data is divided into 100 sec bins |
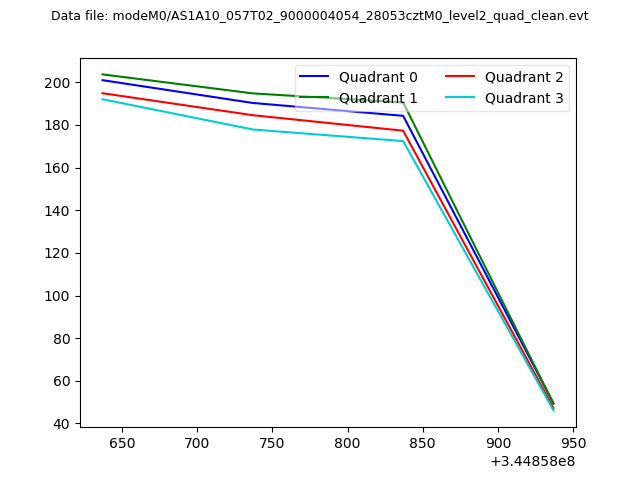 |
|
| Module-wise count rates for Quadrant A Data is divided into 100 sec bins |
 |
 |
| Module-wise count rates for Quadrant B Data is divided into 100 sec bins |
 |
 |
| Module-wise count rates for Quadrant C Data is divided into 100 sec bins |
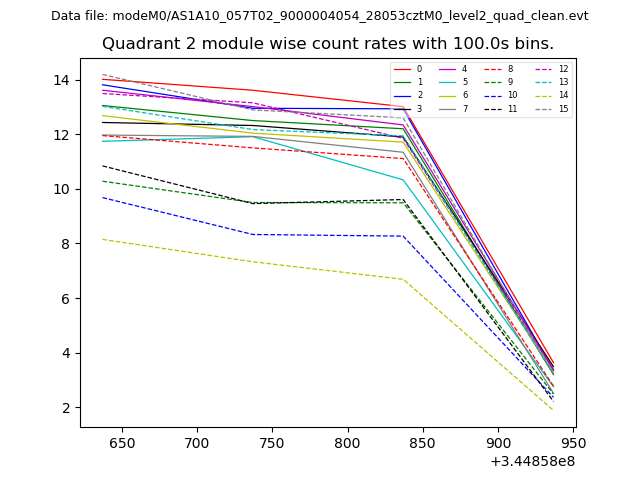 |
 |
| Module-wise count rates for Quadrant D Data is divided into 100 sec bins |
 |
 |
| Parameter | Plot |
|---|---|
| CZT HV Monitor | 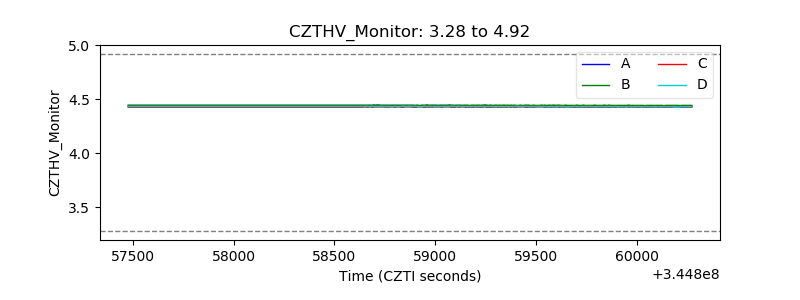 |
| D_VDD |  |
| Temperature 1 |  |
| Veto HV Monitor |  |
| Veto LLD |  |
| Alpha Counter | 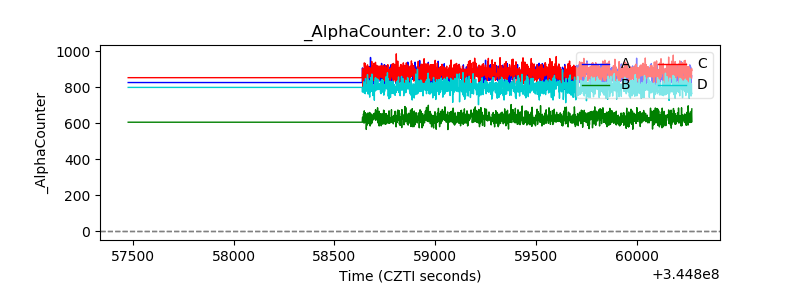 |
| _CPM_Rate | 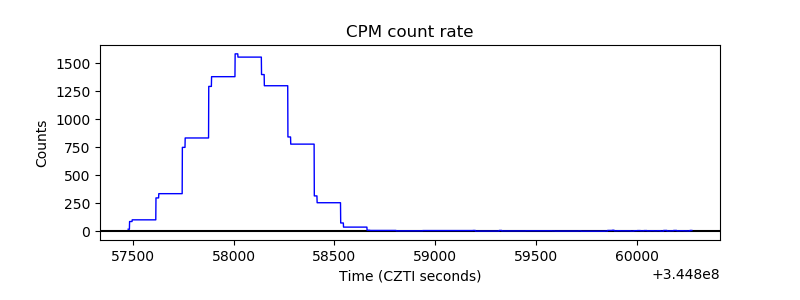 |
| CZT Counter |  |
| +2.5 Volts monitor |  |
| +5 Volts monitor |  |
| _ROLL_ROT |  |
| _Roll_DEC |  |
| _Roll_RA |  |
| Veto Counter |  |