| Param | Original file | Final file |
|---|---|---|
| Filename | modeM0/AS1A10_057T02_9000004054_28054cztM0_level2.evt | modeM0/AS1A10_057T02_9000004054_28054cztM0_level2_quad_clean.evt |
| Size (bytes) | 568,906,560 | 71,879,040 |
| Size | 542.6 MB | 68.5 MB |
| Events in quadrant A | 3,589,294 | 445,633 |
| Events in quadrant B | 3,471,221 | 441,961 |
| Events in quadrant C | 3,758,185 | 424,136 |
| Events in quadrant D | 5,971,104 | 411,679 |
| Mode M9 | |||
|---|---|---|---|
| Quadrant | BADHDUFLAG | Total packets | Discarded packets |
| A | 0 | 12 | 0 |
| B | 0 | 12 | 0 |
| C | 0 | 12 | 0 |
| D | 0 | 12 | 0 |
| Mode M0 | |||
|---|---|---|---|
| Quadrant | BADHDUFLAG | Total packets | Discarded packets |
| A | 0 | 14592 | 0 |
| B | 0 | 14152 | 0 |
| C | 0 | 15097 | 0 |
| D | 0 | 22378 | 0 |
| Quadrant | Total seconds | Saturated seconds | Saturation percentage |
|---|---|---|---|
| A | 6498 | 114 | 1.754386% |
| B | 6499 | 118 | 1.815664% |
| C | 6499 | 164 | 2.523465% |
| D | 6499 | 395 | 6.077858% |
Noise dominated data is calculated using 1-second bins in cleaned event files. If a bin has >2000 counts, and if more than 50% of those come from <1% of pixels, then it is considered to be noise-dominated and hence unusable.
| Quadrant | # 1 sec bins | Bins with >0 counts | Bins with >2000 counts | High rate bins dominated by noise | Noise dominated (total time) | Noise dominated (detector-on time) | Marked lightcurve |
|---|---|---|---|---|---|---|---|
| A | 7668 | 6498 | 1 | 1 | 0.01% | 0.02% | 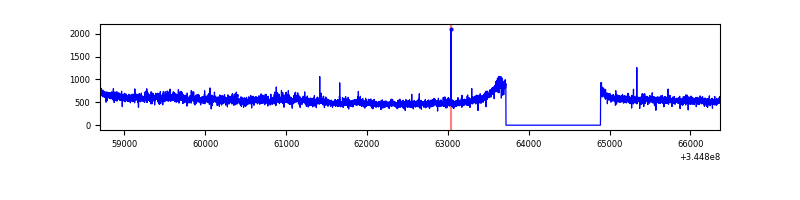 |
| B | 7669 | 6499 | 1 | 1 | 0.01% | 0.02% | 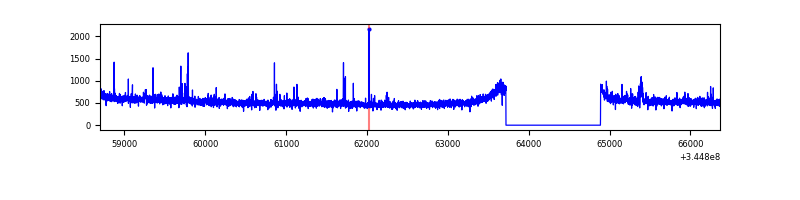 |
| C | 7669 | 6499 | 0 | 0 | 0.00% | 0.00% | 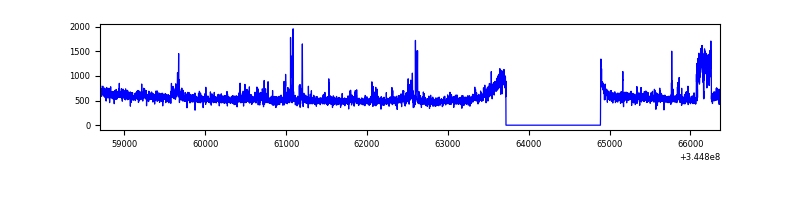 |
| D | 7669 | 6499 | 288 | 288 | 3.76% | 4.43% | 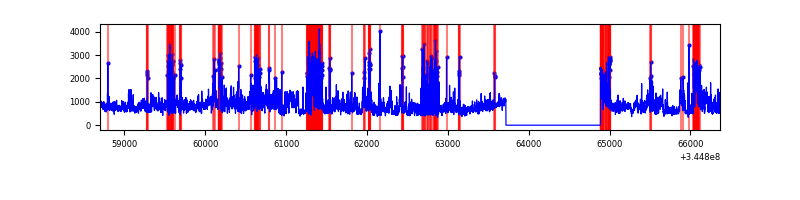 |
Top three noisy pixels from each quadrant. If the there are fewer than three noisy pixels in the level2.evt file, extra rows are filled as -1
| Pixel properties | Quadrant properties | ||||||
|---|---|---|---|---|---|---|---|
| Quadrant | DetID | PixID | Counts | Sigma | Mean | Median | Sigma |
| A | 0 | 13 | 172163 | 970.69 | 885 | 870 | 176.5 |
| A | 13 | 254 | 11276 | 58.97 | 885 | 870 | 176.5 |
| A | 3 | 137 | 8022 | 40.53 | 885 | 870 | 176.5 |
| B | 4 | 200 | 22128 | 130.57 | 868 | 847 | 163.0 |
| B | 12 | 111 | 19554 | 114.77 | 868 | 847 | 163.0 |
| B | 11 | 111 | 17369 | 101.37 | 868 | 847 | 163.0 |
| C | 3 | 233 | 353031 | 1818.97 | 837 | 843 | 193.6 |
| C | 14 | 238 | 135784 | 696.94 | 837 | 843 | 193.6 |
| C | 13 | 61 | 5794 | 25.57 | 837 | 843 | 193.6 |
| D | 8 | 195 | 1765154 | 8870.64 | 840 | 820 | 198.9 |
| D | 1 | 52 | 557531 | 2799.01 | 840 | 820 | 198.9 |
| D | 2 | 250 | 333322 | 1671.74 | 840 | 820 | 198.9 |
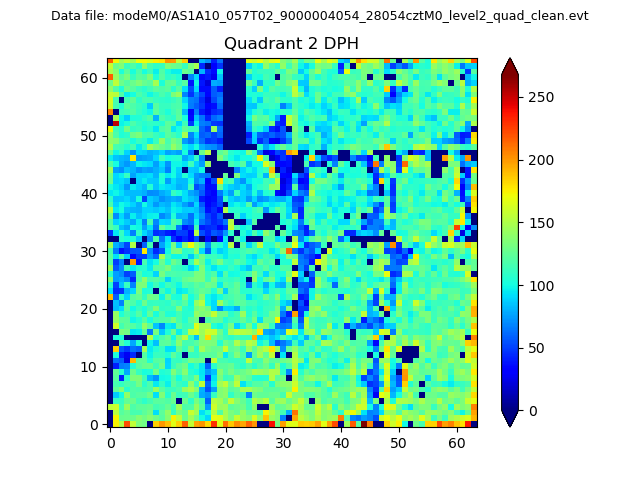
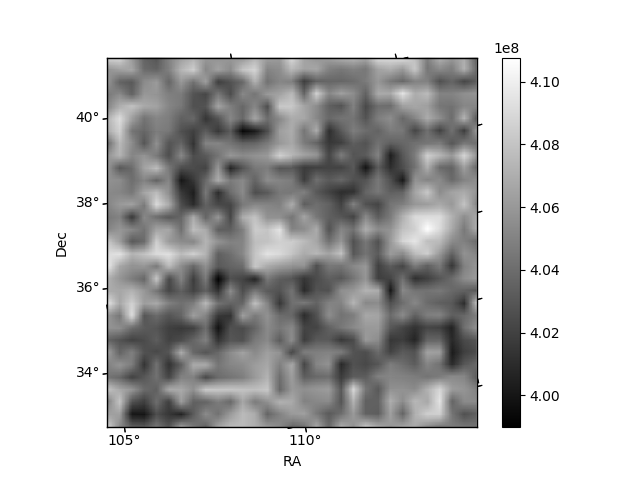
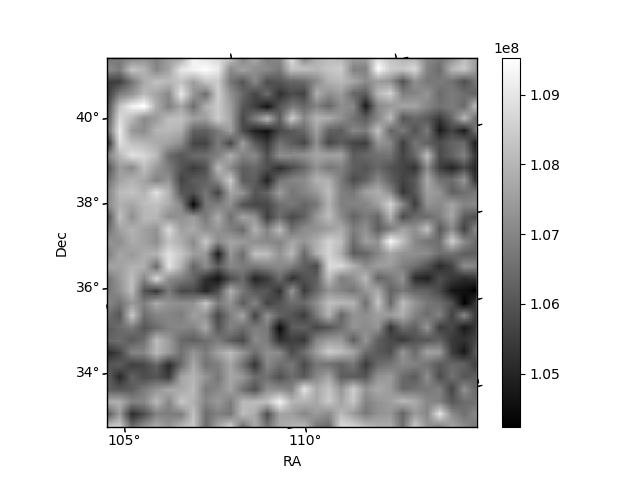
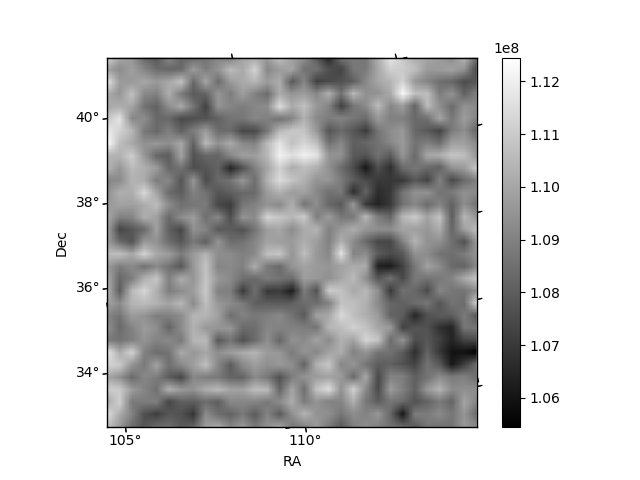
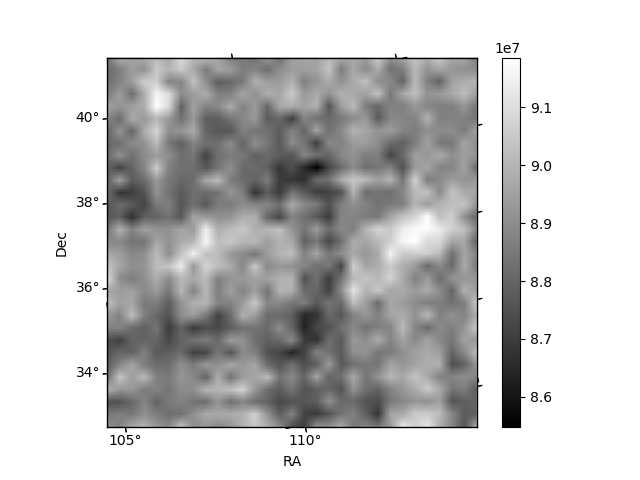
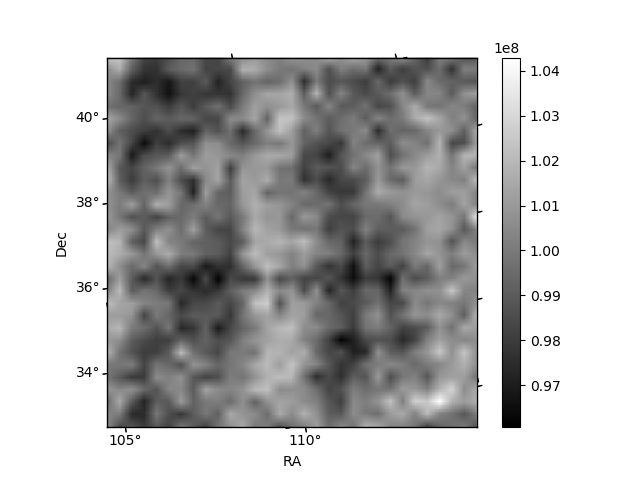
Histogram calculated using DETX and DETY for each event in the final _common_clean file
| Quadrant A | 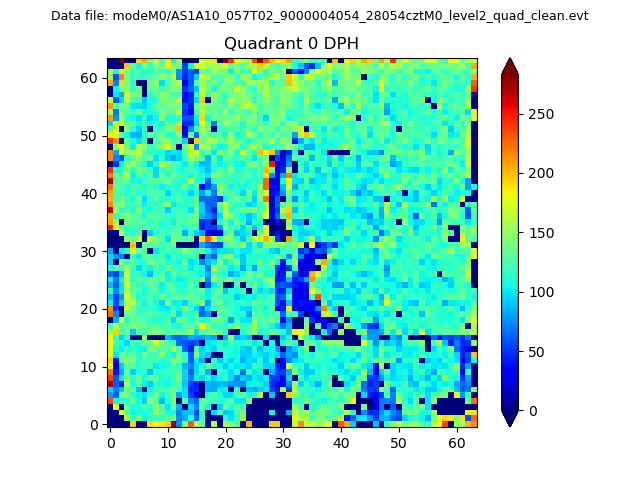 |
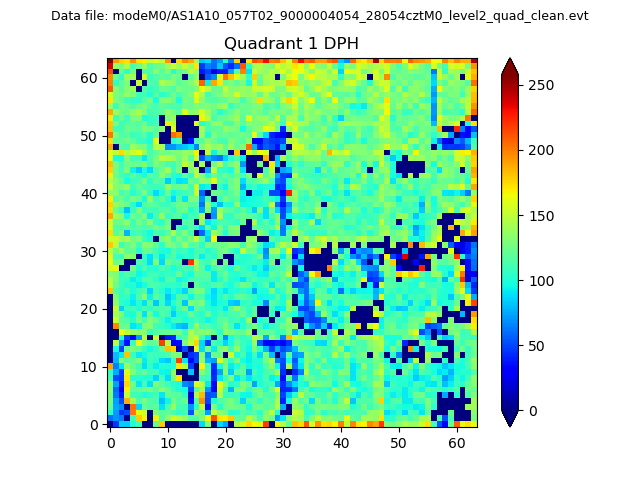 |
Quadrant B |
|---|---|---|---|
| Quadrant D | 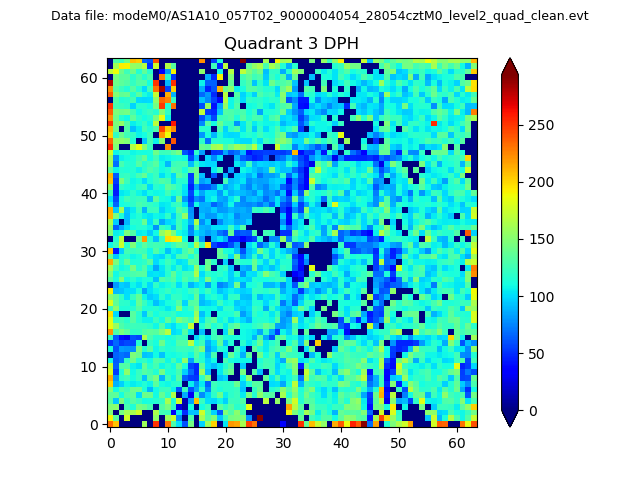 |
 |
Quadrant C |
| Plot type | Count rate plots | Images |
|---|---|---|
| Comparison with Poisson distribution Blue bars denote a histogram of data divided into 1 sec bins. Red curve is a Poisson curve with rate = median count rate of data. |
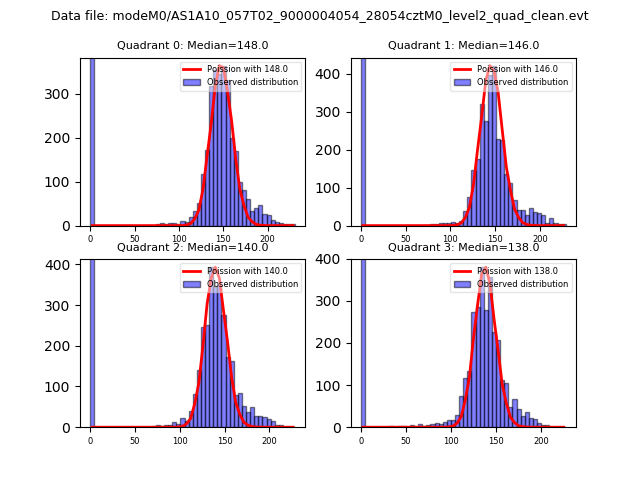 |
 |
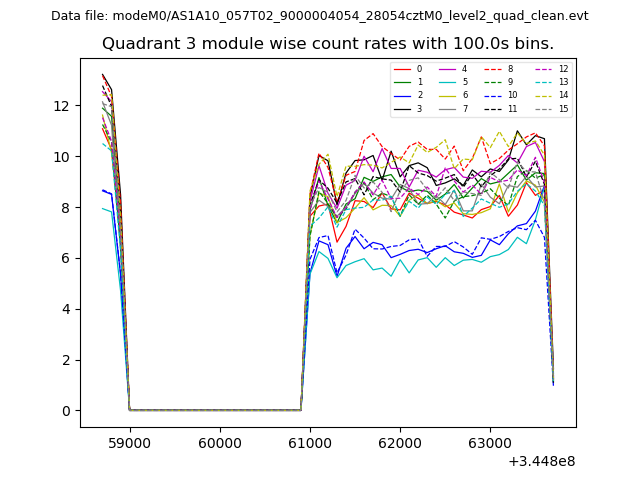
| Quadrant-wise count rates Data is divided into 100 sec bins |
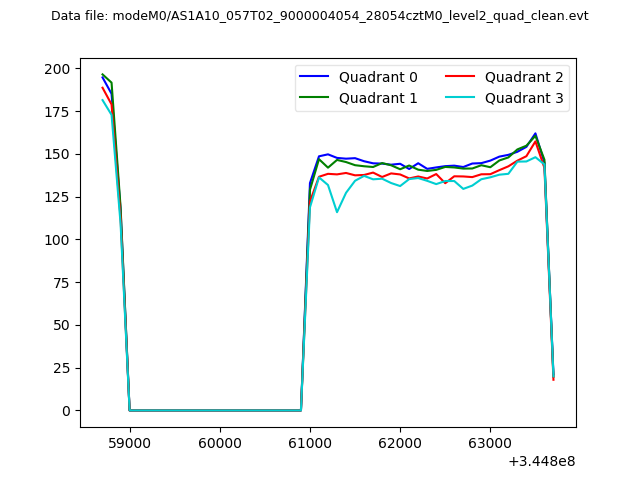 |
|
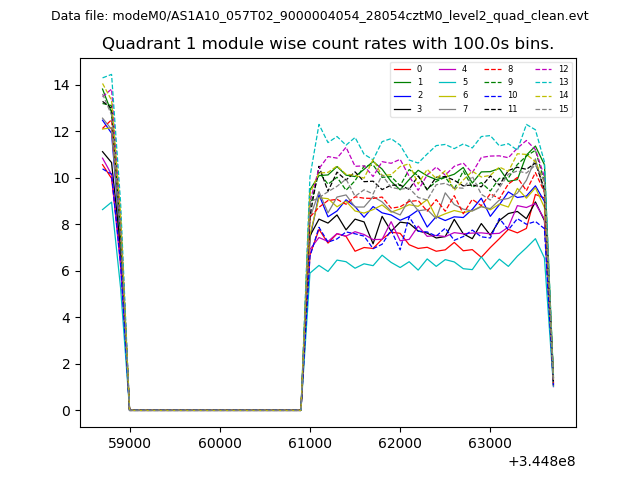
| Module-wise count rates for Quadrant A Data is divided into 100 sec bins |
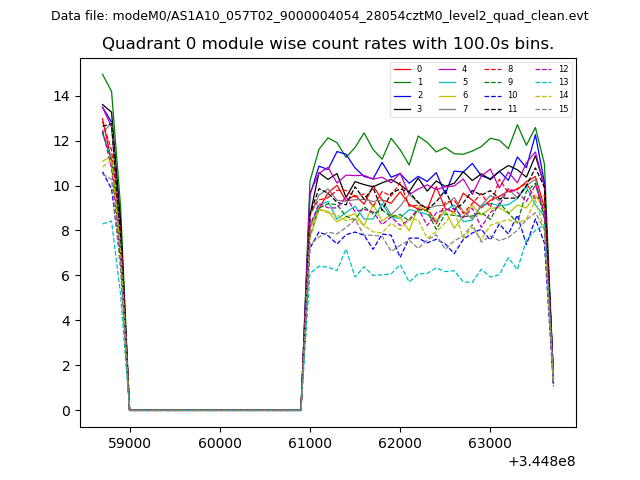 |
 |
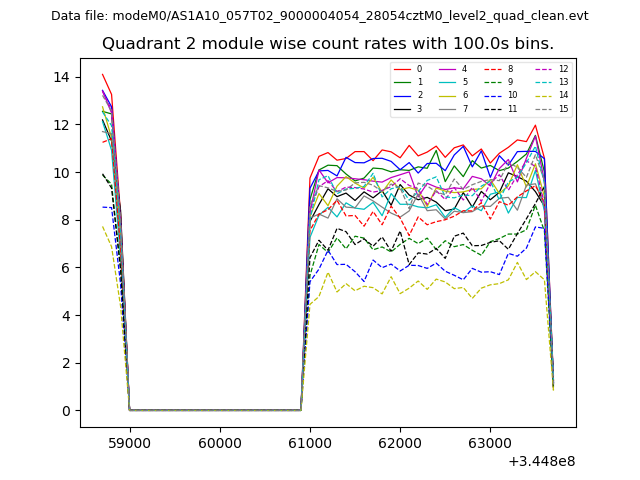
| Module-wise count rates for Quadrant B Data is divided into 100 sec bins |
 |
 |
| Module-wise count rates for Quadrant C Data is divided into 100 sec bins |
 |
 |
| Module-wise count rates for Quadrant D Data is divided into 100 sec bins |
 |
 |
| Parameter | Plot |
|---|---|
| CZT HV Monitor | 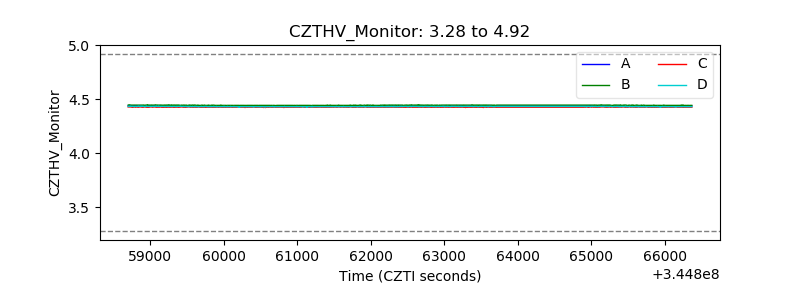 |
| D_VDD | 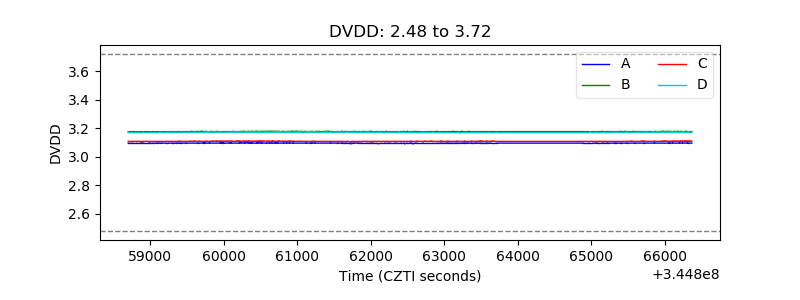 |
| Temperature 1 | 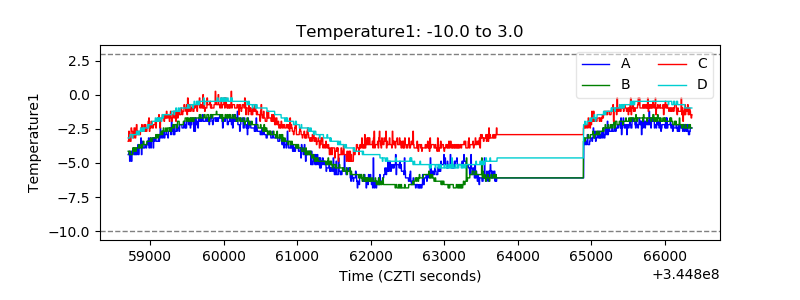 |
| Veto HV Monitor | 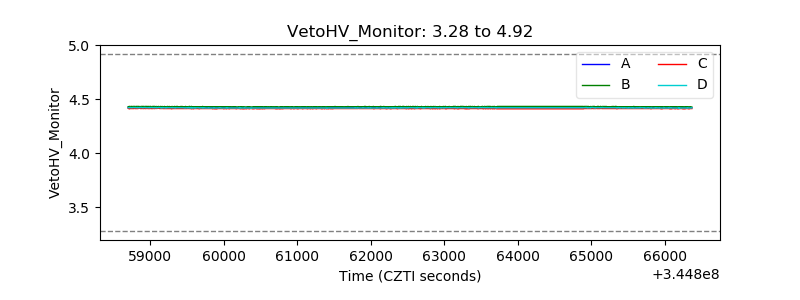 |
| Veto LLD | 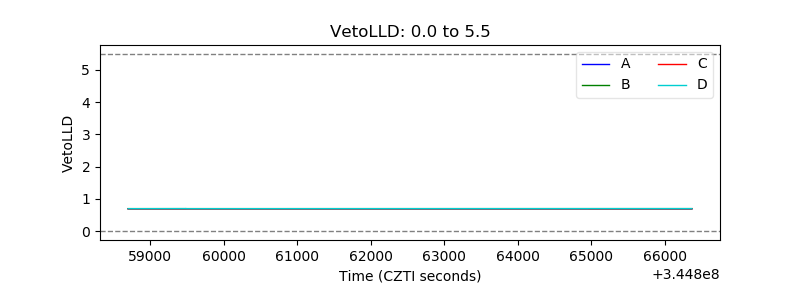 |
| Alpha Counter | 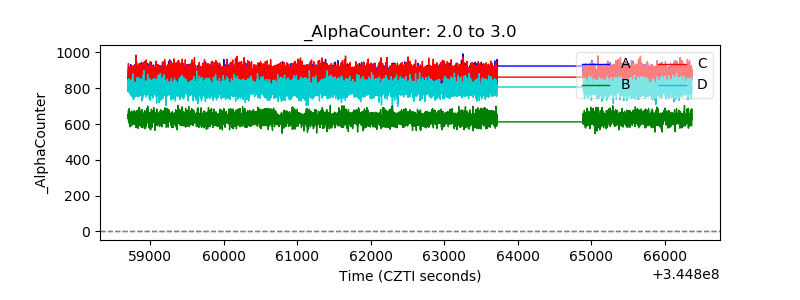 |
| _CPM_Rate | 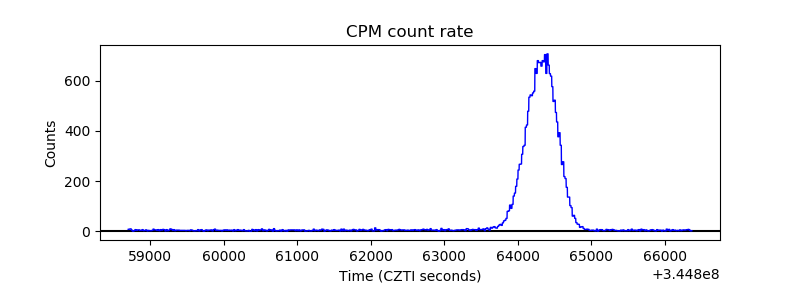 |
| CZT Counter | 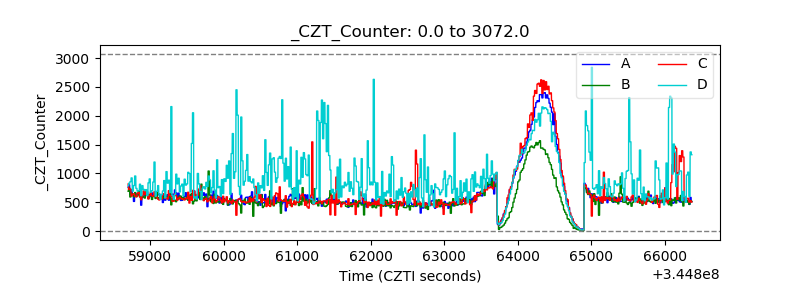 |
| +2.5 Volts monitor | 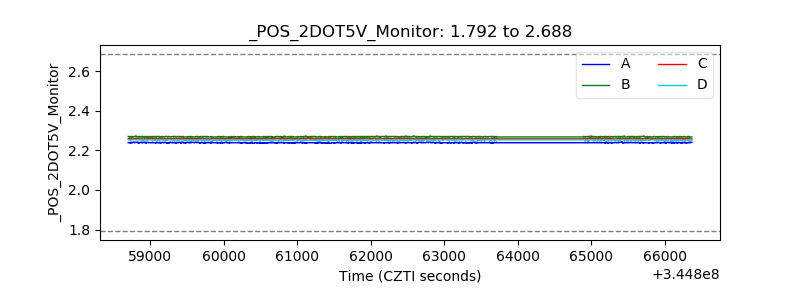 |
| +5 Volts monitor | 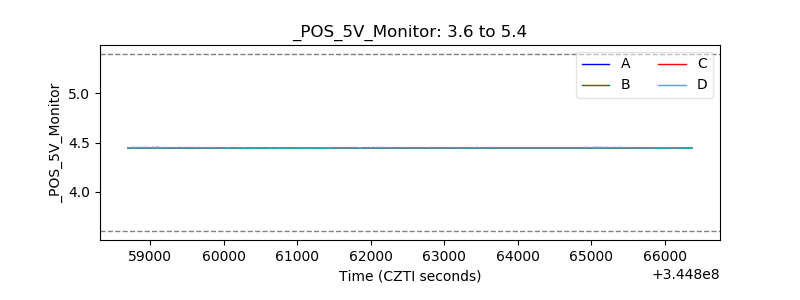 |
| _ROLL_ROT | 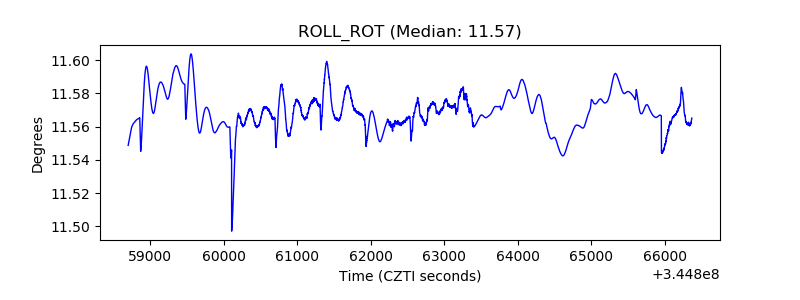 |
| _Roll_DEC | 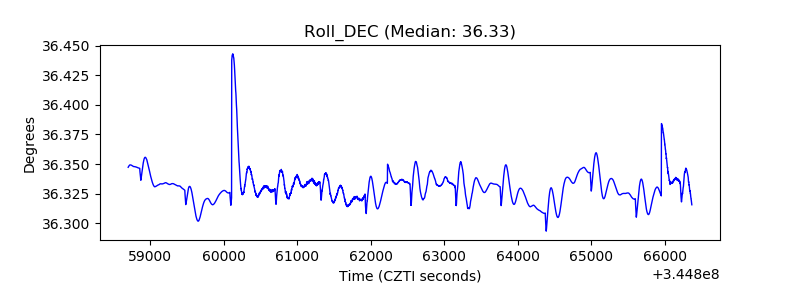 |
| _Roll_RA | 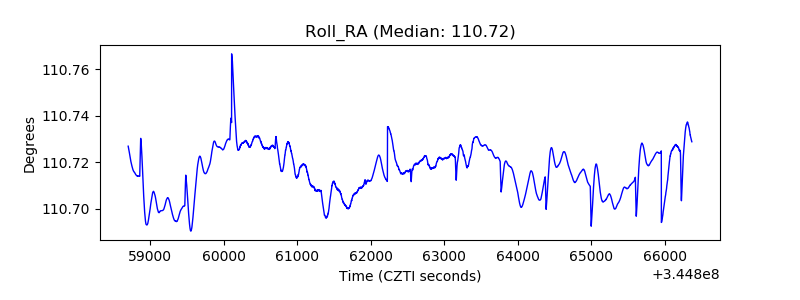 |
| Veto Counter | 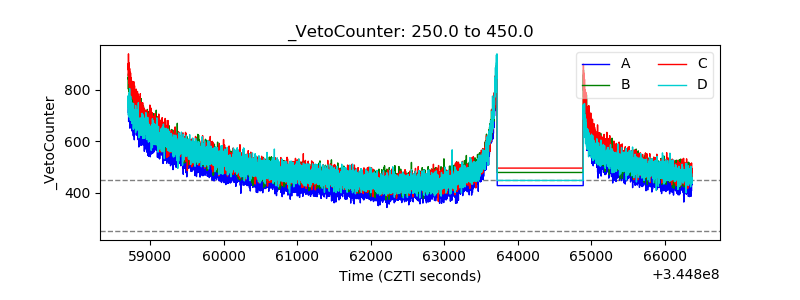 |