| Param | Original file | Final file |
|---|---|---|
| Filename | modeM0/AS1A10_057T02_9000004054_28055cztM0_level2.evt | modeM0/AS1A10_057T02_9000004054_28055cztM0_level2_quad_clean.evt |
| Size (bytes) | 584,919,360 | 76,397,760 |
| Size | 557.8 MB | 72.9 MB |
| Events in quadrant A | 3,521,308 | 474,060 |
| Events in quadrant B | 3,482,596 | 471,745 |
| Events in quadrant C | 3,787,708 | 451,719 |
| Events in quadrant D | 6,460,328 | 439,864 |
| Mode M9 | |||
|---|---|---|---|
| Quadrant | BADHDUFLAG | Total packets | Discarded packets |
| A | 0 | 11 | 0 |
| B | 0 | 12 | 0 |
| C | 0 | 12 | 0 |
| D | 0 | 12 | 0 |
| Mode M0 | |||
|---|---|---|---|
| Quadrant | BADHDUFLAG | Total packets | Discarded packets |
| A | 0 | 14531 | 0 |
| B | 0 | 14429 | 0 |
| C | 0 | 15345 | 0 |
| D | 0 | 23932 | 0 |
| Quadrant | Total seconds | Saturated seconds | Saturation percentage |
|---|---|---|---|
| A | 6837 | 111 | 1.623519% |
| B | 6837 | 125 | 1.828287% |
| C | 6837 | 170 | 2.486471% |
| D | 6837 | 532 | 7.781191% |
Noise dominated data is calculated using 1-second bins in cleaned event files. If a bin has >2000 counts, and if more than 50% of those come from <1% of pixels, then it is considered to be noise-dominated and hence unusable.
| Quadrant | # 1 sec bins | Bins with >0 counts | Bins with >2000 counts | High rate bins dominated by noise | Noise dominated (total time) | Noise dominated (detector-on time) | Marked lightcurve |
|---|---|---|---|---|---|---|---|
| A | 7682 | 6837 | 0 | 0 | 0.00% | 0.00% | 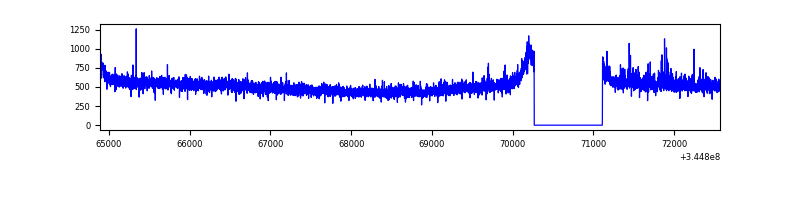 |
| B | 7682 | 6837 | 1 | 1 | 0.01% | 0.01% | 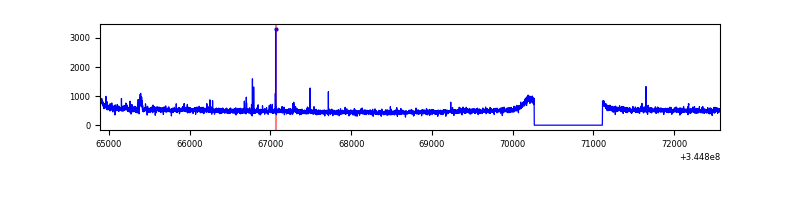 |
| C | 7682 | 6837 | 1 | 1 | 0.01% | 0.01% | 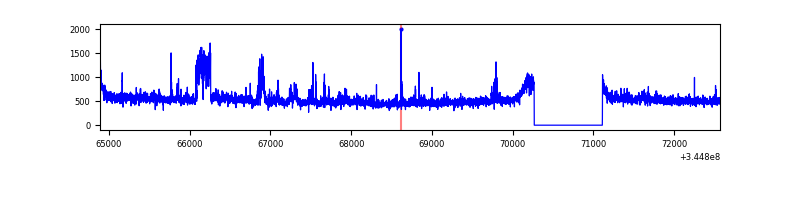 |
| D | 7682 | 6837 | 396 | 396 | 5.15% | 5.79% |  |
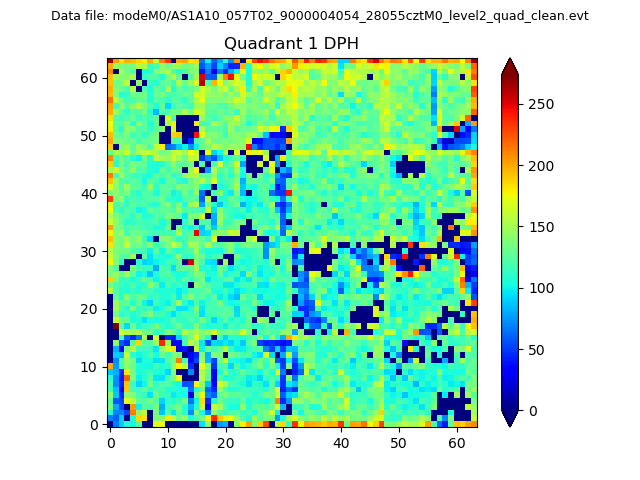
Top three noisy pixels from each quadrant. If the there are fewer than three noisy pixels in the level2.evt file, extra rows are filled as -1
| Pixel properties | Quadrant properties | ||||||
|---|---|---|---|---|---|---|---|
| Quadrant | DetID | PixID | Counts | Sigma | Mean | Median | Sigma |
| A | 0 | 13 | 102775 | 570.81 | 886 | 869 | 178.5 |
| A | 13 | 254 | 11717 | 60.76 | 886 | 869 | 178.5 |
| A | 3 | 137 | 8291 | 41.57 | 886 | 869 | 178.5 |
| B | 4 | 52 | 26725 | 155.8 | 873 | 852 | 166.1 |
| B | 12 | 111 | 19889 | 114.63 | 873 | 852 | 166.1 |
| B | 4 | 200 | 19287 | 111.01 | 873 | 852 | 166.1 |
| C | 3 | 233 | 374684 | 1905.49 | 842 | 847 | 196.2 |
| C | 14 | 238 | 133933 | 678.35 | 842 | 847 | 196.2 |
| C | 13 | 61 | 5832 | 25.41 | 842 | 847 | 196.2 |
| D | 8 | 195 | 2095791 | 10597.04 | 837 | 815 | 197.7 |
| D | 1 | 52 | 666913 | 3369.33 | 837 | 815 | 197.7 |
| D | 2 | 250 | 463118 | 2338.47 | 837 | 815 | 197.7 |
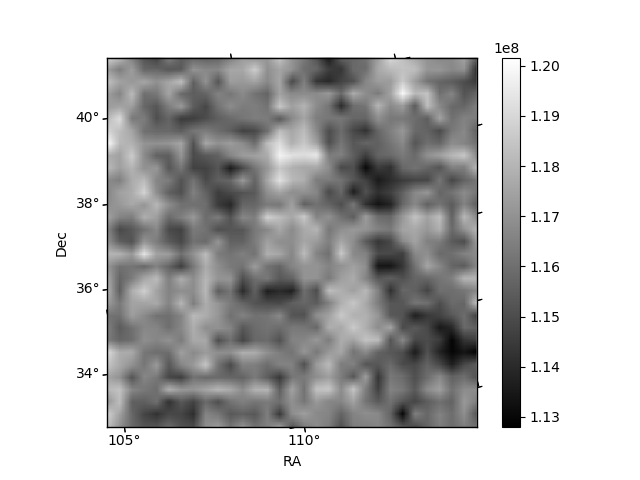
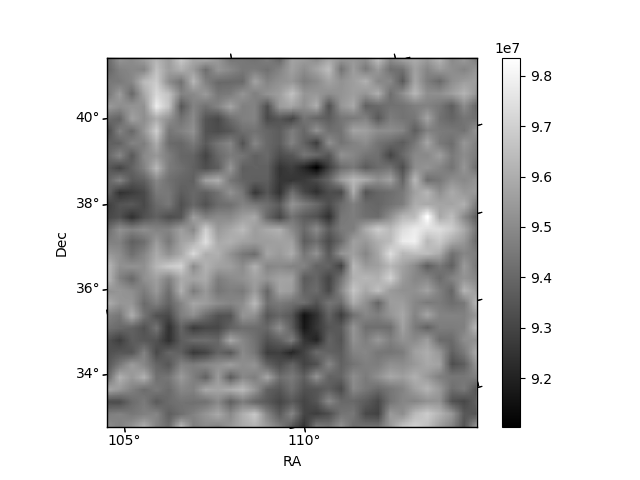
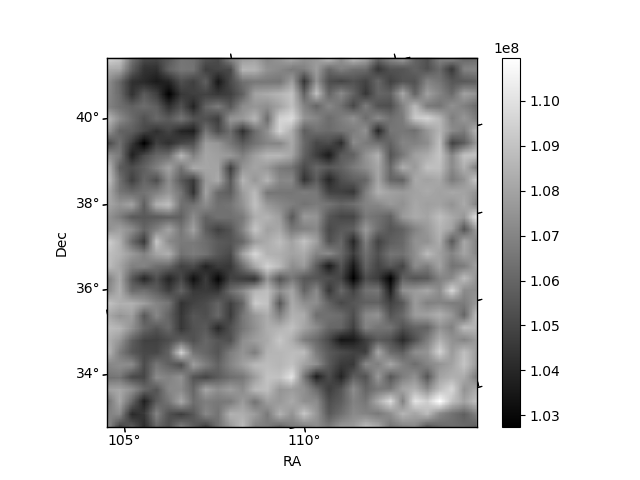
Histogram calculated using DETX and DETY for each event in the final _common_clean file
| Quadrant A | 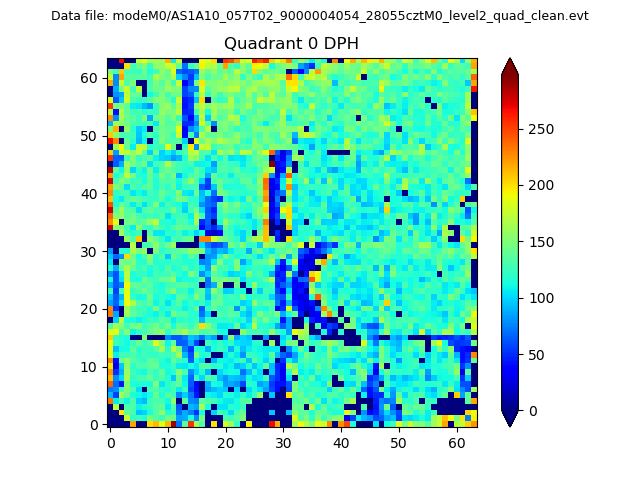 |
 |
Quadrant B |
|---|---|---|---|
| Quadrant D | 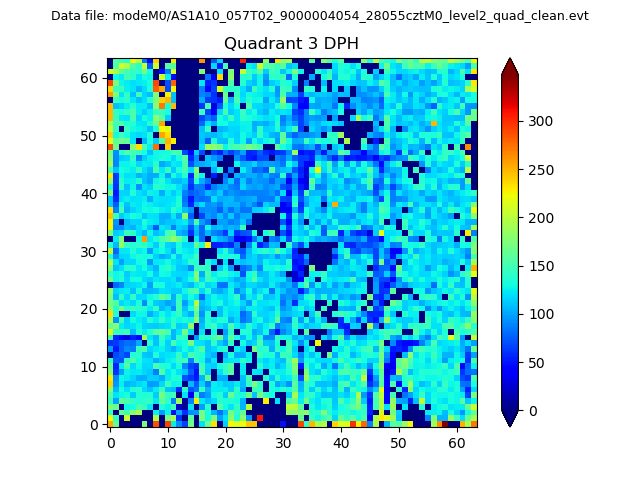 |
 |
Quadrant C |
| Plot type | Count rate plots | Images |
|---|---|---|
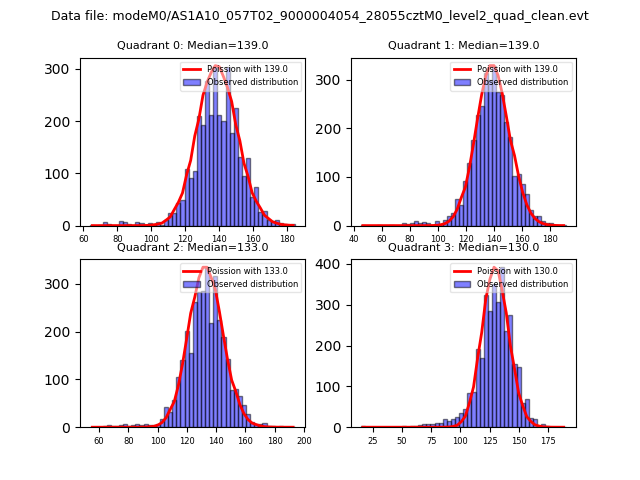
| Comparison with Poisson distribution Blue bars denote a histogram of data divided into 1 sec bins. Red curve is a Poisson curve with rate = median count rate of data. |
 |
 |
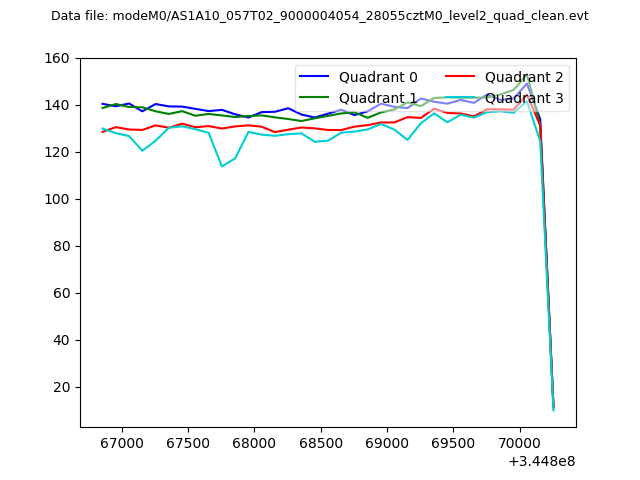
| Quadrant-wise count rates Data is divided into 100 sec bins |
 |
|
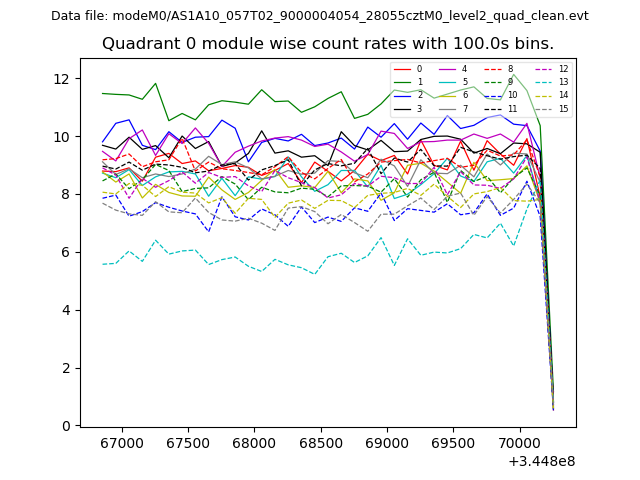
| Module-wise count rates for Quadrant A Data is divided into 100 sec bins |
 |
 |
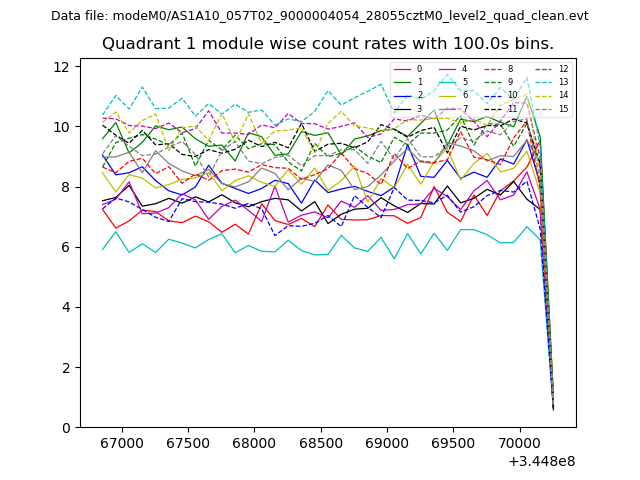
| Module-wise count rates for Quadrant B Data is divided into 100 sec bins |
 |
 |
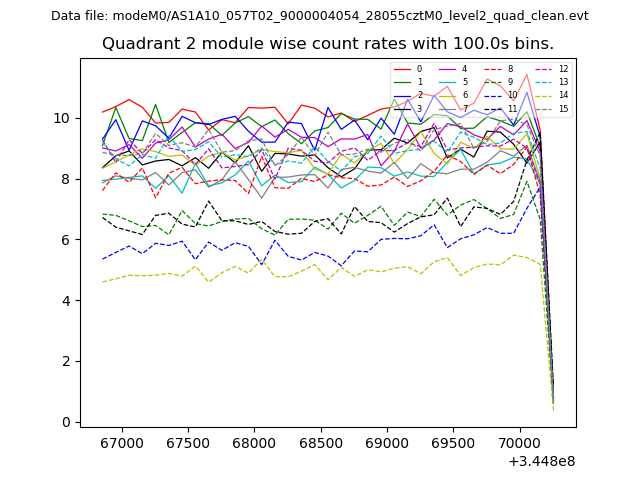
| Module-wise count rates for Quadrant C Data is divided into 100 sec bins |
 |
 |
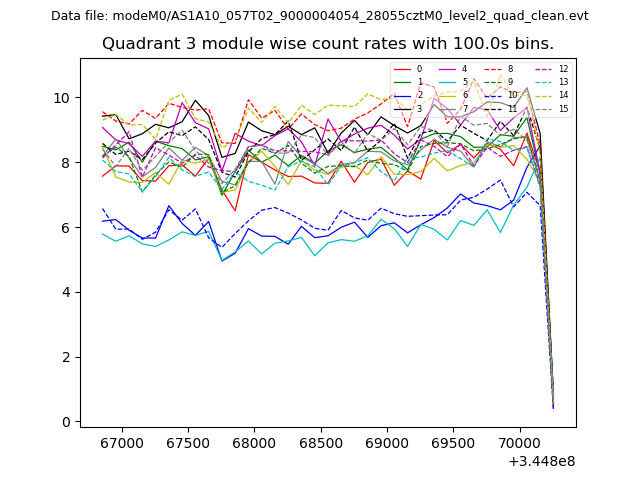
| Module-wise count rates for Quadrant D Data is divided into 100 sec bins |
 |
 |
| Parameter | Plot |
|---|---|
| CZT HV Monitor | 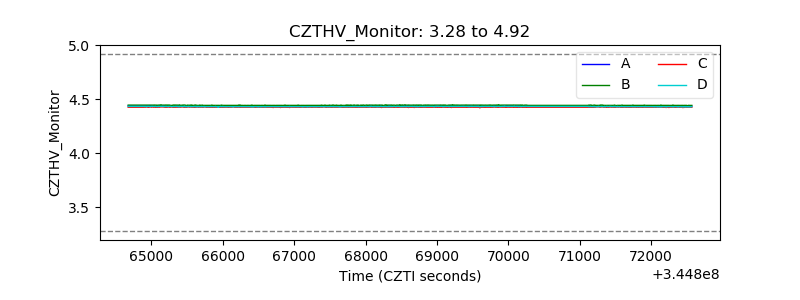 |
| D_VDD | 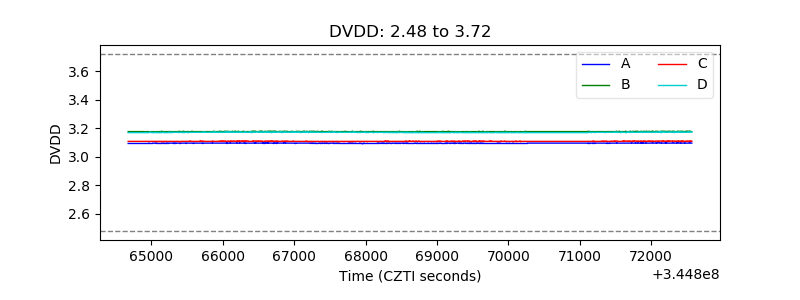 |
| Temperature 1 | 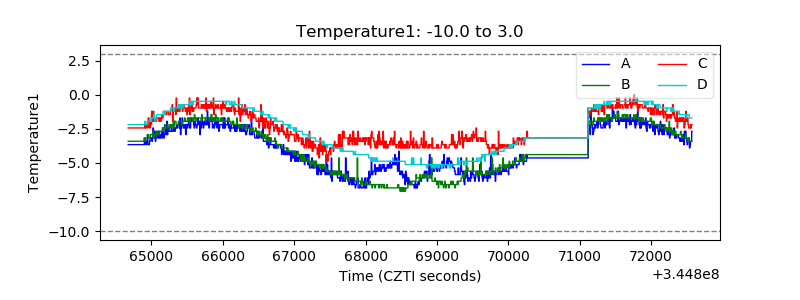 |
| Veto HV Monitor | 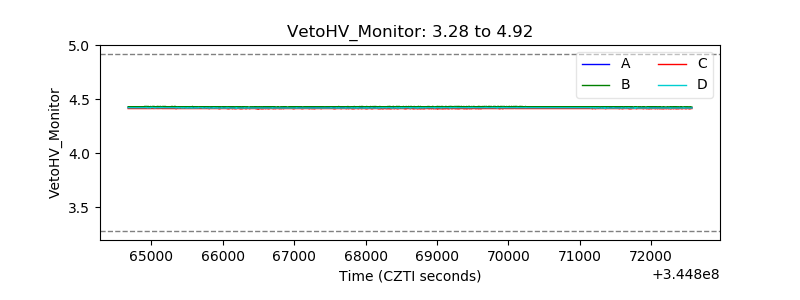 |
| Veto LLD | 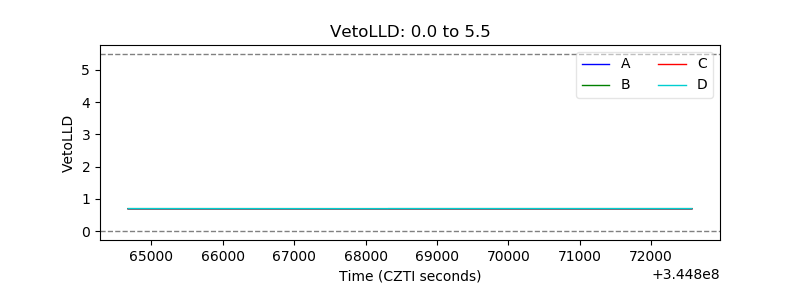 |
| Alpha Counter |  |
| _CPM_Rate | 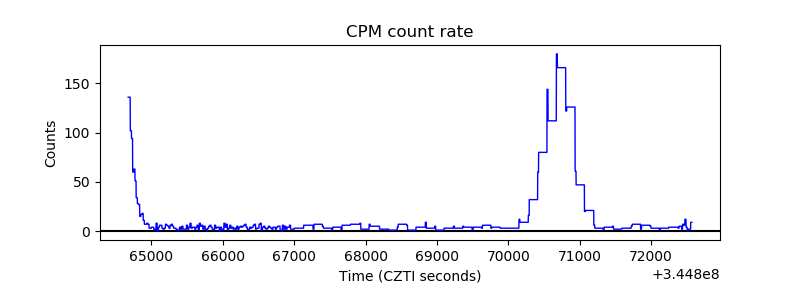 |
| CZT Counter |  |
| +2.5 Volts monitor |  |
| +5 Volts monitor |  |
| _ROLL_ROT | 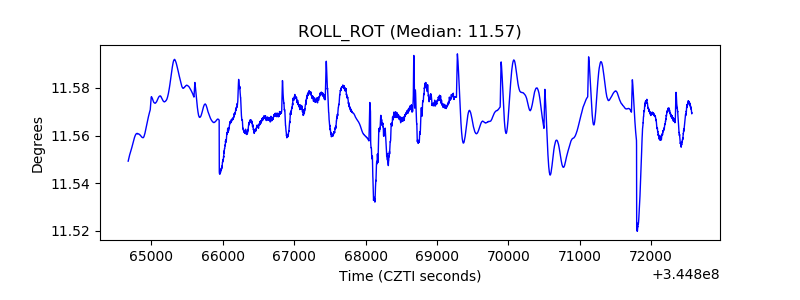 |
| _Roll_DEC | 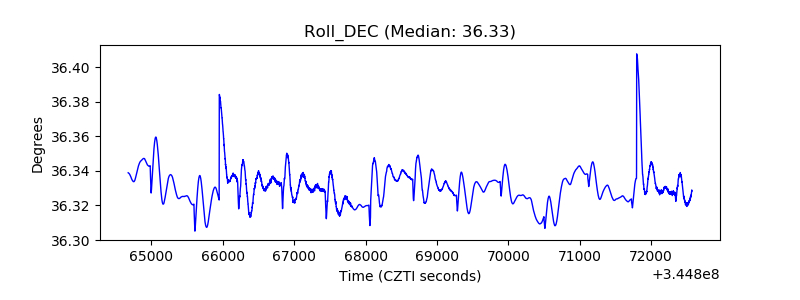 |
| _Roll_RA | 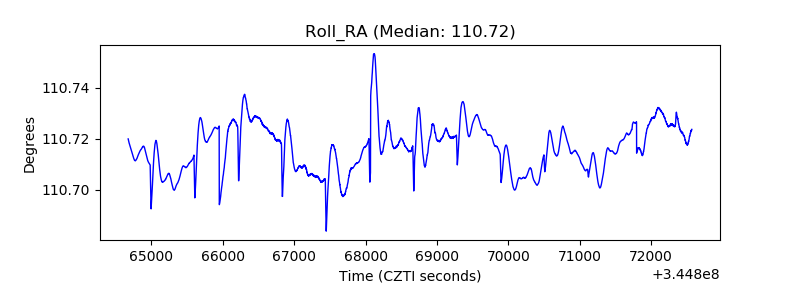 |
| Veto Counter | 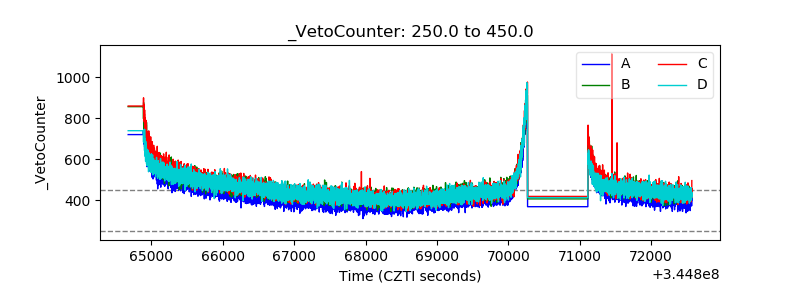 |