| Param | Original file | Final file |
|---|---|---|
| Filename | modeM0/AS1A10_057T02_9000004054_28056cztM0_level2.evt | modeM0/AS1A10_057T02_9000004054_28056cztM0_level2_quad_clean.evt |
| Size (bytes) | 633,044,160 | 85,605,120 |
| Size | 603.7 MB | 81.6 MB |
| Events in quadrant A | 3,842,350 | 539,680 |
| Events in quadrant B | 3,673,527 | 536,602 |
| Events in quadrant C | 4,346,788 | 511,959 |
| Events in quadrant D | 6,813,317 | 494,207 |
| Mode M9 | |||
|---|---|---|---|
| Quadrant | BADHDUFLAG | Total packets | Discarded packets |
| A | 0 | 3 | 0 |
| B | 0 | 4 | 0 |
| C | 0 | 4 | 0 |
| D | 0 | 4 | 0 |
| Mode M0 | |||
|---|---|---|---|
| Quadrant | BADHDUFLAG | Total packets | Discarded packets |
| A | 0 | 15986 | 0 |
| B | 0 | 15428 | 0 |
| C | 0 | 17498 | 0 |
| D | 0 | 25299 | 0 |
| Quadrant | Total seconds | Saturated seconds | Saturation percentage |
|---|---|---|---|
| A | 7318 | 139 | 1.899426% |
| B | 7318 | 150 | 2.049740% |
| C | 7318 | 300 | 4.099481% |
| D | 7318 | 603 | 8.239956% |
Noise dominated data is calculated using 1-second bins in cleaned event files. If a bin has >2000 counts, and if more than 50% of those come from <1% of pixels, then it is considered to be noise-dominated and hence unusable.
| Quadrant | # 1 sec bins | Bins with >0 counts | Bins with >2000 counts | High rate bins dominated by noise | Noise dominated (total time) | Noise dominated (detector-on time) | Marked lightcurve |
|---|---|---|---|---|---|---|---|
| A | 7703 | 7318 | 5 | 5 | 0.06% | 0.07% | 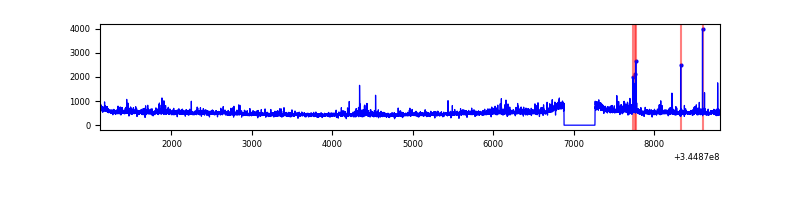 |
| B | 7703 | 7318 | 4 | 4 | 0.05% | 0.05% | 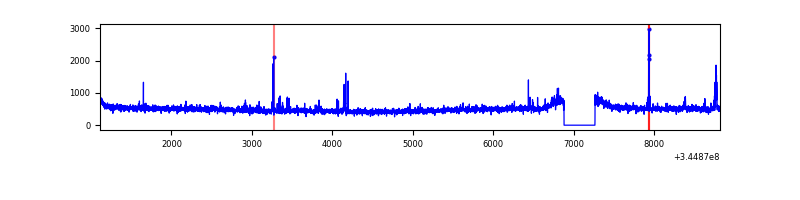 |
| C | 7703 | 7318 | 84 | 84 | 1.09% | 1.15% | 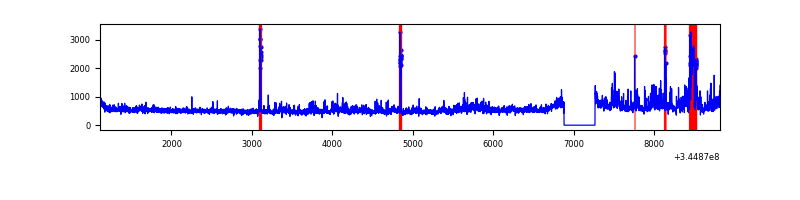 |
| D | 7702 | 7317 | 430 | 430 | 5.58% | 5.88% | 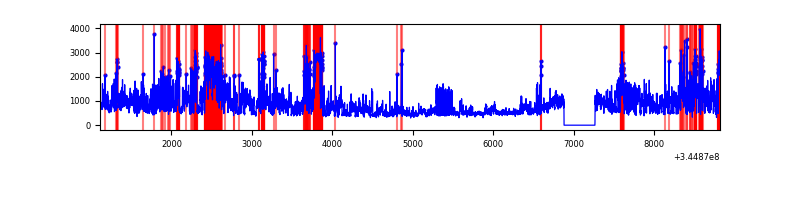 |
Top three noisy pixels from each quadrant. If the there are fewer than three noisy pixels in the level2.evt file, extra rows are filled as -1
| Pixel properties | Quadrant properties | ||||||
|---|---|---|---|---|---|---|---|
| Quadrant | DetID | PixID | Counts | Sigma | Mean | Median | Sigma |
| A | 0 | 13 | 214667 | 1154.34 | 921 | 901 | 185.2 |
| A | 12 | 96 | 61821 | 328.97 | 921 | 901 | 185.2 |
| A | 13 | 254 | 13175 | 66.28 | 921 | 901 | 185.2 |
| B | 4 | 200 | 27647 | 155.69 | 907 | 884 | 171.9 |
| B | 10 | 245 | 21690 | 121.03 | 907 | 884 | 171.9 |
| B | 12 | 111 | 21008 | 117.06 | 907 | 884 | 171.9 |
| C | 3 | 233 | 825203 | 4044.63 | 867 | 869 | 203.8 |
| C | 14 | 238 | 138512 | 675.35 | 867 | 869 | 203.8 |
| C | 13 | 61 | 6076 | 25.55 | 867 | 869 | 203.8 |
| D | 8 | 195 | 2297085 | 11162.65 | 866 | 842 | 205.7 |
| D | 1 | 52 | 645759 | 3135.11 | 866 | 842 | 205.7 |
| D | 2 | 250 | 420952 | 2042.27 | 866 | 842 | 205.7 |
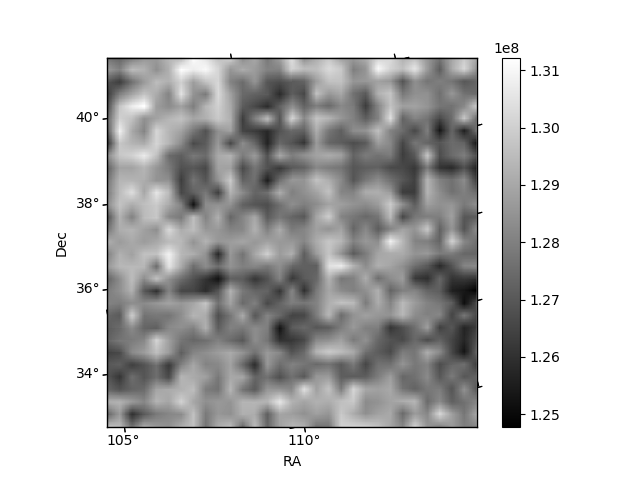
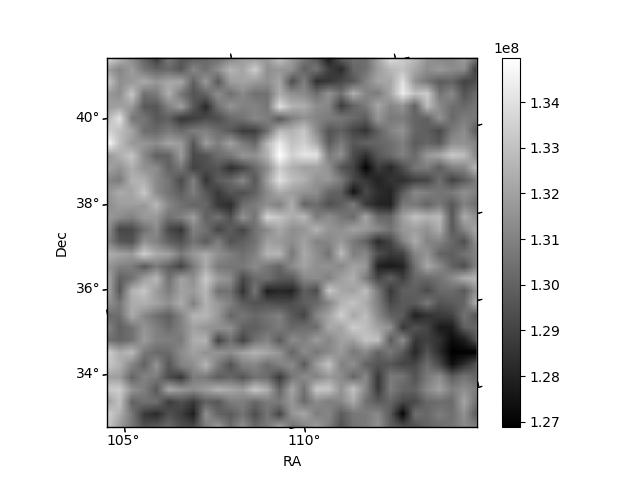
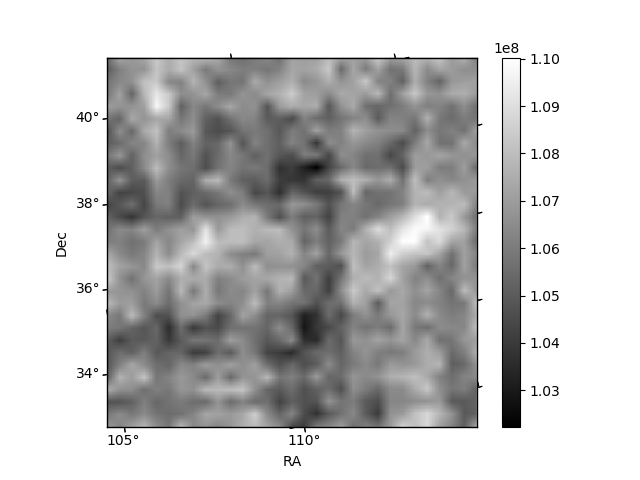
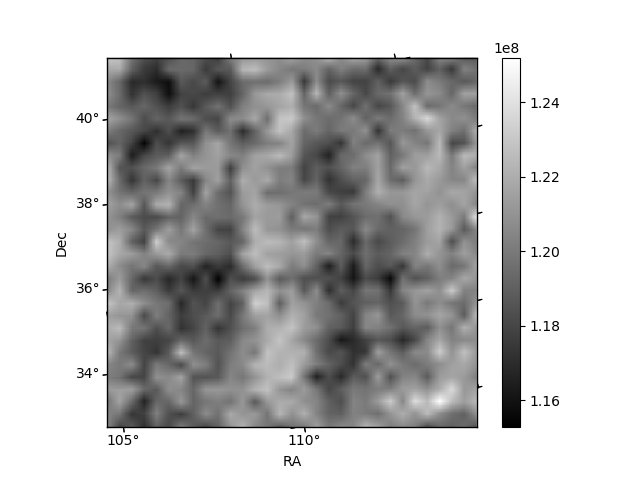
Histogram calculated using DETX and DETY for each event in the final _common_clean file
| Quadrant A | 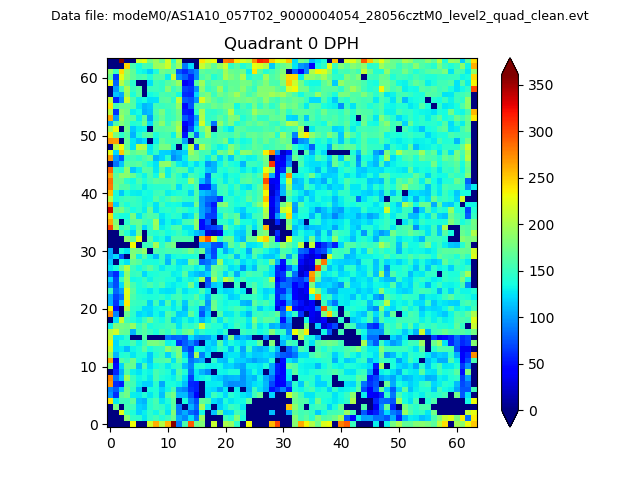 |
 |
Quadrant B |
|---|---|---|---|
| Quadrant D | 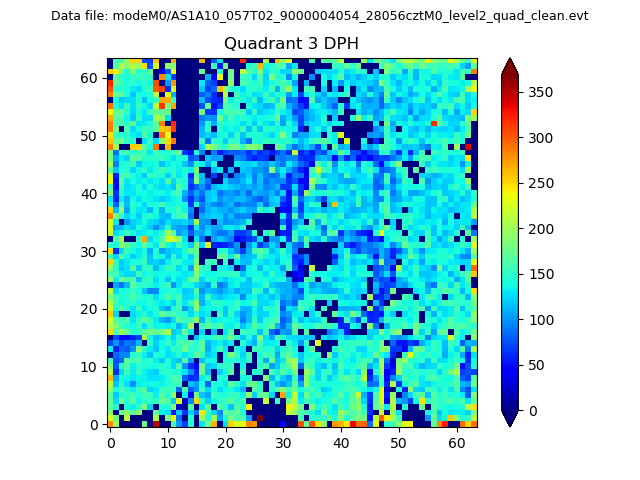 |
 |
Quadrant C |
| Plot type | Count rate plots | Images |
|---|---|---|
| Comparison with Poisson distribution Blue bars denote a histogram of data divided into 1 sec bins. Red curve is a Poisson curve with rate = median count rate of data. |
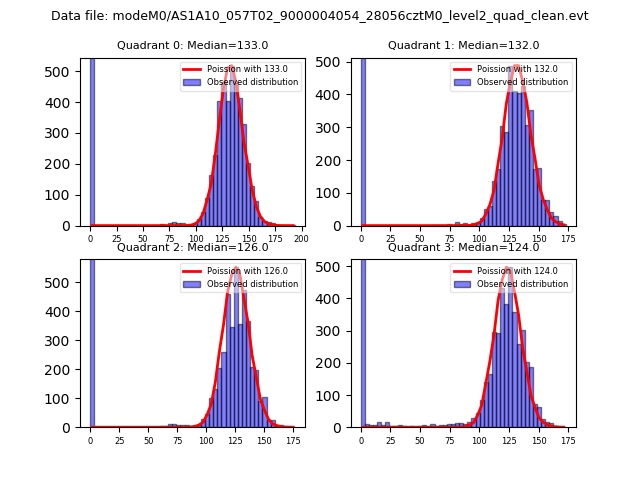 |
 |
| Quadrant-wise count rates Data is divided into 100 sec bins |
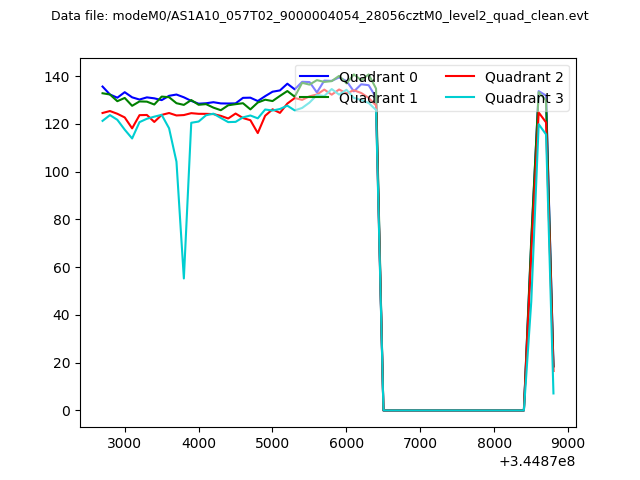 |
|
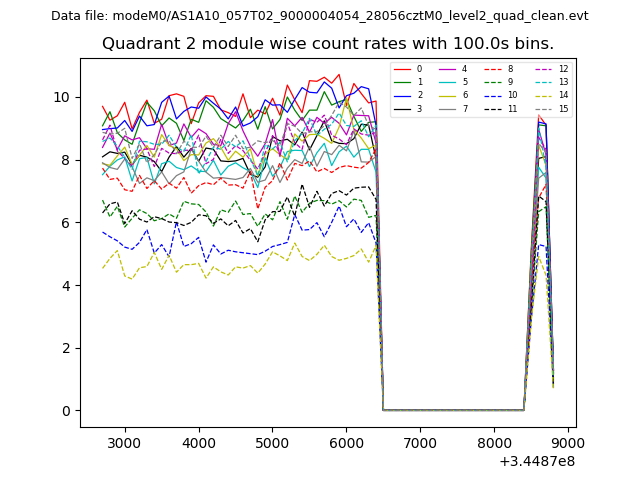
| Module-wise count rates for Quadrant A Data is divided into 100 sec bins |
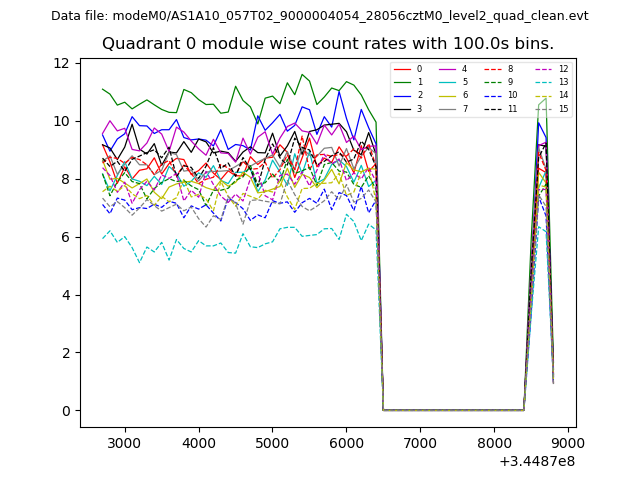 |
 |
| Module-wise count rates for Quadrant B Data is divided into 100 sec bins |
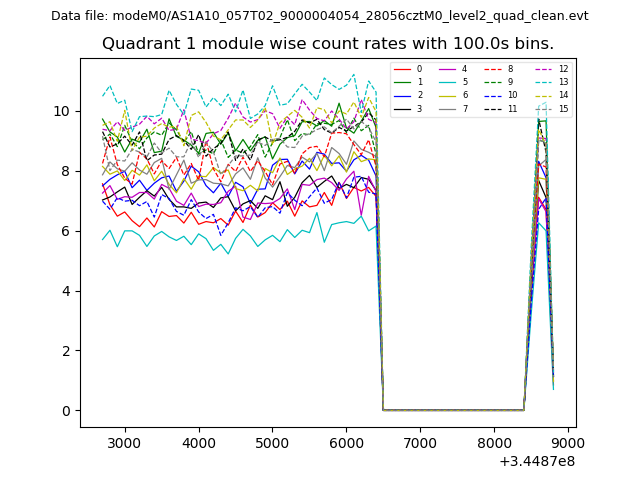 |
 |
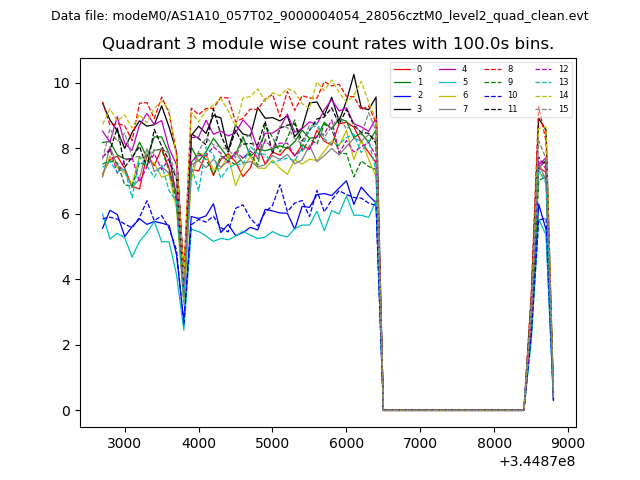
| Module-wise count rates for Quadrant C Data is divided into 100 sec bins |
 |
 |
| Module-wise count rates for Quadrant D Data is divided into 100 sec bins |
 |
 |
| Parameter | Plot |
|---|---|
| CZT HV Monitor |  |
| D_VDD | 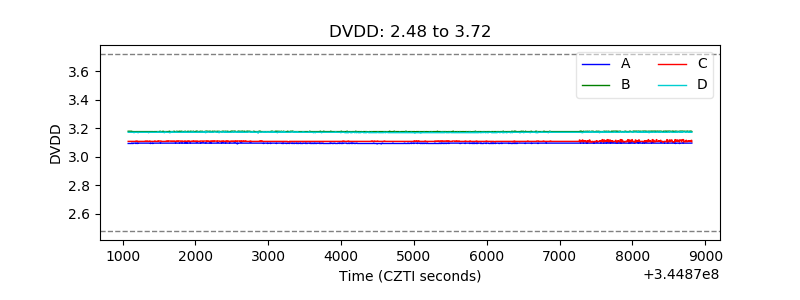 |
| Temperature 1 | 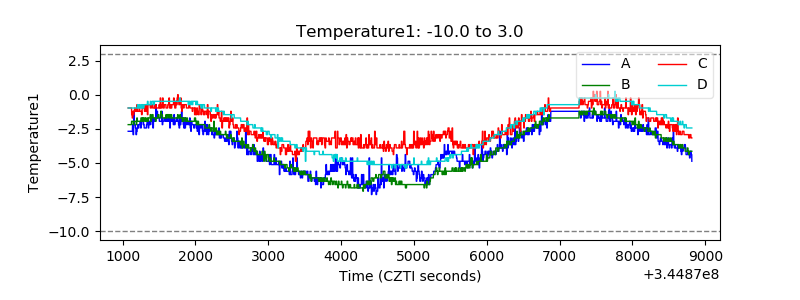 |
| Veto HV Monitor | 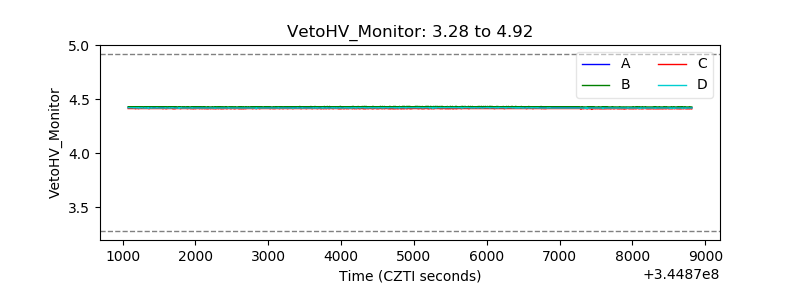 |
| Veto LLD | 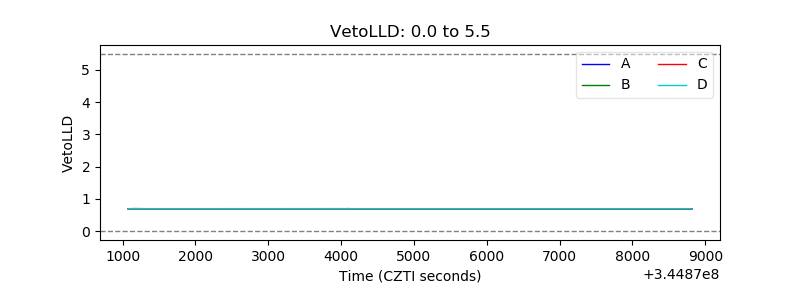 |
| Alpha Counter | 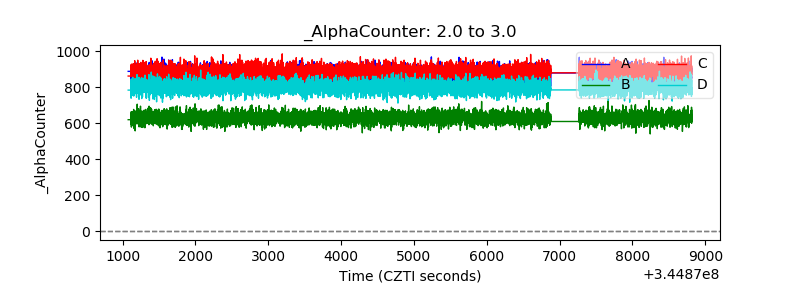 |
| _CPM_Rate | 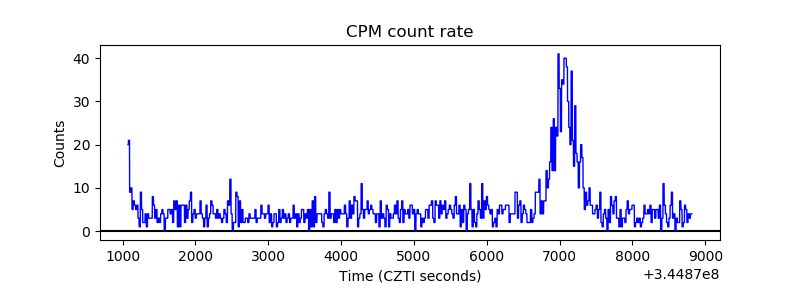 |
| CZT Counter | 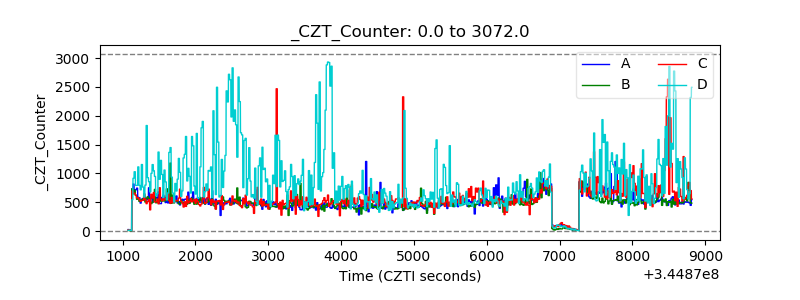 |
| +2.5 Volts monitor |  |
| +5 Volts monitor |  |
| _ROLL_ROT | 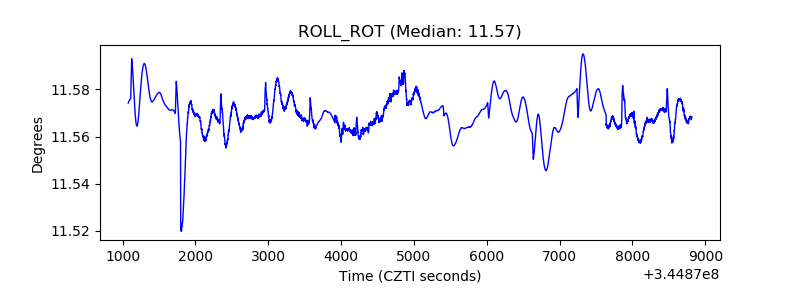 |
| _Roll_DEC | 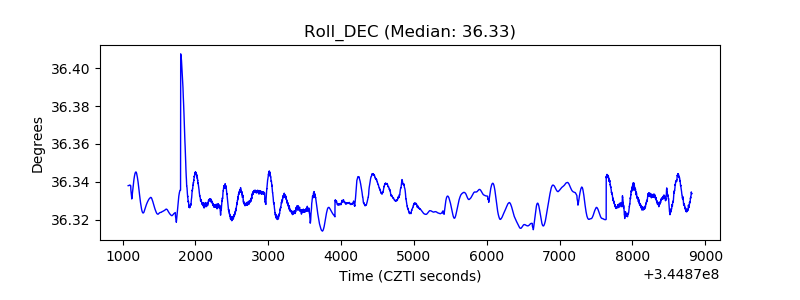 |
| _Roll_RA | 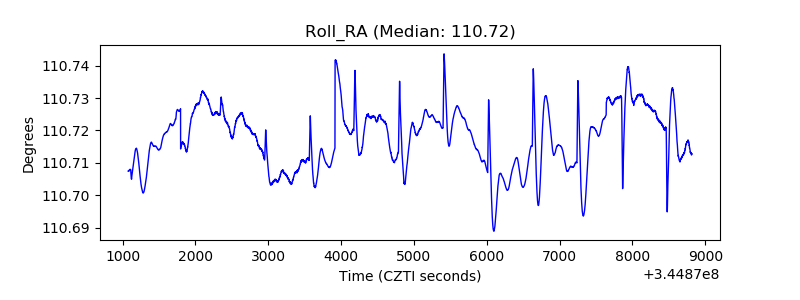 |
| Veto Counter | 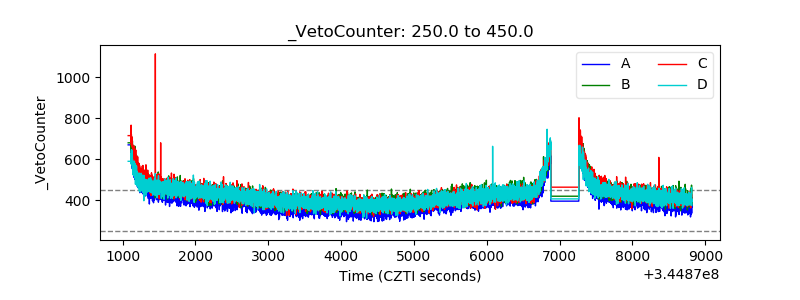 |