| Param | Original file | Final file |
|---|---|---|
| Filename | modeM0/AS1A10_057T02_9000004054_28057cztM0_level2.evt | modeM0/AS1A10_057T02_9000004054_28057cztM0_level2_quad_clean.evt |
| Size (bytes) | 665,484,480 | 93,165,120 |
| Size | 634.7 MB | 88.8 MB |
| Events in quadrant A | 3,956,214 | 593,215 |
| Events in quadrant B | 3,912,064 | 589,529 |
| Events in quadrant C | 4,458,161 | 564,379 |
| Events in quadrant D | 7,303,946 | 535,838 |
| Mode M9 | |||
|---|---|---|---|
| Quadrant | BADHDUFLAG | Total packets | Discarded packets |
| A | 0 | 4 | 0 |
| B | 0 | 5 | 0 |
| C | 0 | 5 | 0 |
| D | 0 | 5 | 0 |
| Mode M0 | |||
|---|---|---|---|
| Quadrant | BADHDUFLAG | Total packets | Discarded packets |
| A | 0 | 16740 | 0 |
| B | 0 | 16636 | 0 |
| C | 0 | 18396 | 0 |
| D | 0 | 27122 | 0 |
| Quadrant | Total seconds | Saturated seconds | Saturation percentage |
|---|---|---|---|
| A | 7735 | 118 | 1.525533% |
| B | 7735 | 168 | 2.171946% |
| C | 7735 | 299 | 3.865546% |
| D | 7735 | 617 | 7.976729% |
Noise dominated data is calculated using 1-second bins in cleaned event files. If a bin has >2000 counts, and if more than 50% of those come from <1% of pixels, then it is considered to be noise-dominated and hence unusable.
| Quadrant | # 1 sec bins | Bins with >0 counts | Bins with >2000 counts | High rate bins dominated by noise | Noise dominated (total time) | Noise dominated (detector-on time) | Marked lightcurve |
|---|---|---|---|---|---|---|---|
| A | 7930 | 7736 | 6 | 6 | 0.08% | 0.08% | 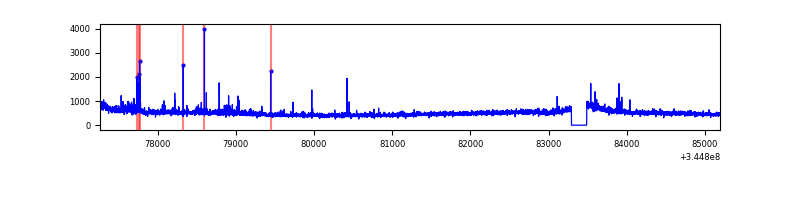 |
| B | 7930 | 7736 | 4 | 4 | 0.05% | 0.05% | 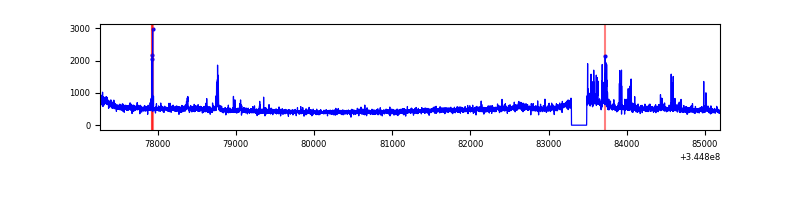 |
| C | 7930 | 7736 | 62 | 62 | 0.78% | 0.80% | 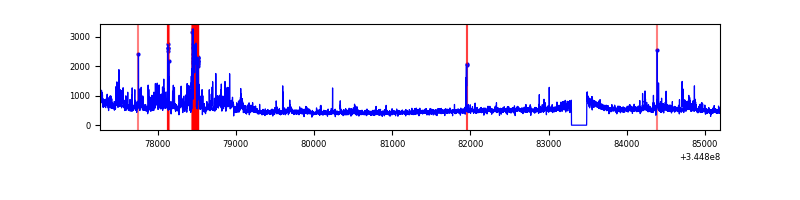 |
| D | 7930 | 7735 | 340 | 340 | 4.29% | 4.40% | 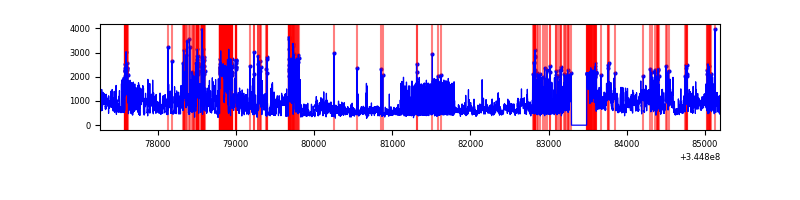 |
Top three noisy pixels from each quadrant. If the there are fewer than three noisy pixels in the level2.evt file, extra rows are filled as -1
| Pixel properties | Quadrant properties | ||||||
|---|---|---|---|---|---|---|---|
| Quadrant | DetID | PixID | Counts | Sigma | Mean | Median | Sigma |
| A | 0 | 13 | 123171 | 625.41 | 965 | 946 | 195.4 |
| A | 12 | 96 | 98966 | 501.56 | 965 | 946 | 195.4 |
| A | 13 | 254 | 14098 | 67.3 | 965 | 946 | 195.4 |
| B | 15 | 32 | 66133 | 360.2 | 951 | 926 | 181.0 |
| B | 4 | 52 | 38260 | 206.23 | 951 | 926 | 181.0 |
| B | 12 | 111 | 22287 | 118.0 | 951 | 926 | 181.0 |
| C | 3 | 233 | 743130 | 3472.38 | 911 | 915 | 213.7 |
| C | 14 | 238 | 144975 | 673.97 | 911 | 915 | 213.7 |
| C | 8 | 128 | 11241 | 48.31 | 911 | 915 | 213.7 |
| D | 8 | 195 | 2653446 | 12203.31 | 899 | 874 | 217.4 |
| D | 7 | 223 | 500710 | 2299.52 | 899 | 874 | 217.4 |
| D | 1 | 52 | 287627 | 1319.22 | 899 | 874 | 217.4 |
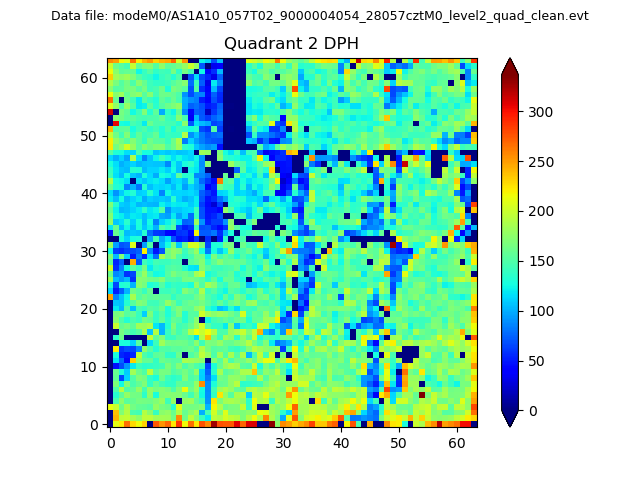
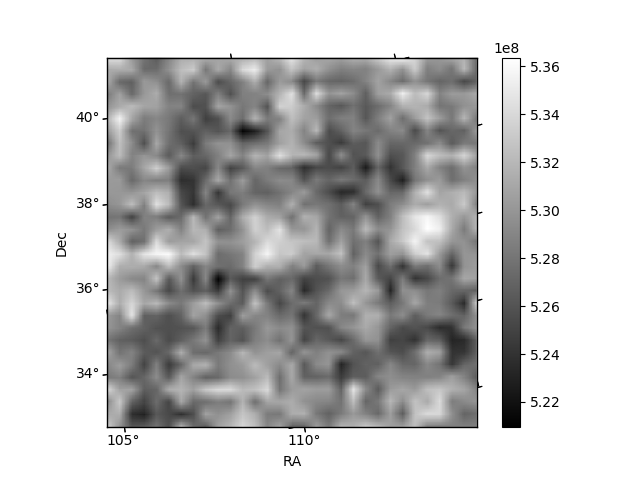
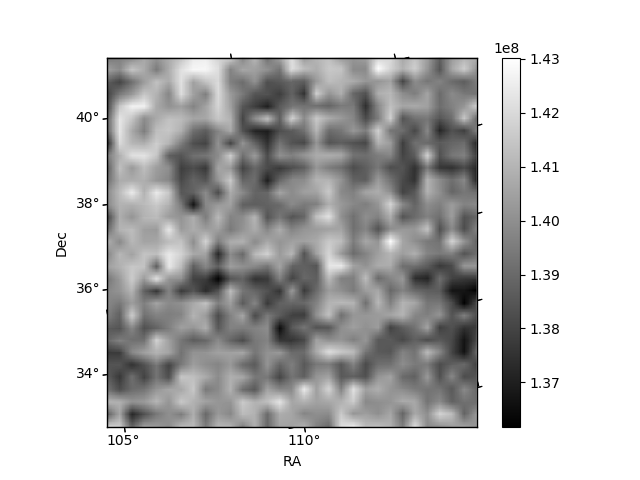
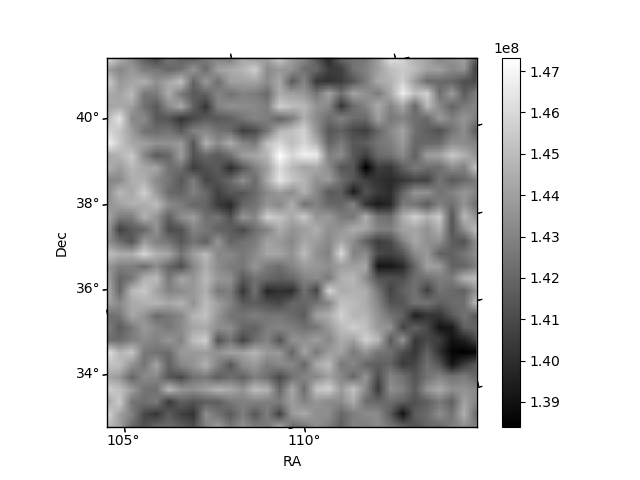
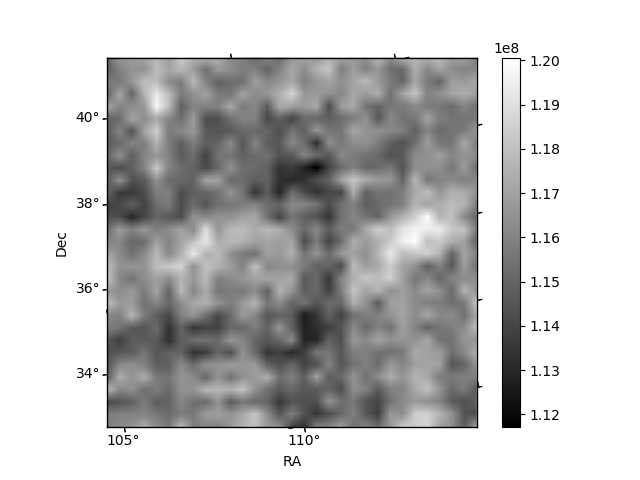
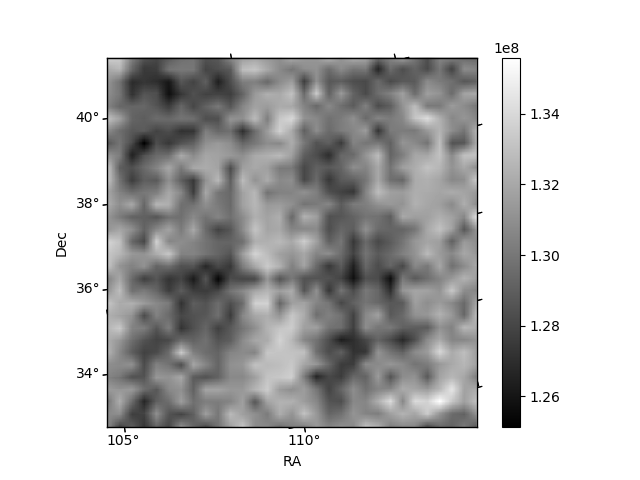
Histogram calculated using DETX and DETY for each event in the final _common_clean file
| Quadrant A | 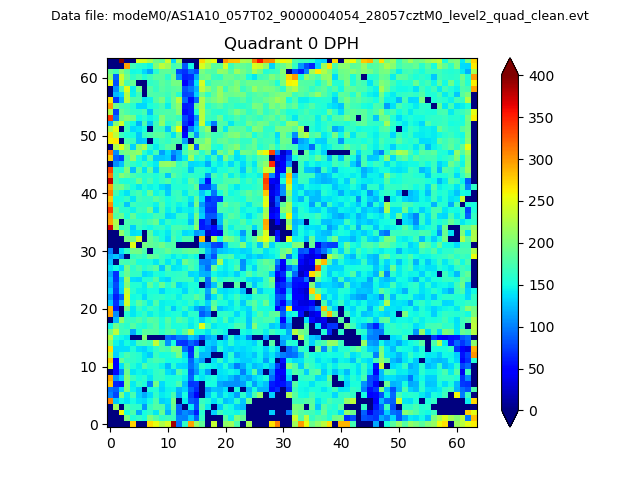 |
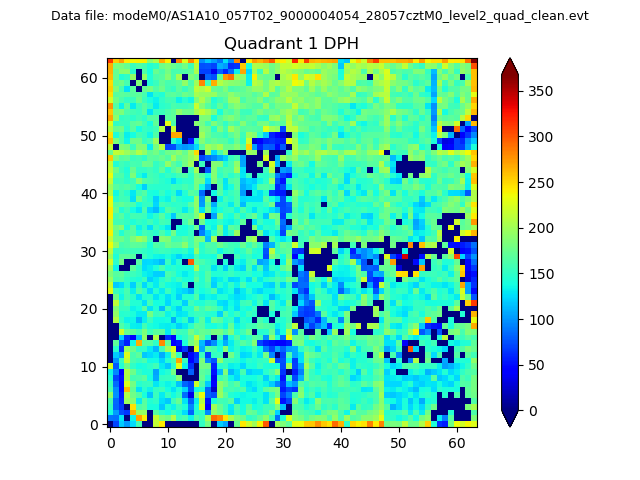 |
Quadrant B |
|---|---|---|---|
| Quadrant D | 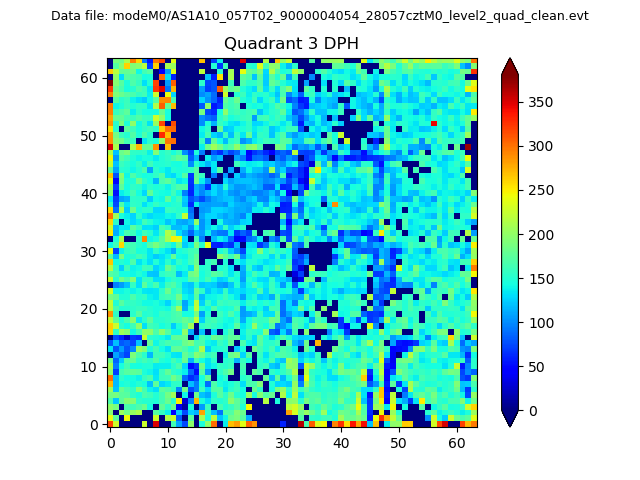 |
 |
Quadrant C |
| Plot type | Count rate plots | Images |
|---|---|---|
| Comparison with Poisson distribution Blue bars denote a histogram of data divided into 1 sec bins. Red curve is a Poisson curve with rate = median count rate of data. |
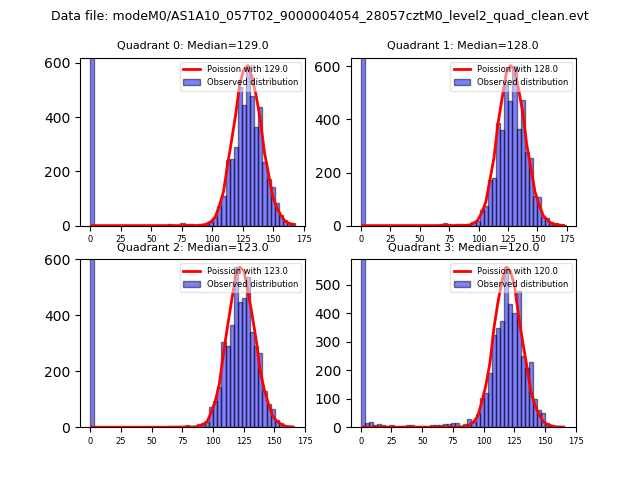 |
 |
| Quadrant-wise count rates Data is divided into 100 sec bins |
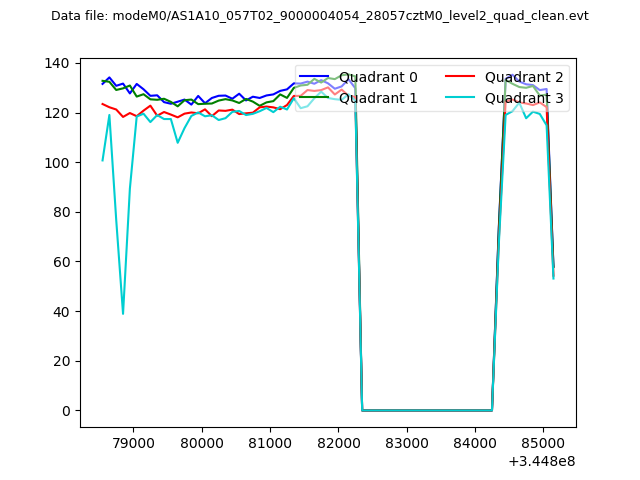 |
|
| Module-wise count rates for Quadrant A Data is divided into 100 sec bins |
 |
 |
| Module-wise count rates for Quadrant B Data is divided into 100 sec bins |
 |
 |
| Module-wise count rates for Quadrant C Data is divided into 100 sec bins |
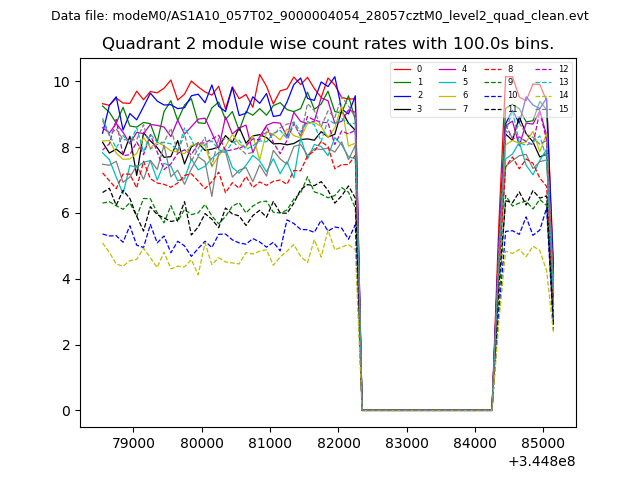 |
 |
| Module-wise count rates for Quadrant D Data is divided into 100 sec bins |
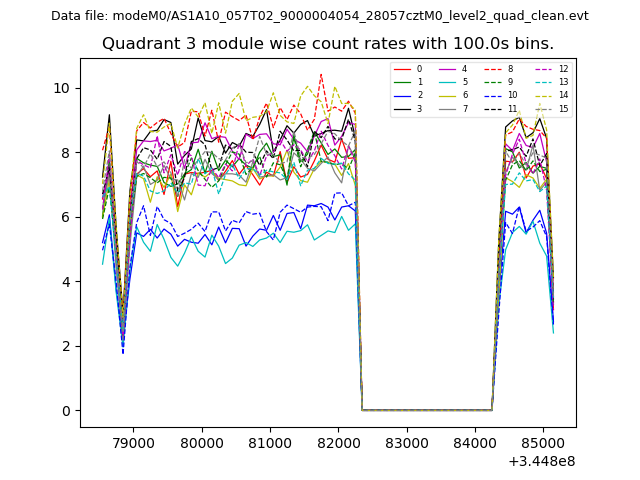 |
 |
| Parameter | Plot |
|---|---|
| CZT HV Monitor | 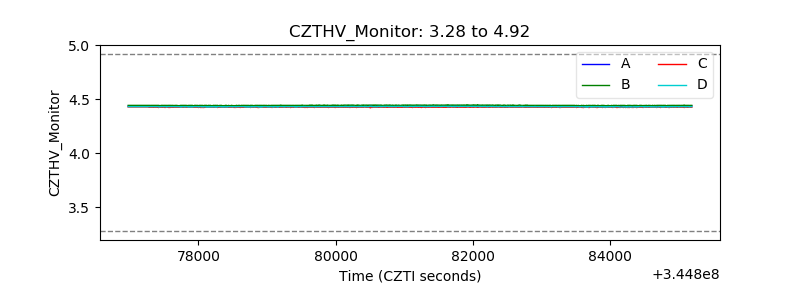 |
| D_VDD | 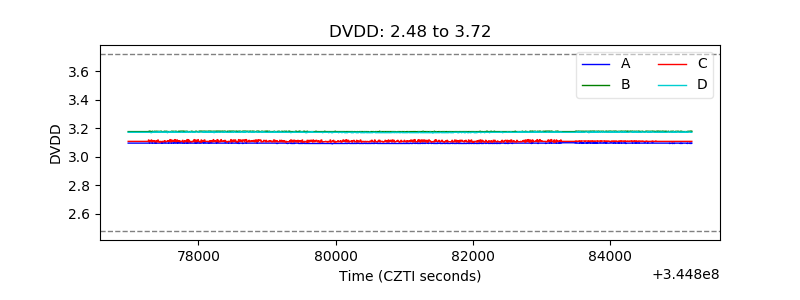 |
| Temperature 1 | 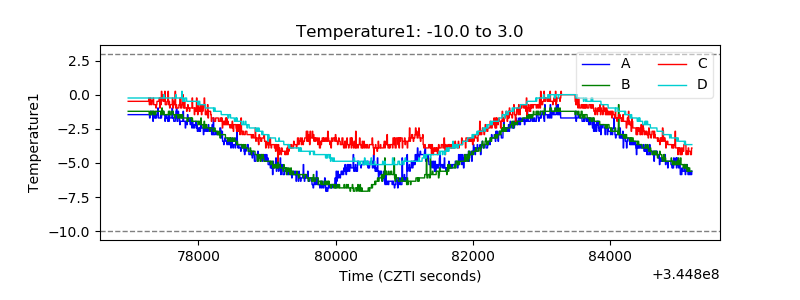 |
| Veto HV Monitor |  |
| Veto LLD |  |
| Alpha Counter |  |
| _CPM_Rate | 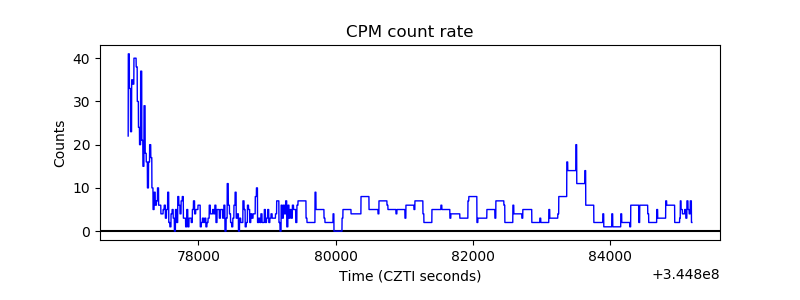 |
| CZT Counter | 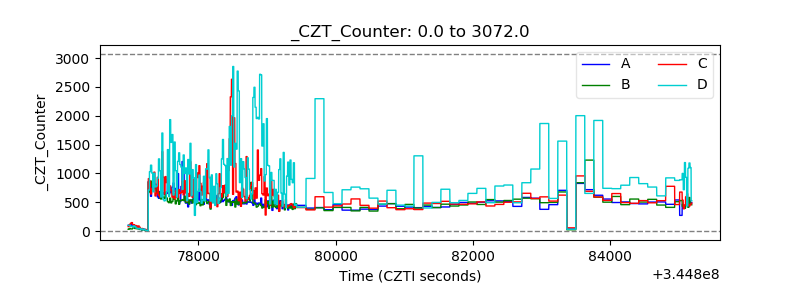 |
| +2.5 Volts monitor | 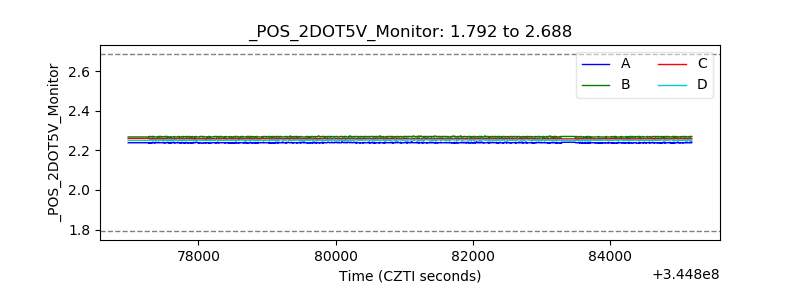 |
| +5 Volts monitor |  |
| _ROLL_ROT | 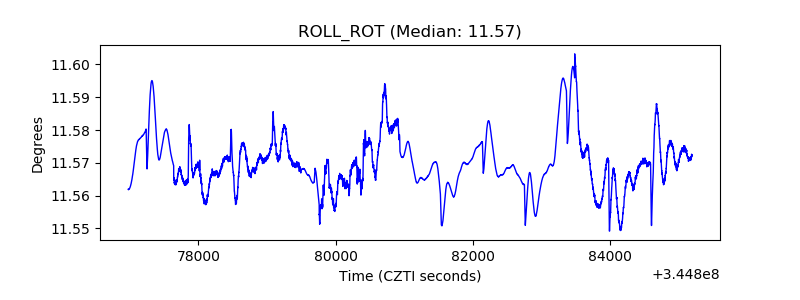 |
| _Roll_DEC | 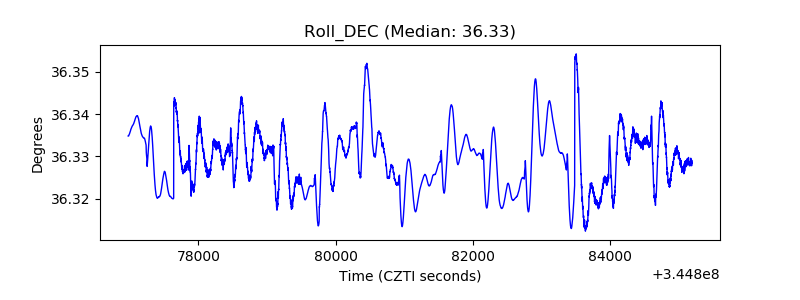 |
| _Roll_RA | 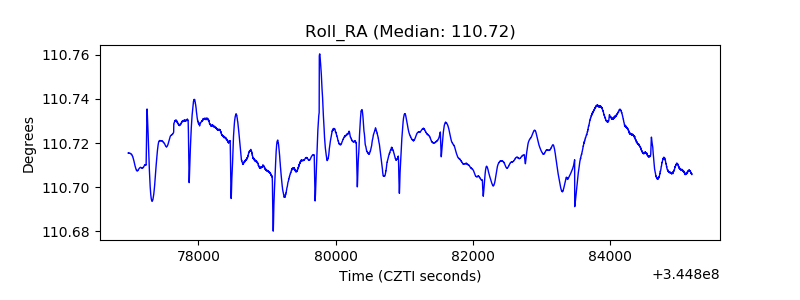 |
| Veto Counter |  |