| Param | Original file | Final file |
|---|---|---|
| Filename | modeM0/AS1A10_057T02_9000004054_28058cztM0_level2.evt | modeM0/AS1A10_057T02_9000004054_28058cztM0_level2_quad_clean.evt |
| Size (bytes) | 700,698,240 | 100,820,160 |
| Size | 668.2 MB | 96.1 MB |
| Events in quadrant A | 4,037,605 | 641,970 |
| Events in quadrant B | 4,337,269 | 635,279 |
| Events in quadrant C | 4,474,236 | 612,880 |
| Events in quadrant D | 7,819,064 | 595,387 |
| Mode M9 | |||
|---|---|---|---|
| Quadrant | BADHDUFLAG | Total packets | Discarded packets |
| A | 0 | 5 | 0 |
| B | 0 | 5 | 0 |
| C | 0 | 5 | 0 |
| D | 0 | 5 | 0 |
| Mode M0 | |||
|---|---|---|---|
| Quadrant | BADHDUFLAG | Total packets | Discarded packets |
| A | 0 | 17315 | 0 |
| B | 0 | 18323 | 0 |
| C | 0 | 18520 | 0 |
| D | 0 | 29005 | 0 |
| Quadrant | Total seconds | Saturated seconds | Saturation percentage |
|---|---|---|---|
| A | 8165 | 125 | 1.530925% |
| B | 8166 | 262 | 3.208425% |
| C | 8166 | 256 | 3.134950% |
| D | 8165 | 604 | 7.397428% |
Noise dominated data is calculated using 1-second bins in cleaned event files. If a bin has >2000 counts, and if more than 50% of those come from <1% of pixels, then it is considered to be noise-dominated and hence unusable.
| Quadrant | # 1 sec bins | Bins with >0 counts | Bins with >2000 counts | High rate bins dominated by noise | Noise dominated (total time) | Noise dominated (detector-on time) | Marked lightcurve |
|---|---|---|---|---|---|---|---|
| A | 8670 | 8166 | 3 | 3 | 0.03% | 0.04% | 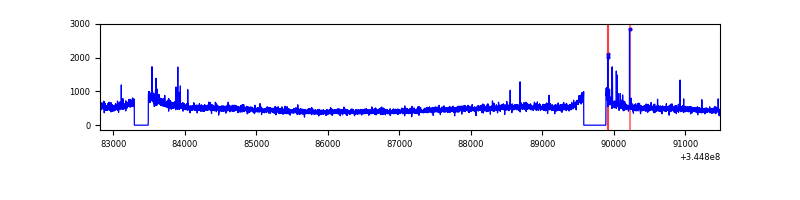 |
| B | 8671 | 8167 | 56 | 56 | 0.65% | 0.69% | 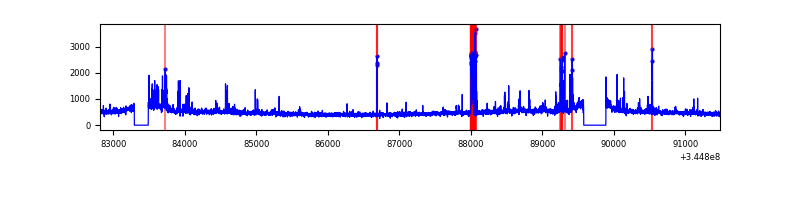 |
| C | 8671 | 8167 | 3 | 3 | 0.03% | 0.04% | 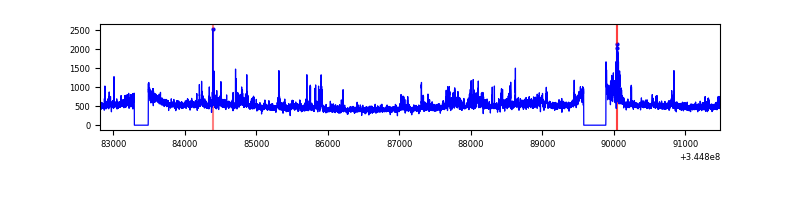 |
| D | 8670 | 8165 | 350 | 350 | 4.04% | 4.29% | 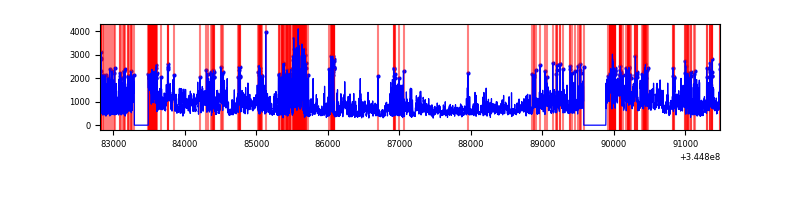 |
Top three noisy pixels from each quadrant. If the there are fewer than three noisy pixels in the level2.evt file, extra rows are filled as -1
| Pixel properties | Quadrant properties | ||||||
|---|---|---|---|---|---|---|---|
| Quadrant | DetID | PixID | Counts | Sigma | Mean | Median | Sigma |
| A | 0 | 13 | 69671 | 329.84 | 1019 | 998 | 208.2 |
| A | 13 | 248 | 20394 | 93.16 | 1019 | 998 | 208.2 |
| A | 12 | 96 | 14307 | 63.92 | 1019 | 998 | 208.2 |
| B | 10 | 245 | 208428 | 1073.01 | 1001 | 973 | 193.3 |
| B | 15 | 32 | 67087 | 341.96 | 1001 | 973 | 193.3 |
| B | 4 | 52 | 41007 | 207.07 | 1001 | 973 | 193.3 |
| C | 3 | 233 | 541117 | 2371.9 | 969 | 974 | 227.7 |
| C | 14 | 238 | 153843 | 671.29 | 969 | 974 | 227.7 |
| C | 13 | 61 | 6803 | 25.6 | 969 | 974 | 227.7 |
| D | 8 | 195 | 2646410 | 11391.96 | 962 | 934 | 232.2 |
| D | 1 | 52 | 501183 | 2154.17 | 962 | 934 | 232.2 |
| D | 7 | 223 | 428042 | 1839.21 | 962 | 934 | 232.2 |
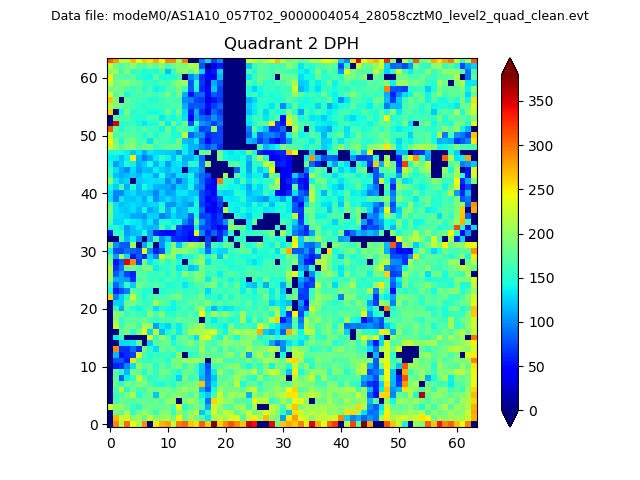
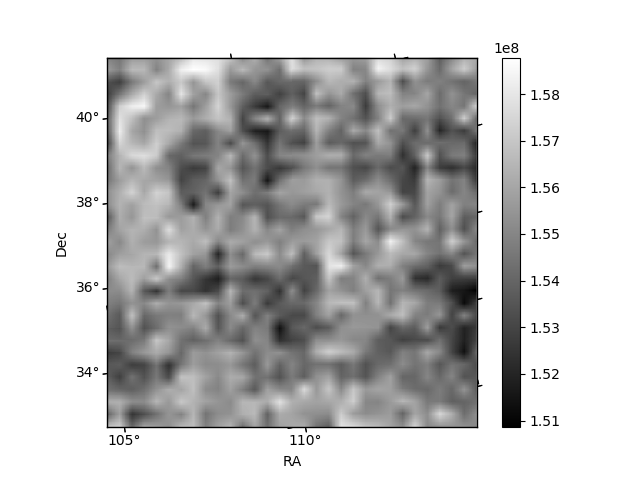
Histogram calculated using DETX and DETY for each event in the final _common_clean file
| Quadrant A |  |
 |
Quadrant B |
|---|---|---|---|
| Quadrant D | 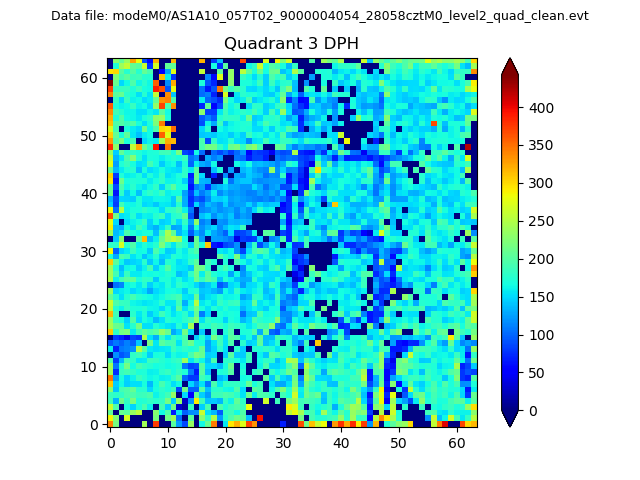 |
 |
Quadrant C |
| Plot type | Count rate plots | Images |
|---|---|---|
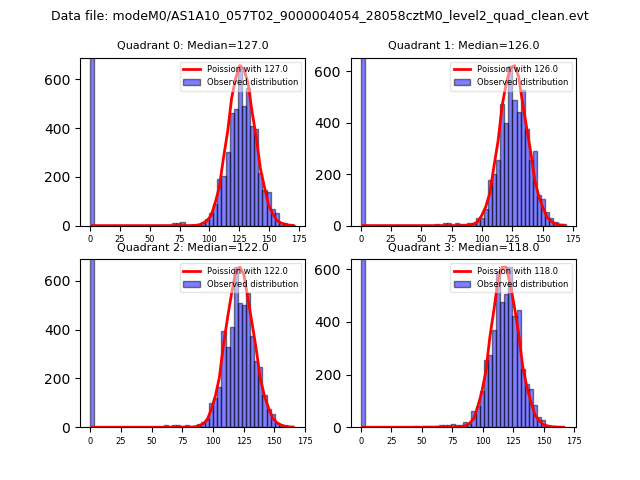
| Comparison with Poisson distribution Blue bars denote a histogram of data divided into 1 sec bins. Red curve is a Poisson curve with rate = median count rate of data. |
 |
 |
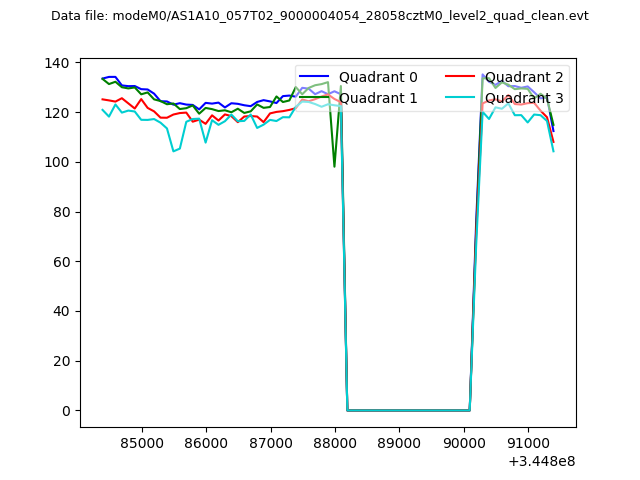
| Quadrant-wise count rates Data is divided into 100 sec bins |
 |
|
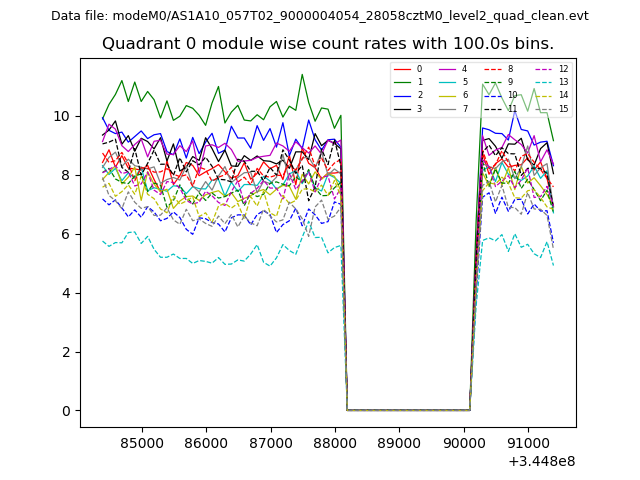
| Module-wise count rates for Quadrant A Data is divided into 100 sec bins |
 |
 |
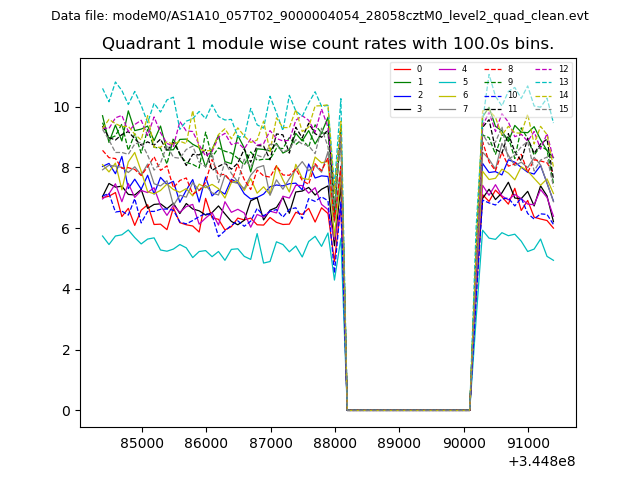
| Module-wise count rates for Quadrant B Data is divided into 100 sec bins |
 |
 |
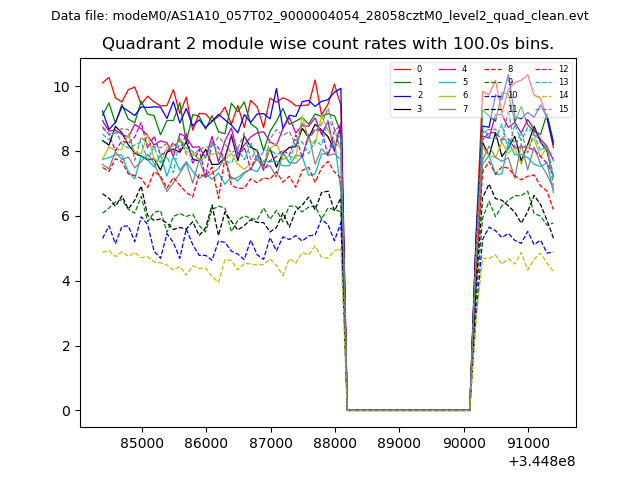
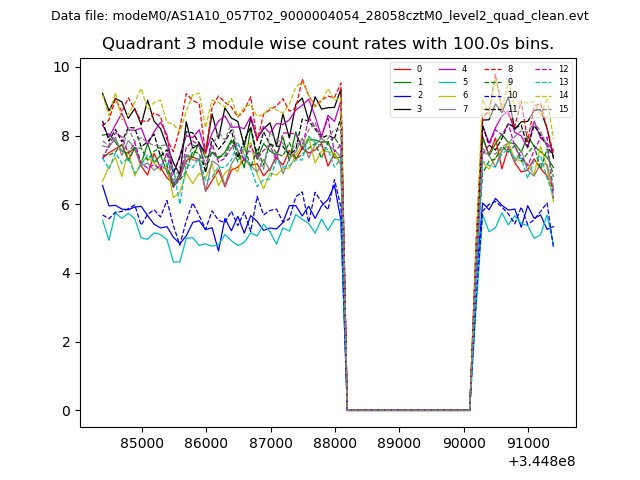
| Module-wise count rates for Quadrant C Data is divided into 100 sec bins |
 |
 |
| Module-wise count rates for Quadrant D Data is divided into 100 sec bins |
 |
 |
| Parameter | Plot |
|---|---|
| CZT HV Monitor |  |
| D_VDD | 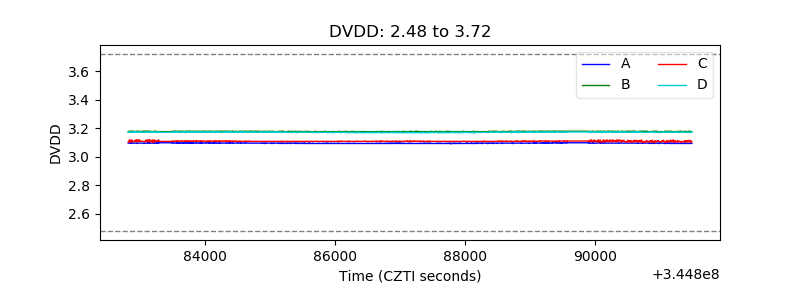 |
| Temperature 1 | 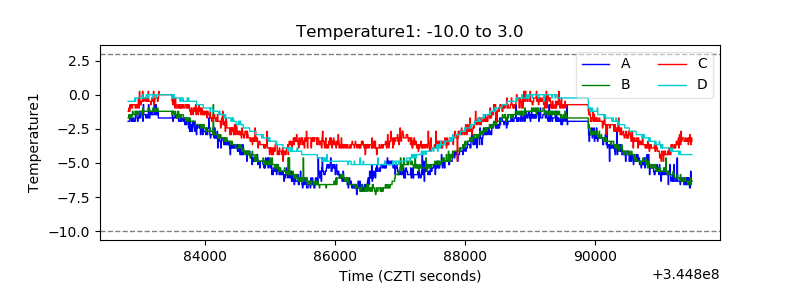 |
| Veto HV Monitor | 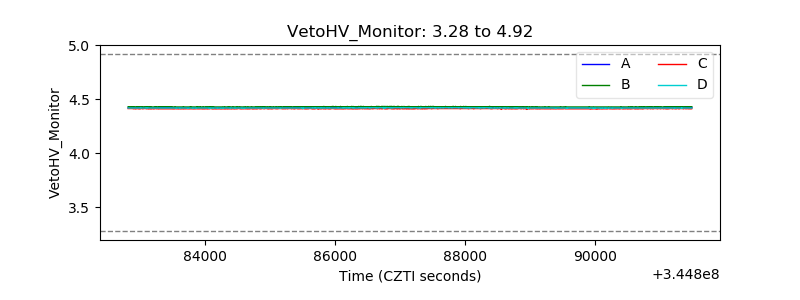 |
| Veto LLD | 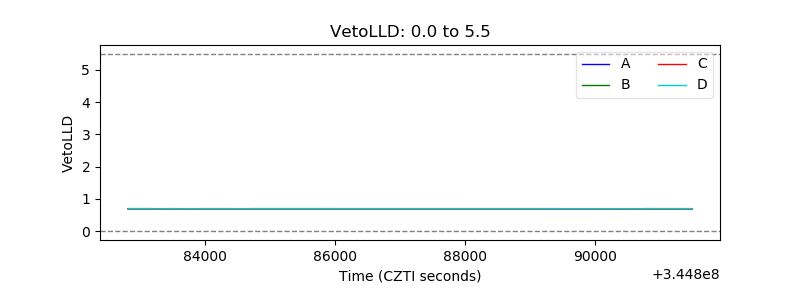 |
| Alpha Counter | 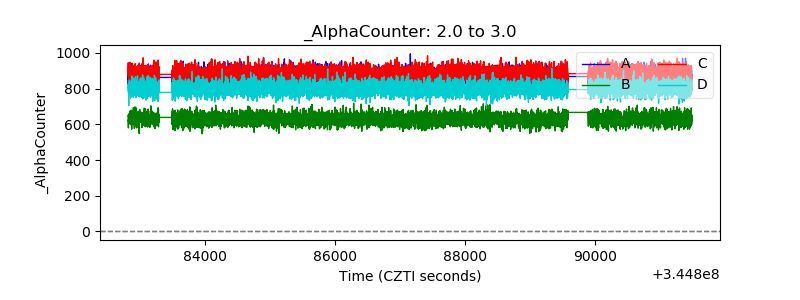 |
| _CPM_Rate | 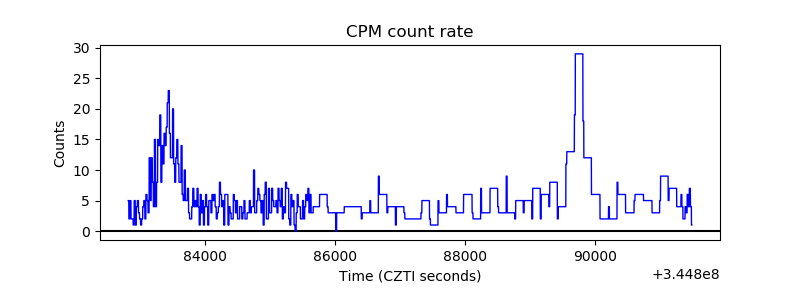 |
| CZT Counter | 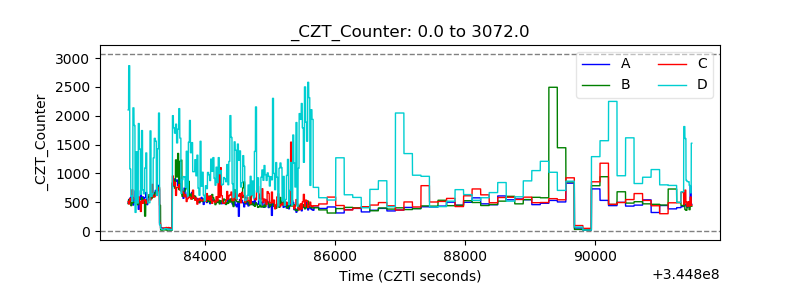 |
| +2.5 Volts monitor |  |
| +5 Volts monitor | 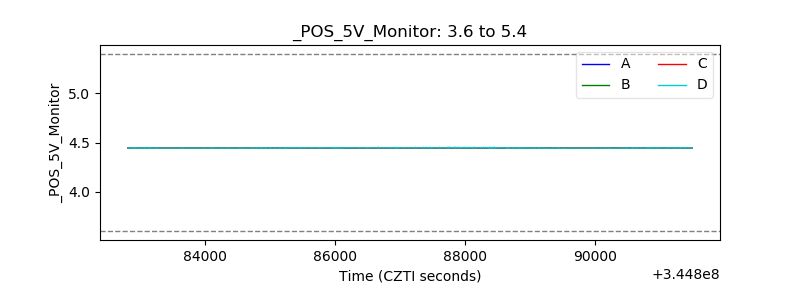 |
| _ROLL_ROT | 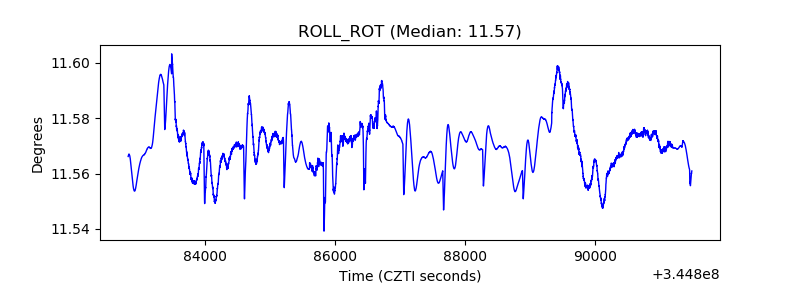 |
| _Roll_DEC | 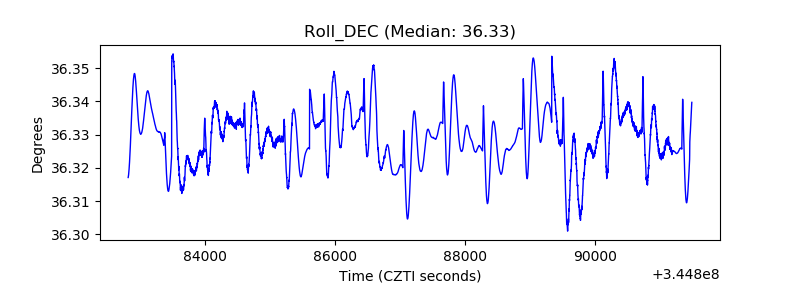 |
| _Roll_RA | 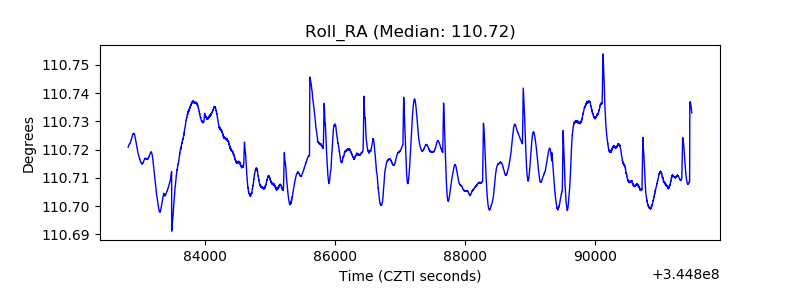 |
| Veto Counter | 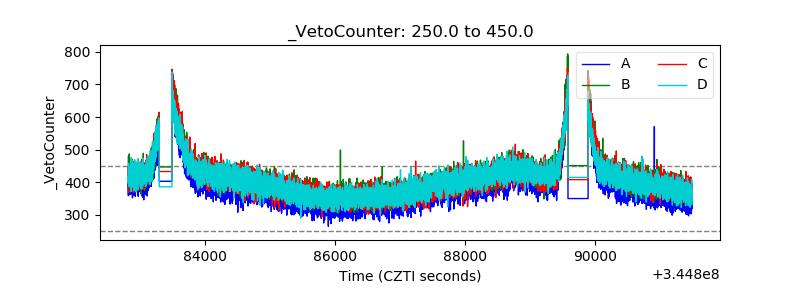 |