| Param | Original file | Final file |
|---|---|---|
| Filename | modeM0/AS1A10_057T02_9000004054_28060cztM0_level2.evt | modeM0/AS1A10_057T02_9000004054_28060cztM0_level2_quad_clean.evt |
| Size (bytes) | 160,842,240 | 30,951,360 |
| Size | 153.4 MB | 29.5 MB |
| Events in quadrant A | 850,945 | 210,270 |
| Events in quadrant B | 877,684 | 208,905 |
| Events in quadrant C | 942,936 | 198,713 |
| Events in quadrant D | 2,074,560 | 186,789 |
| Mode M0 | |||
|---|---|---|---|
| Quadrant | BADHDUFLAG | Total packets | Discarded packets |
| A | 0 | 3690 | 0 |
| B | 0 | 3777 | 0 |
| C | 0 | 3891 | 0 |
| D | 0 | 7426 | 0 |
| Quadrant | Total seconds | Saturated seconds | Saturation percentage |
|---|---|---|---|
| A | 1806 | 3 | 0.166113% |
| B | 1807 | 5 | 0.276702% |
| C | 1806 | 11 | 0.609081% |
| D | 1806 | 153 | 8.471761% |
Noise dominated data is calculated using 1-second bins in cleaned event files. If a bin has >2000 counts, and if more than 50% of those come from <1% of pixels, then it is considered to be noise-dominated and hence unusable.
| Quadrant | # 1 sec bins | Bins with >0 counts | Bins with >2000 counts | High rate bins dominated by noise | Noise dominated (total time) | Noise dominated (detector-on time) | Marked lightcurve |
|---|---|---|---|---|---|---|---|
| A | 1806 | 1806 | 1 | 1 | 0.06% | 0.06% | 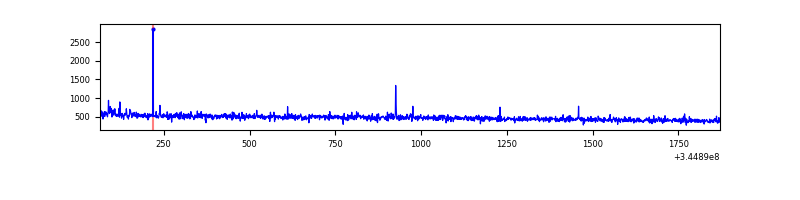 |
| B | 1807 | 1807 | 2 | 2 | 0.11% | 0.11% | 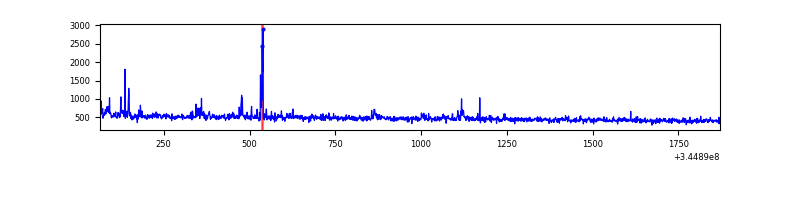 |
| C | 1806 | 1806 | 1 | 1 | 0.06% | 0.06% | 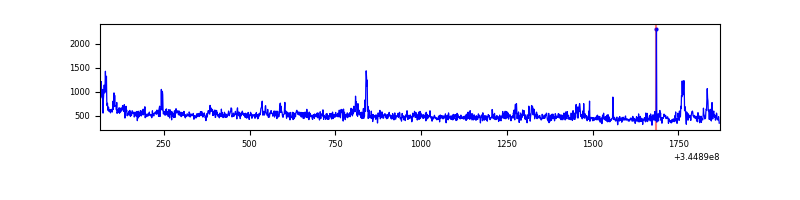 |
| D | 1806 | 1806 | 150 | 150 | 8.31% | 8.31% | 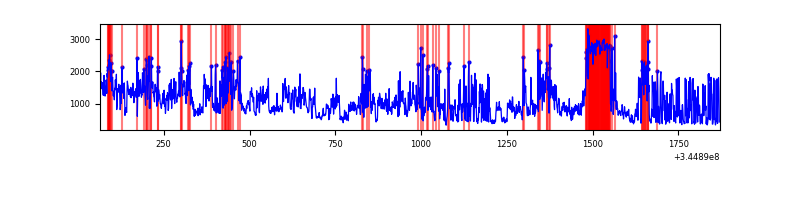 |
Top three noisy pixels from each quadrant. If the there are fewer than three noisy pixels in the level2.evt file, extra rows are filled as -1
| Pixel properties | Quadrant properties | ||||||
|---|---|---|---|---|---|---|---|
| Quadrant | DetID | PixID | Counts | Sigma | Mean | Median | Sigma |
| A | 0 | 13 | 19901 | 432.64 | 213 | 208 | 45.5 |
| A | 13 | 248 | 6707 | 142.78 | 213 | 208 | 45.5 |
| A | 13 | 254 | 3203 | 65.8 | 213 | 208 | 45.5 |
| B | 10 | 245 | 11333 | 254.59 | 213 | 207 | 43.7 |
| B | 4 | 200 | 11052 | 248.16 | 213 | 207 | 43.7 |
| B | 4 | 52 | 7563 | 168.32 | 213 | 207 | 43.7 |
| C | 3 | 233 | 95771 | 1880.36 | 207 | 208 | 50.8 |
| C | 14 | 238 | 33138 | 647.95 | 207 | 208 | 50.8 |
| C | 8 | 128 | 3433 | 63.46 | 207 | 208 | 50.8 |
| D | 8 | 195 | 715599 | 14189.83 | 201 | 195 | 50.4 |
| D | 2 | 250 | 271052 | 5372.37 | 201 | 195 | 50.4 |
| D | 7 | 223 | 159882 | 3167.35 | 201 | 195 | 50.4 |
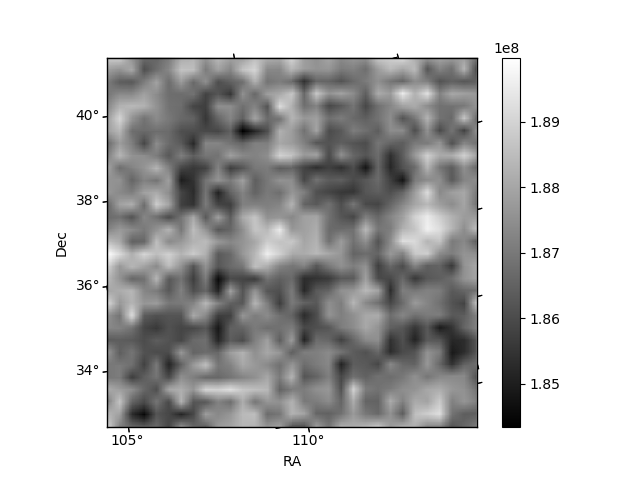
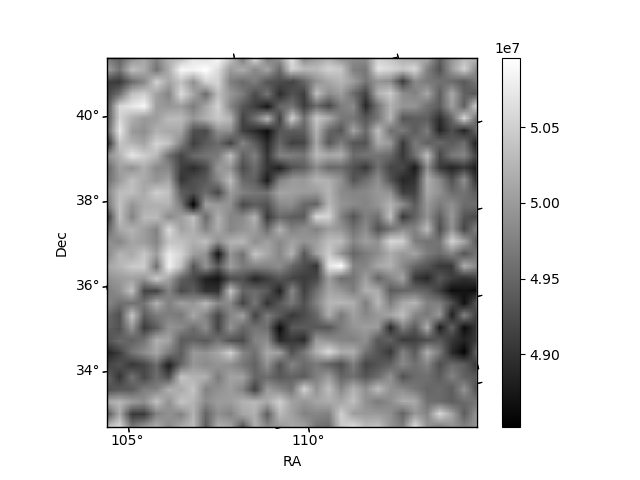
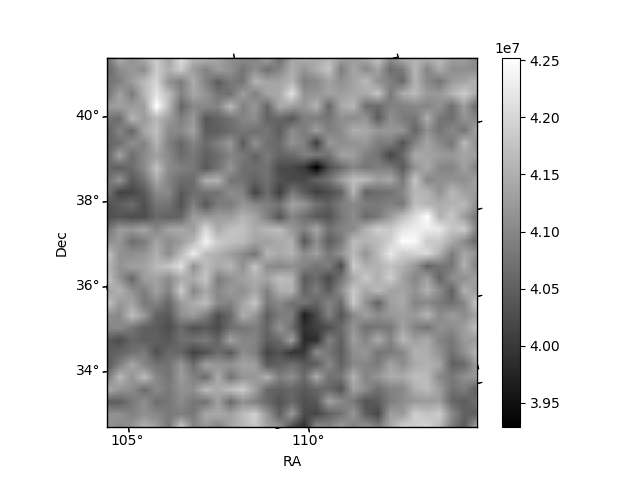
Histogram calculated using DETX and DETY for each event in the final _common_clean file
| Quadrant A | 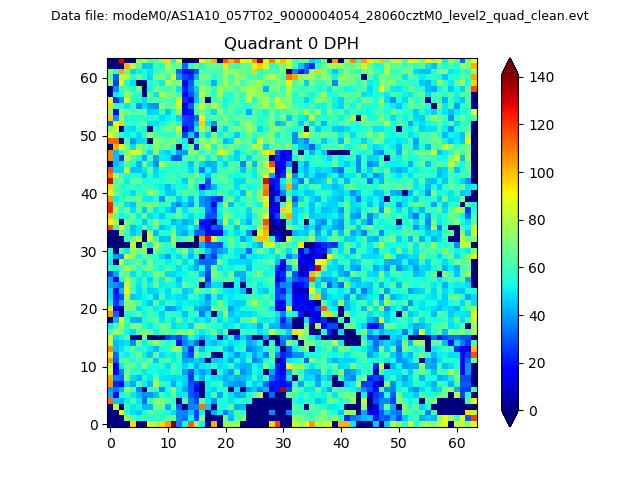 |
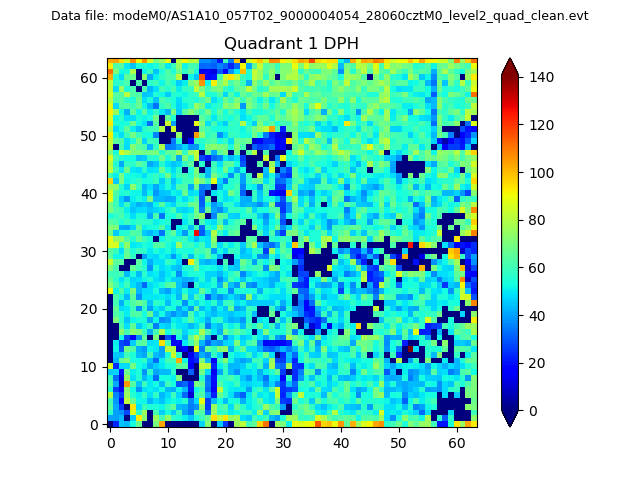 |
Quadrant B |
|---|---|---|---|
| Quadrant D |  |
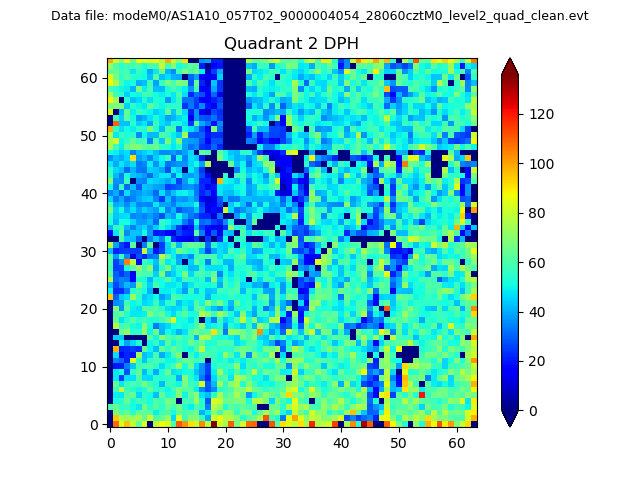 |
Quadrant C |
| Plot type | Count rate plots | Images |
|---|---|---|
| Comparison with Poisson distribution Blue bars denote a histogram of data divided into 1 sec bins. Red curve is a Poisson curve with rate = median count rate of data. |
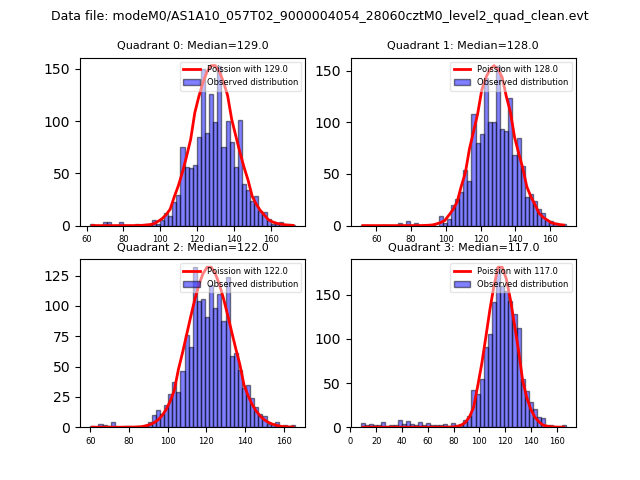 |
 |
| Quadrant-wise count rates Data is divided into 100 sec bins |
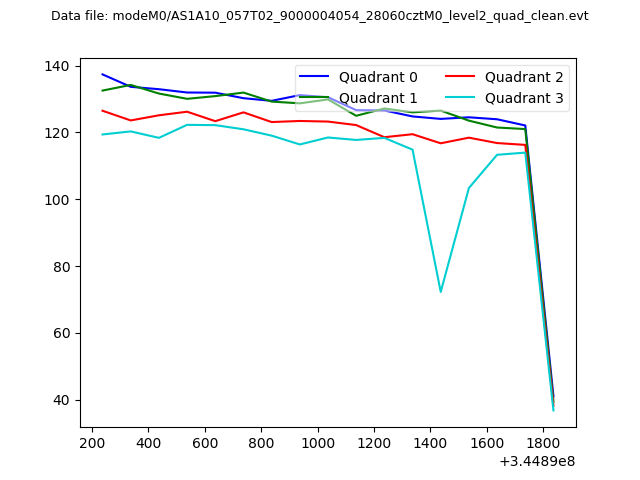 |
|
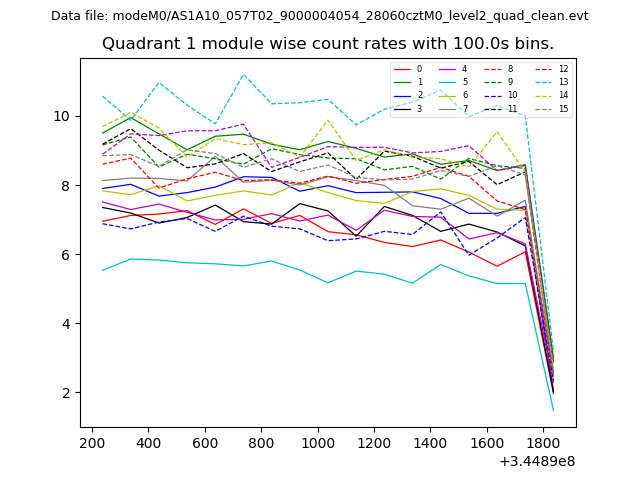
| Module-wise count rates for Quadrant A Data is divided into 100 sec bins |
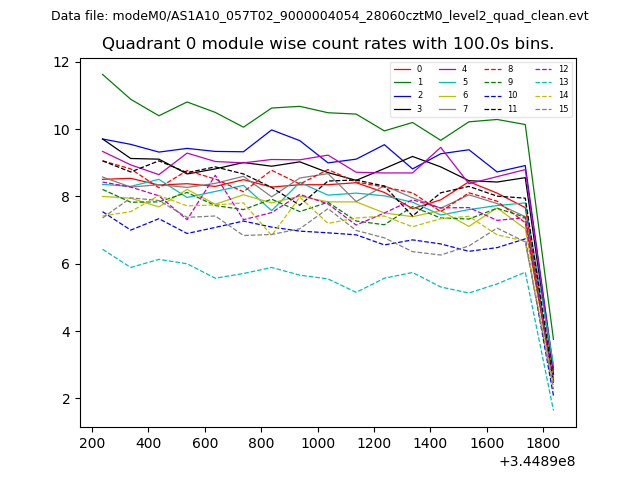 |
 |
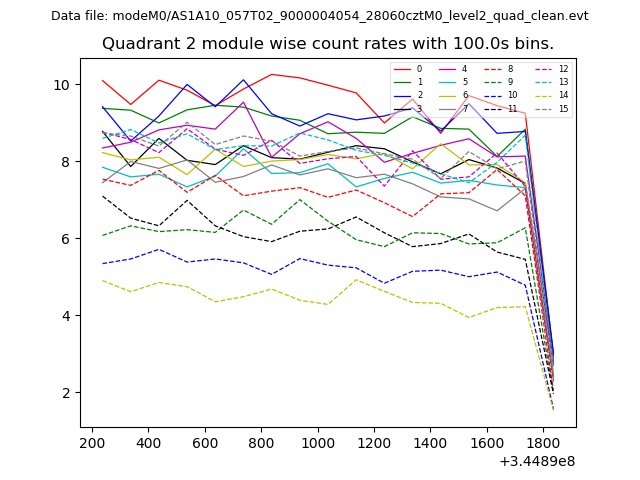
| Module-wise count rates for Quadrant B Data is divided into 100 sec bins |
 |
 |
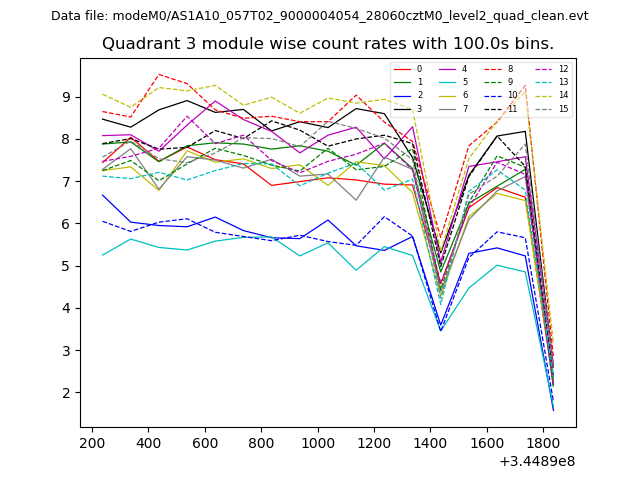
| Module-wise count rates for Quadrant C Data is divided into 100 sec bins |
 |
 |
| Module-wise count rates for Quadrant D Data is divided into 100 sec bins |
 |
 |
| Parameter | Plot |
|---|---|
| CZT HV Monitor | 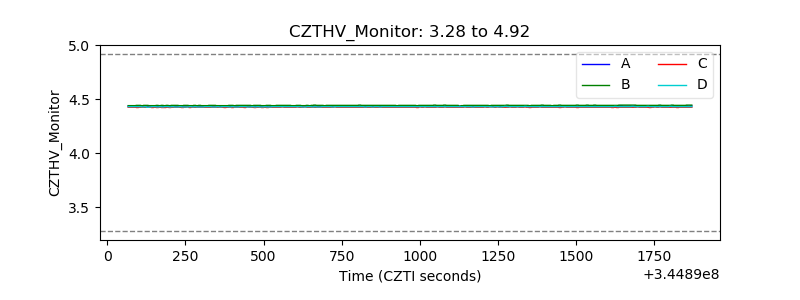 |
| D_VDD | 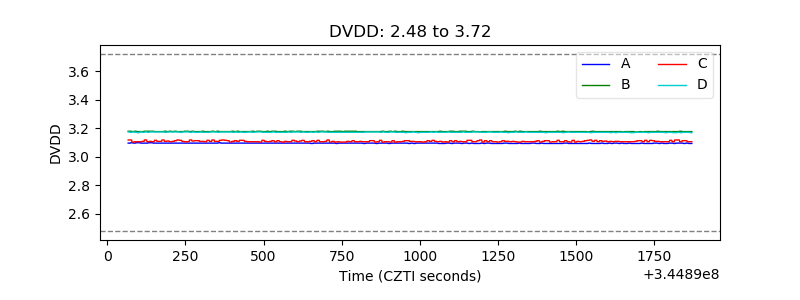 |
| Temperature 1 | 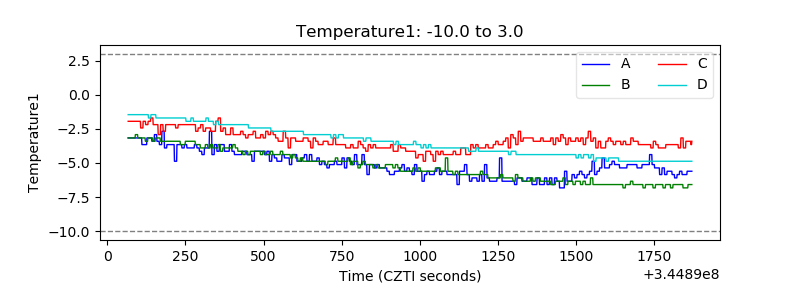 |
| Veto HV Monitor | 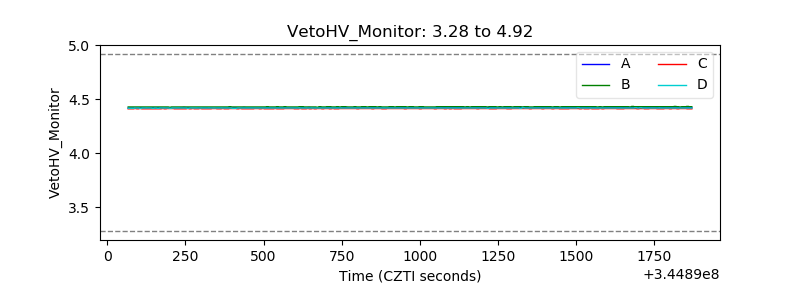 |
| Veto LLD | 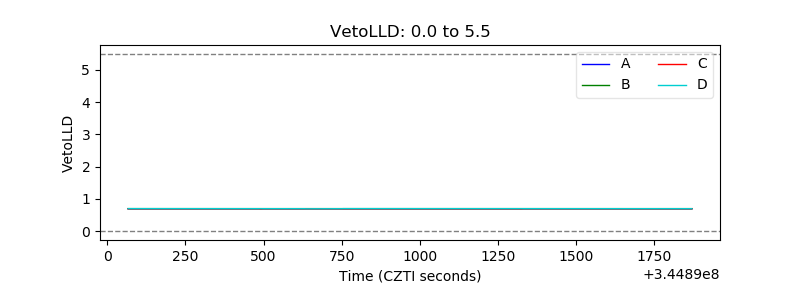 |
| Alpha Counter | 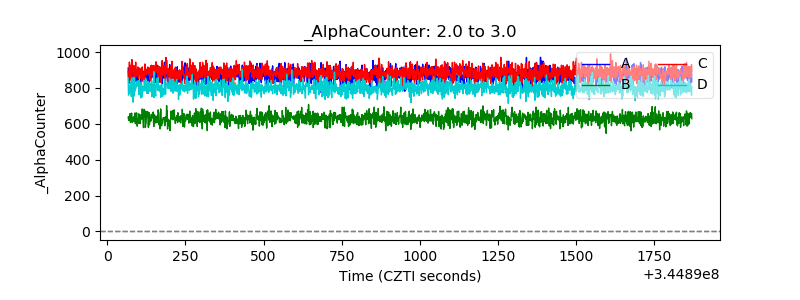 |
| _CPM_Rate | 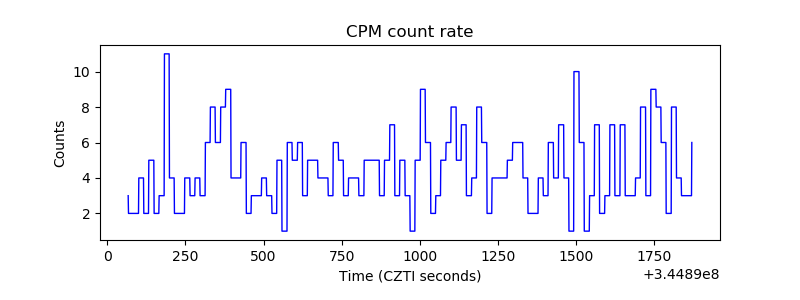 |
| CZT Counter | 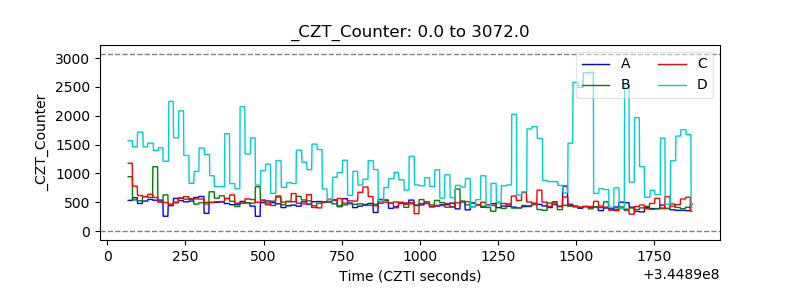 |
| +2.5 Volts monitor |  |
| +5 Volts monitor |  |
| _ROLL_ROT | 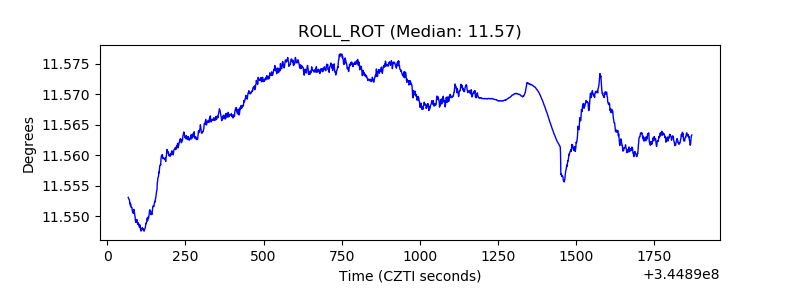 |
| _Roll_DEC | 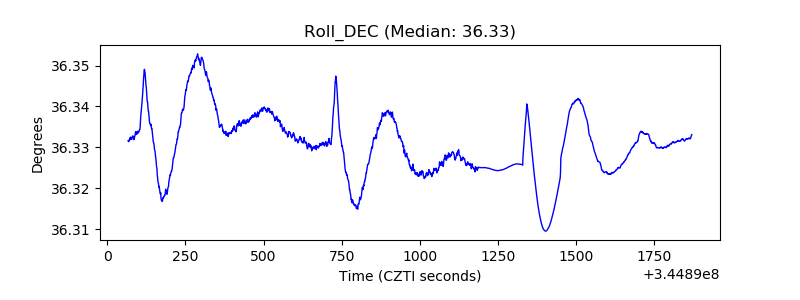 |
| _Roll_RA | 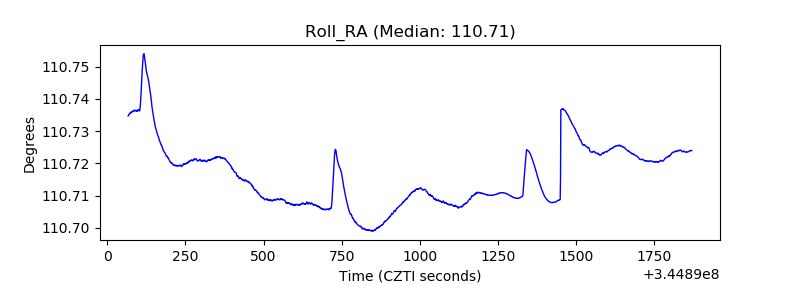 |
| Veto Counter | 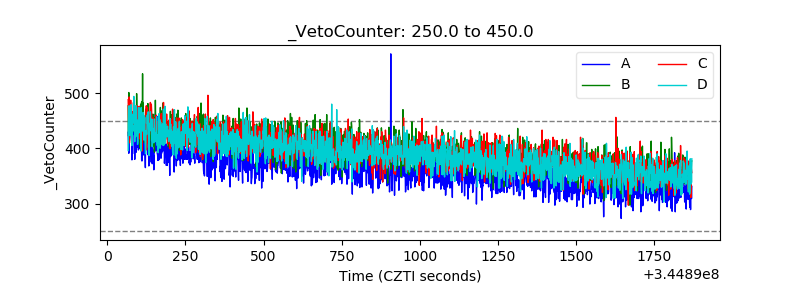 |