| Param | Original file | Final file |
|---|---|---|
| Filename | modeM0/AS1A10_057T02_9000004054_28061cztM0_level2.evt | modeM0/AS1A10_057T02_9000004054_28061cztM0_level2_quad_clean.evt |
| Size (bytes) | 1,477,725,120 | 219,893,760 |
| Size | 1.4 GB | 209.7 MB |
| Events in quadrant A | 8,108,567 | 1,426,148 |
| Events in quadrant B | 10,479,538 | 1,405,267 |
| Events in quadrant C | 8,259,016 | 1,374,289 |
| Events in quadrant D | 16,758,256 | 1,280,289 |
| Mode M9 | |||
|---|---|---|---|
| Quadrant | BADHDUFLAG | Total packets | Discarded packets |
| A | 0 | 21 | 0 |
| B | 0 | 21 | 0 |
| C | 0 | 21 | 0 |
| D | 0 | 21 | 0 |
| Mode M0 | |||
|---|---|---|---|
| Quadrant | BADHDUFLAG | Total packets | Discarded packets |
| A | 0 | 35660 | 0 |
| B | 0 | 42668 | 0 |
| C | 0 | 35714 | 0 |
| D | 0 | 61682 | 0 |
| Quadrant | Total seconds | Saturated seconds | Saturation percentage |
|---|---|---|---|
| A | 17027 | 64 | 0.375874% |
| B | 17028 | 1040 | 6.107588% |
| C | 17028 | 175 | 1.027719% |
| D | 17027 | 1776 | 10.430493% |
Noise dominated data is calculated using 1-second bins in cleaned event files. If a bin has >2000 counts, and if more than 50% of those come from <1% of pixels, then it is considered to be noise-dominated and hence unusable.
| Quadrant | # 1 sec bins | Bins with >0 counts | Bins with >2000 counts | High rate bins dominated by noise | Noise dominated (total time) | Noise dominated (detector-on time) | Marked lightcurve |
|---|---|---|---|---|---|---|---|
| A | 19037 | 17030 | 0 | 0 | 0.00% | 0.00% | 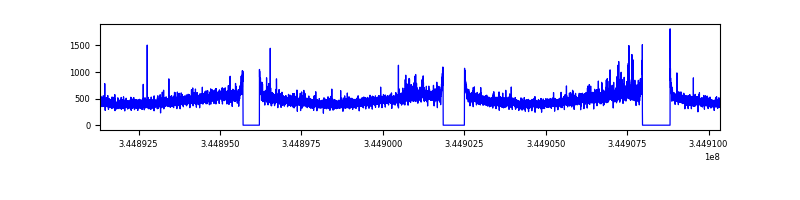 |
| B | 19038 | 17030 | 732 | 732 | 3.84% | 4.30% |  |
| C | 19038 | 17031 | 8 | 8 | 0.04% | 0.05% | 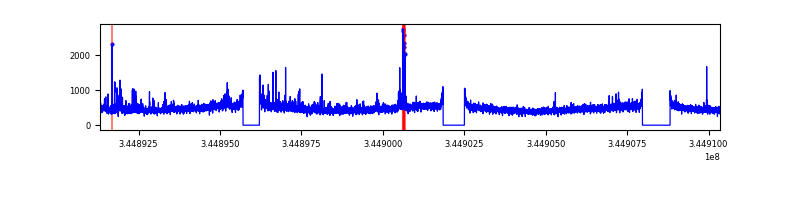 |
| D | 19037 | 17028 | 1354 | 1354 | 7.11% | 7.95% |  |
Top three noisy pixels from each quadrant. If the there are fewer than three noisy pixels in the level2.evt file, extra rows are filled as -1
| Pixel properties | Quadrant properties | ||||||
|---|---|---|---|---|---|---|---|
| Quadrant | DetID | PixID | Counts | Sigma | Mean | Median | Sigma |
| A | 0 | 13 | 292908 | 718.26 | 2019 | 1976 | 405.0 |
| A | 13 | 254 | 28640 | 65.83 | 2019 | 1976 | 405.0 |
| A | 3 | 137 | 19665 | 43.67 | 2019 | 1976 | 405.0 |
| B | 10 | 245 | 2636135 | 7093.41 | 1966 | 1913 | 371.4 |
| B | 12 | 111 | 46961 | 121.3 | 1966 | 1913 | 371.4 |
| B | 11 | 111 | 42016 | 107.99 | 1966 | 1913 | 371.4 |
| C | 3 | 233 | 384285 | 848.88 | 1925 | 1937 | 450.4 |
| C | 14 | 238 | 307089 | 677.49 | 1925 | 1937 | 450.4 |
| C | 15 | 208 | 54174 | 115.98 | 1925 | 1937 | 450.4 |
| D | 8 | 195 | 5528473 | 12500.45 | 1865 | 1818 | 442.1 |
| D | 1 | 52 | 2179489 | 4925.56 | 1865 | 1818 | 442.1 |
| D | 2 | 250 | 1270534 | 2869.64 | 1865 | 1818 | 442.1 |
Histogram calculated using DETX and DETY for each event in the final _common_clean file
| Quadrant A | 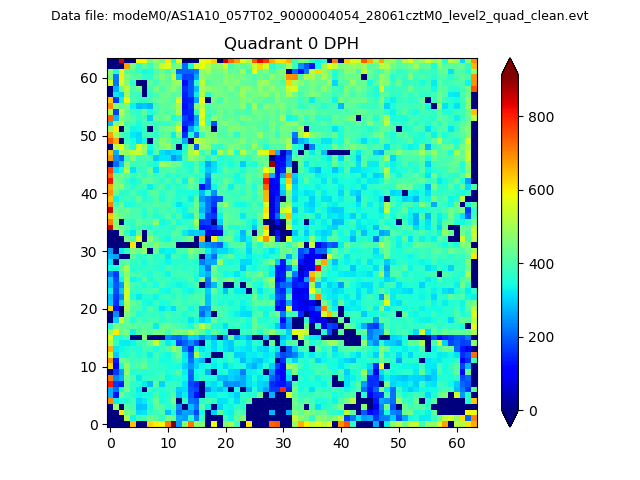 |
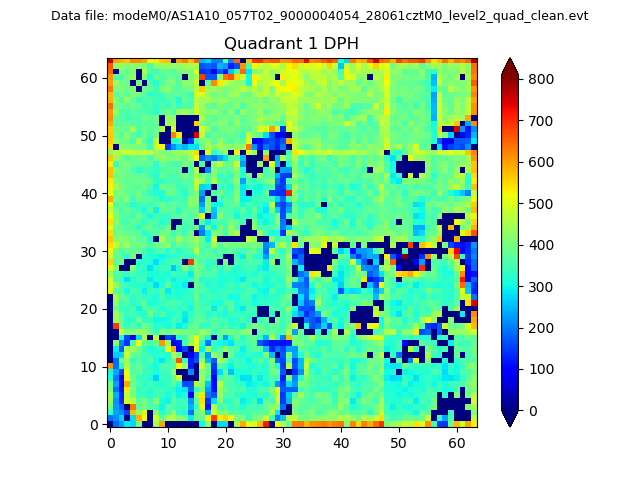 |
Quadrant B |
|---|---|---|---|
| Quadrant D | 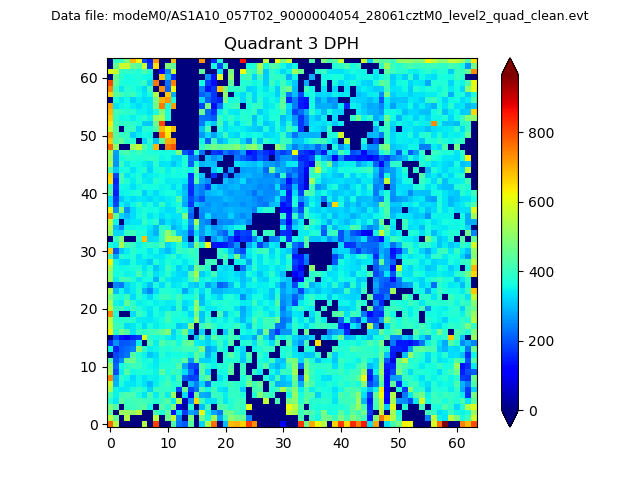 |
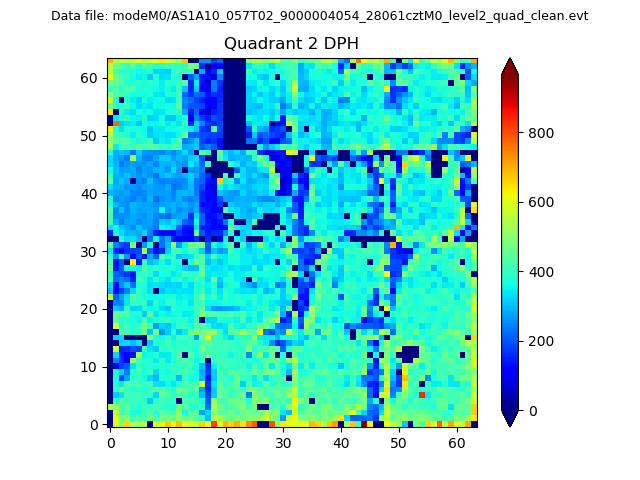 |
Quadrant C |
| Plot type | Count rate plots | Images |
|---|---|---|
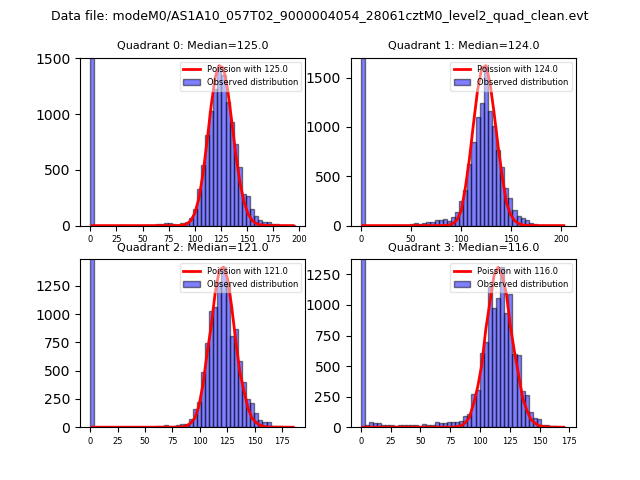
| Comparison with Poisson distribution Blue bars denote a histogram of data divided into 1 sec bins. Red curve is a Poisson curve with rate = median count rate of data. |
 |
 |
| Quadrant-wise count rates Data is divided into 100 sec bins |
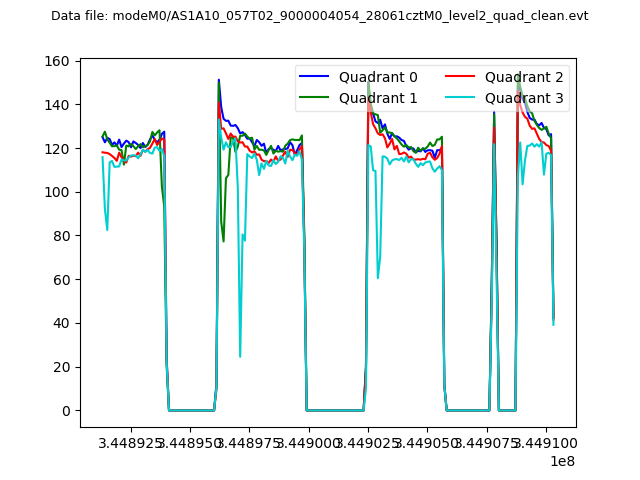 |
|
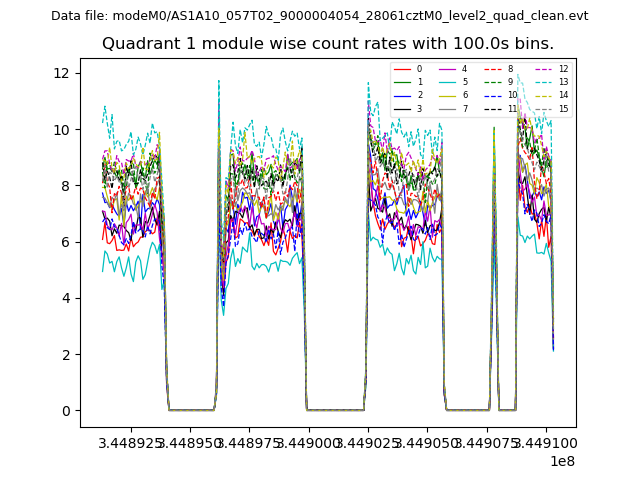
| Module-wise count rates for Quadrant A Data is divided into 100 sec bins |
 |
 |
| Module-wise count rates for Quadrant B Data is divided into 100 sec bins |
 |
 |
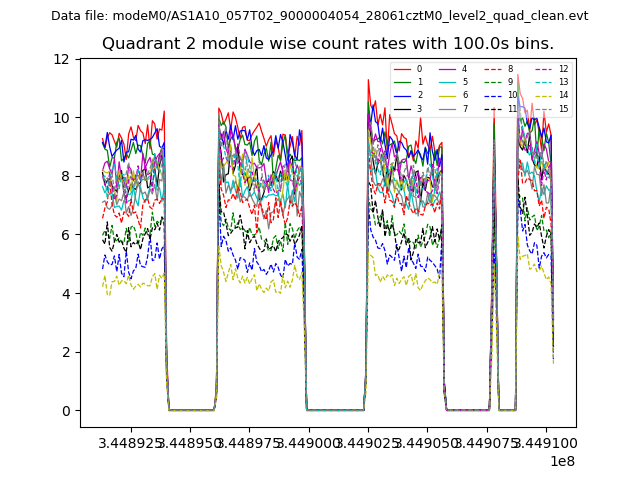
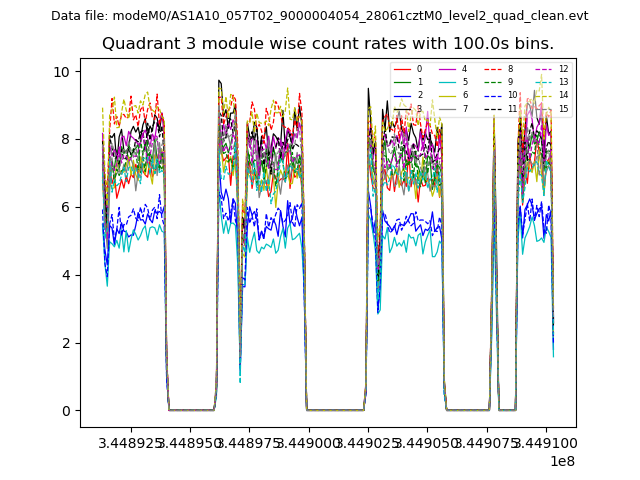
| Module-wise count rates for Quadrant C Data is divided into 100 sec bins |
 |
 |
| Module-wise count rates for Quadrant D Data is divided into 100 sec bins |
 |
 |
| Parameter | Plot |
|---|---|
| CZT HV Monitor | 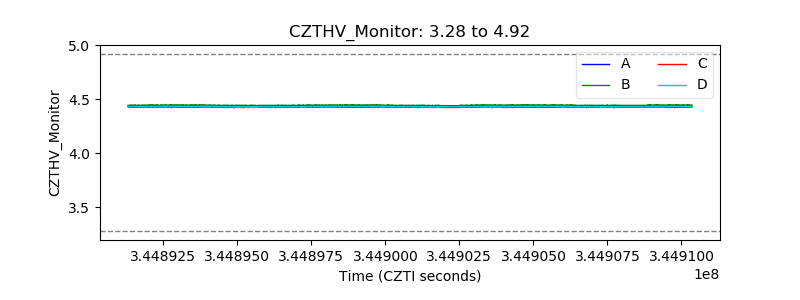 |
| D_VDD |  |
| Temperature 1 | 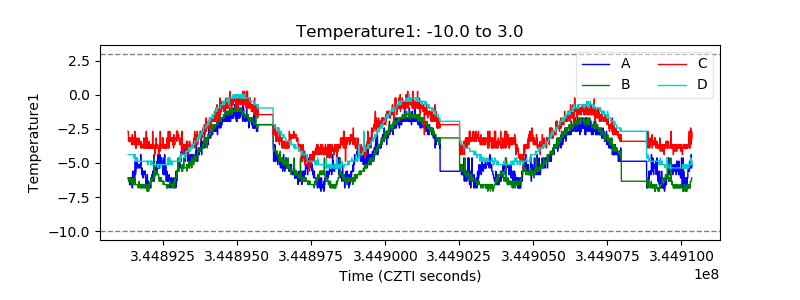 |
| Veto HV Monitor | 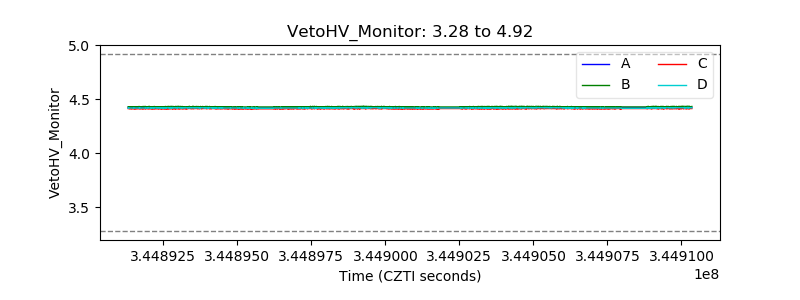 |
| Veto LLD | 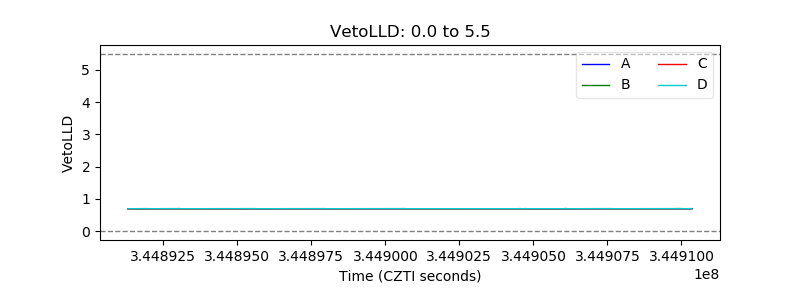 |
| Alpha Counter | 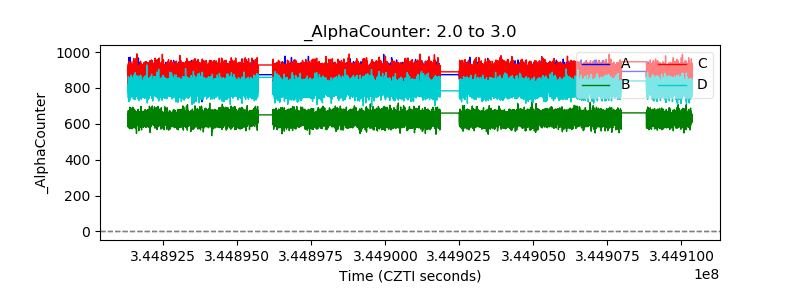 |
| _CPM_Rate | 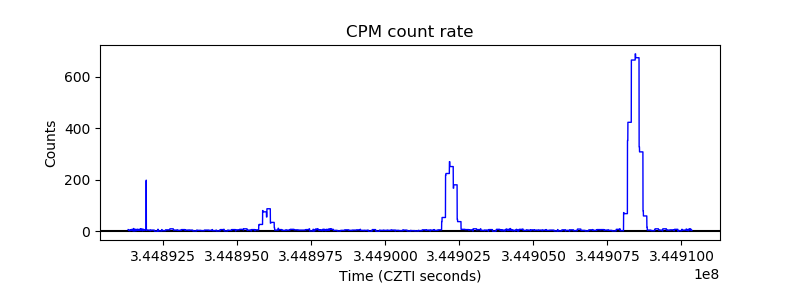 |
| CZT Counter | 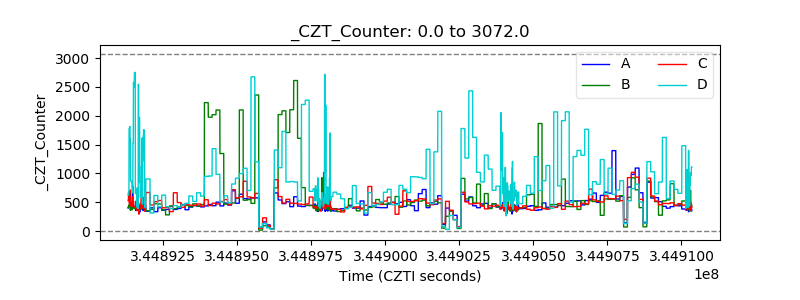 |
| +2.5 Volts monitor |  |
| +5 Volts monitor |  |
| _ROLL_ROT | 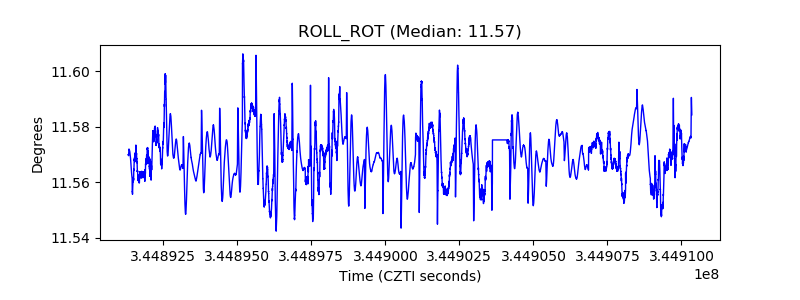 |
| _Roll_DEC | 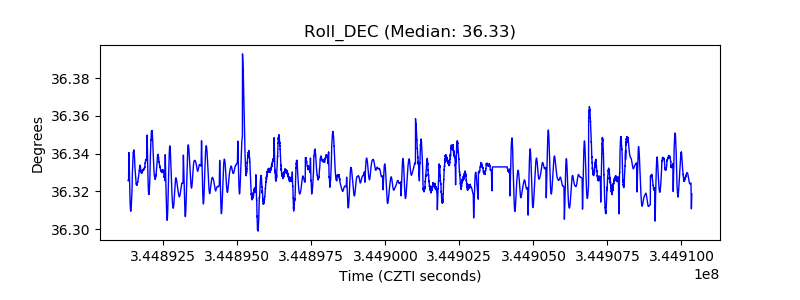 |
| _Roll_RA | 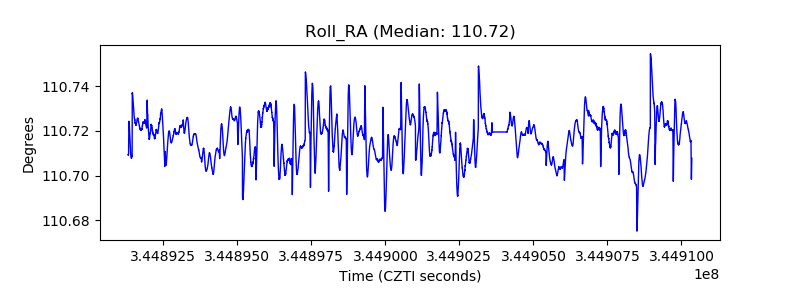 |
| Veto Counter | 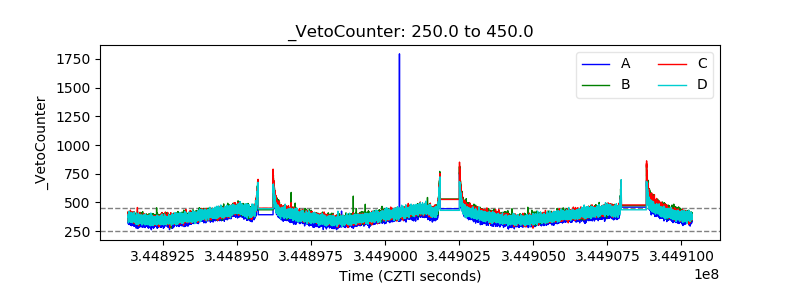 |