| Param | Original file | Final file |
|---|---|---|
| Filename | modeM0/AS1A10_057T02_9000004054_28064cztM0_level2.evt | modeM0/AS1A10_057T02_9000004054_28064cztM0_level2_quad_clean.evt |
| Size (bytes) | 786,962,880 | 117,429,120 |
| Size | 750.5 MB | 112.0 MB |
| Events in quadrant A | 4,592,357 | 748,641 |
| Events in quadrant B | 4,779,156 | 754,251 |
| Events in quadrant C | 4,531,927 | 715,305 |
| Events in quadrant D | 9,274,331 | 666,022 |
| Mode M9 | |||
|---|---|---|---|
| Quadrant | BADHDUFLAG | Total packets | Discarded packets |
| A | 0 | 22 | 5 |
| B | 0 | 22 | 2 |
| C | 0 | 22 | 3 |
| D | 0 | 22 | 3 |
| Mode M0 | |||
|---|---|---|---|
| Quadrant | BADHDUFLAG | Total packets | Discarded packets |
| A | 0 | 19732 | 0 |
| B | 0 | 20294 | 0 |
| C | 0 | 19670 | 0 |
| D | 0 | 34165 | 0 |
| Quadrant | Total seconds | Saturated seconds | Saturation percentage |
|---|---|---|---|
| A | 9645 | 49 | 0.508035% |
| B | 9648 | 66 | 0.684080% |
| C | 9641 | 95 | 0.985375% |
| D | 9534 | 761 | 7.981959% |
Noise dominated data is calculated using 1-second bins in cleaned event files. If a bin has >2000 counts, and if more than 50% of those come from <1% of pixels, then it is considered to be noise-dominated and hence unusable.
| Quadrant | # 1 sec bins | Bins with >0 counts | Bins with >2000 counts | High rate bins dominated by noise | Noise dominated (total time) | Noise dominated (detector-on time) | Marked lightcurve |
|---|---|---|---|---|---|---|---|
| A | 12898 | 9816 | 0 | 0 | 0.00% | 0.00% | 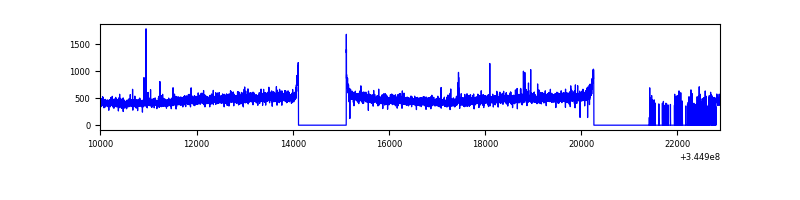 |
| B | 12898 | 9830 | 4 | 4 | 0.03% | 0.04% | 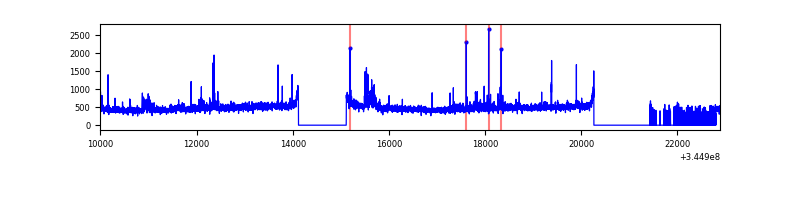 |
| C | 12898 | 9821 | 0 | 0 | 0.00% | 0.00% | 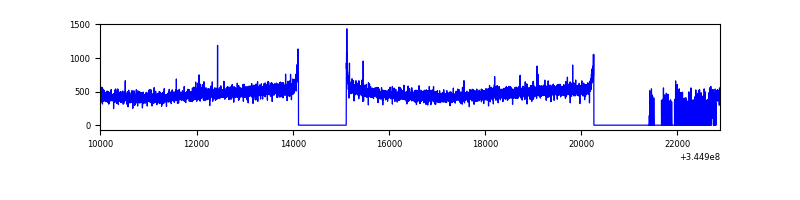 |
| D | 12898 | 9670 | 581 | 581 | 4.50% | 6.01% | 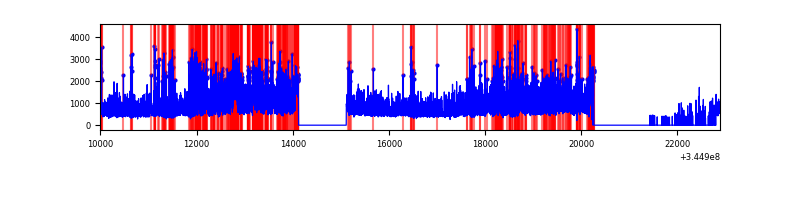 |
Top three noisy pixels from each quadrant. If the there are fewer than three noisy pixels in the level2.evt file, extra rows are filled as -1
| Pixel properties | Quadrant properties | ||||||
|---|---|---|---|---|---|---|---|
| Quadrant | DetID | PixID | Counts | Sigma | Mean | Median | Sigma |
| A | 0 | 13 | 44967 | 187.52 | 1170 | 1150 | 233.7 |
| A | 13 | 254 | 15394 | 60.96 | 1170 | 1150 | 233.7 |
| A | 4 | 2 | 14381 | 56.62 | 1170 | 1150 | 233.7 |
| B | 10 | 245 | 203352 | 920.33 | 1154 | 1125 | 219.7 |
| B | 12 | 111 | 27244 | 118.87 | 1154 | 1125 | 219.7 |
| B | 11 | 111 | 24455 | 106.17 | 1154 | 1125 | 219.7 |
| C | 14 | 238 | 182921 | 706.11 | 1106 | 1112 | 257.5 |
| C | 3 | 233 | 35015 | 131.67 | 1106 | 1112 | 257.5 |
| C | 13 | 61 | 7567 | 25.07 | 1106 | 1112 | 257.5 |
| D | 8 | 195 | 3421760 | 13483.49 | 1077 | 1047 | 253.7 |
| D | 1 | 52 | 1223726 | 4819.46 | 1077 | 1047 | 253.7 |
| D | 2 | 250 | 403378 | 1585.88 | 1077 | 1047 | 253.7 |
Histogram calculated using DETX and DETY for each event in the final _common_clean file
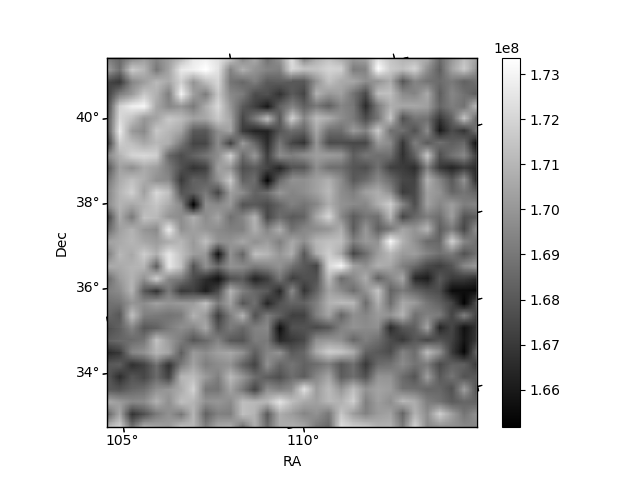
| Quadrant A |  |
 |
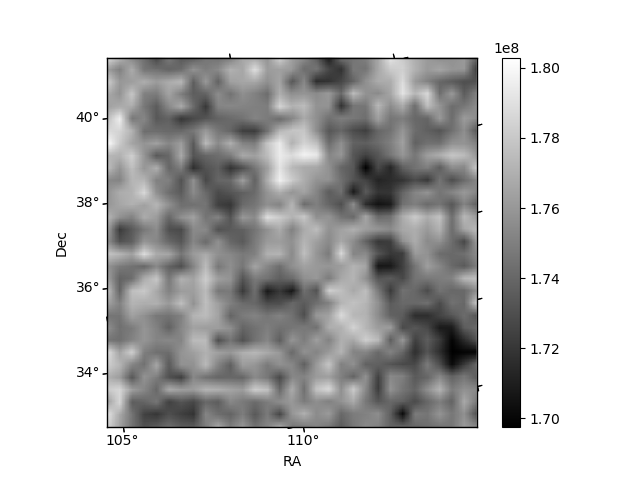
Quadrant B |
|---|---|---|---|
| Quadrant D | 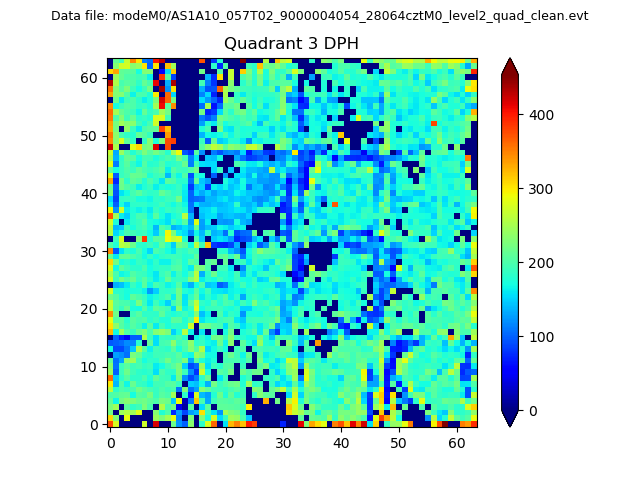 |
 |
Quadrant C |
| Plot type | Count rate plots | Images |
|---|---|---|
| Comparison with Poisson distribution Blue bars denote a histogram of data divided into 1 sec bins. Red curve is a Poisson curve with rate = median count rate of data. |
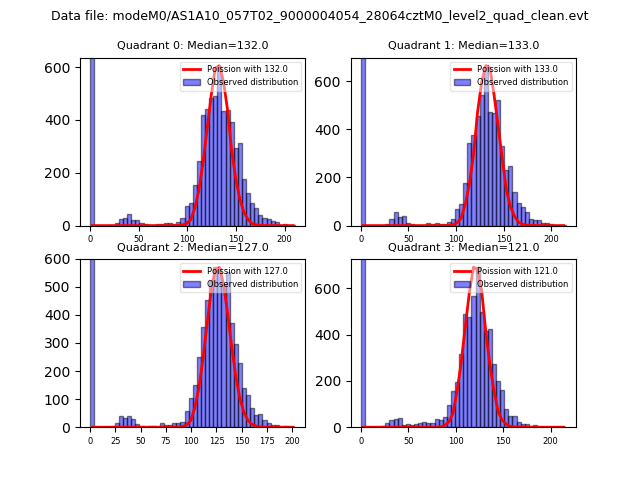 |
 |
| Quadrant-wise count rates Data is divided into 100 sec bins |
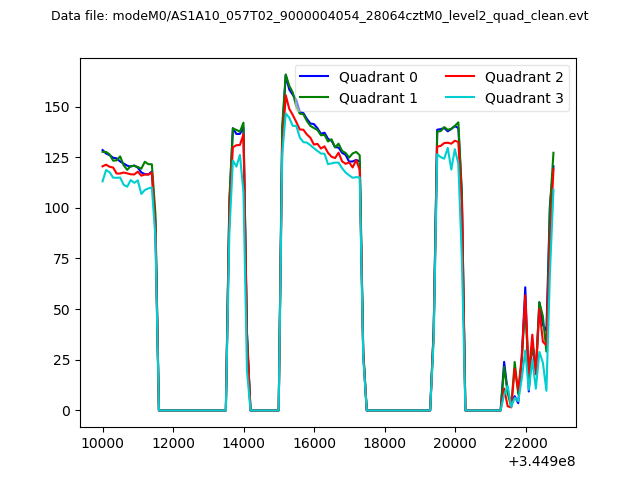 |
|
| Module-wise count rates for Quadrant A Data is divided into 100 sec bins |
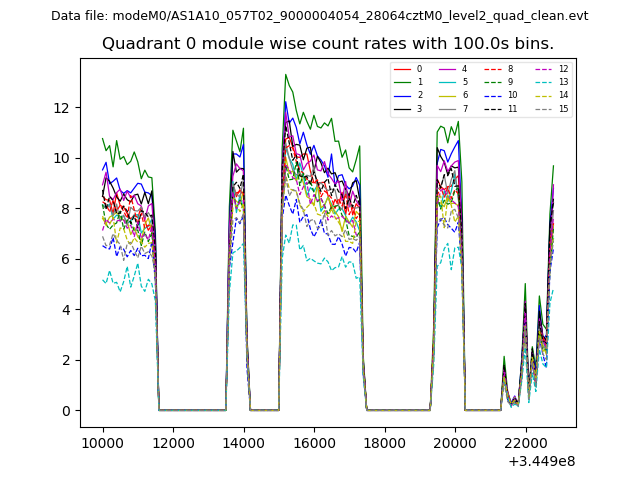 |
 |
| Module-wise count rates for Quadrant B Data is divided into 100 sec bins |
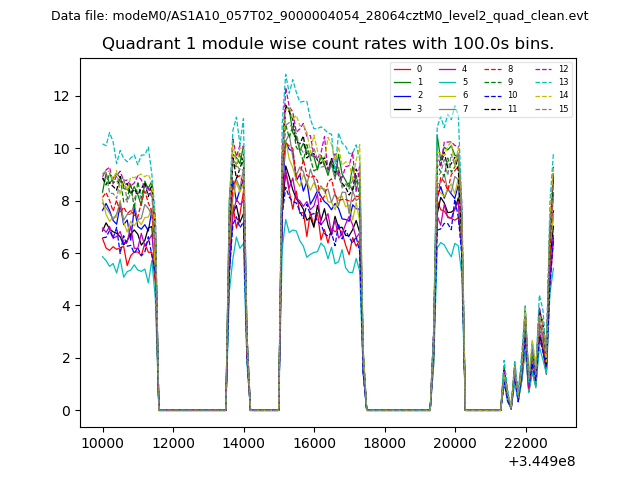 |
 |
| Module-wise count rates for Quadrant C Data is divided into 100 sec bins |
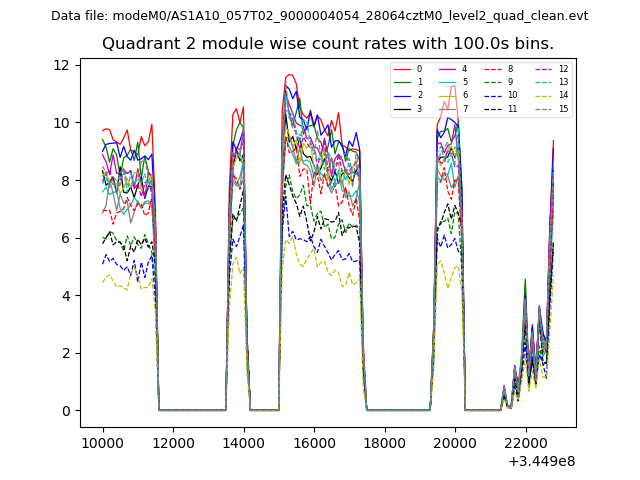 |
 |
| Module-wise count rates for Quadrant D Data is divided into 100 sec bins |
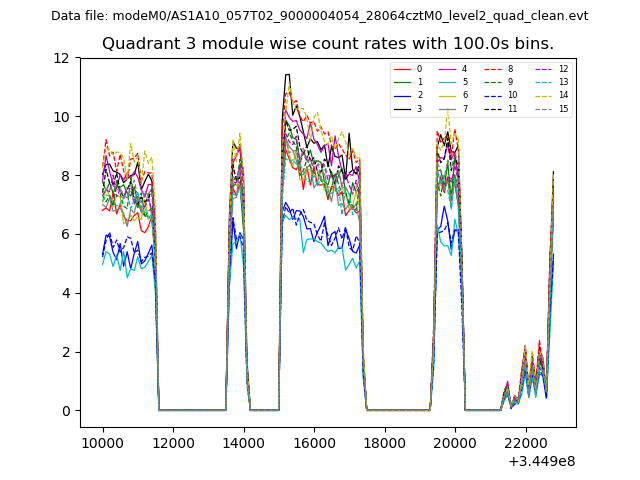 |
 |
| Parameter | Plot |
|---|---|
| CZT HV Monitor | 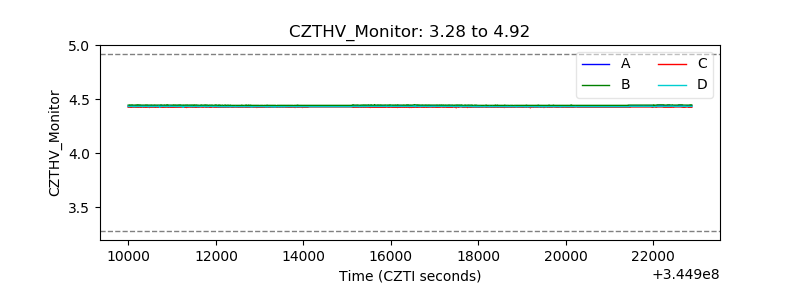 |
| D_VDD | 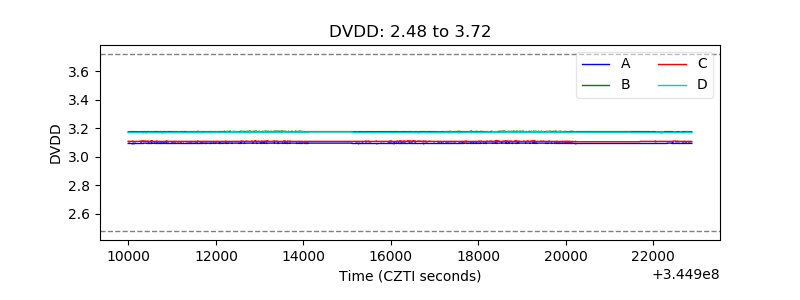 |
| Temperature 1 | 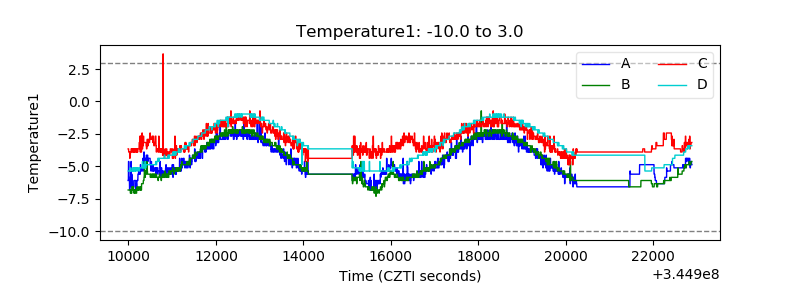 |
| Veto HV Monitor | 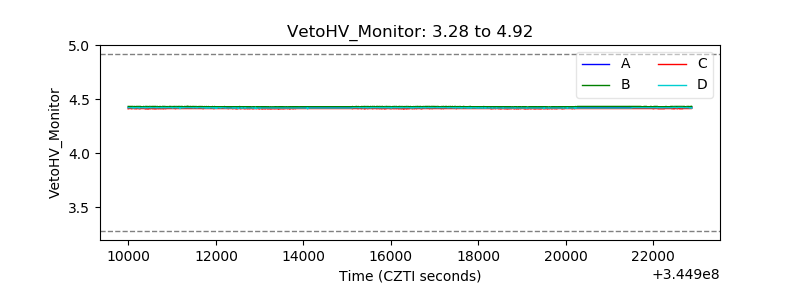 |
| Veto LLD | 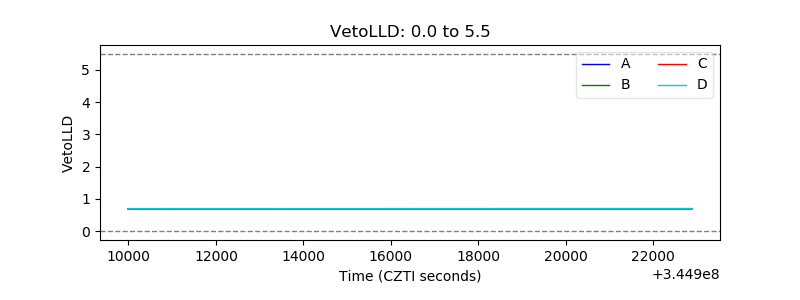 |
| Alpha Counter | 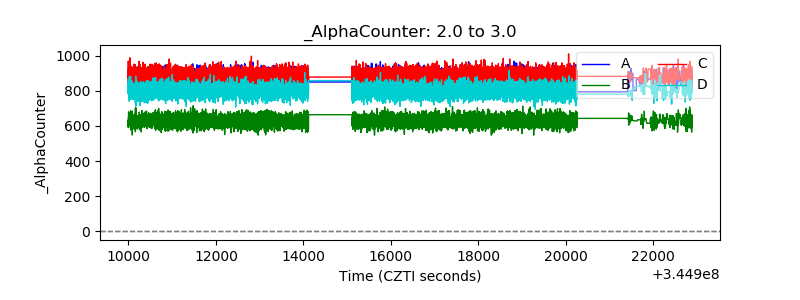 |
| _CPM_Rate | 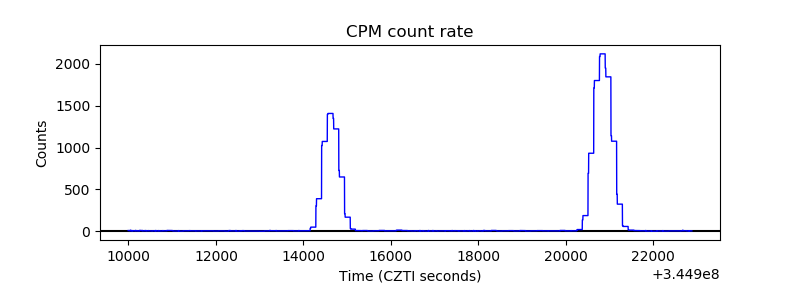 |
| CZT Counter | 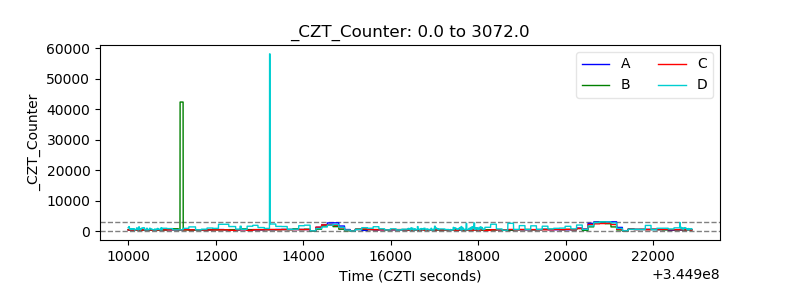 |
| +2.5 Volts monitor |  |
| +5 Volts monitor | 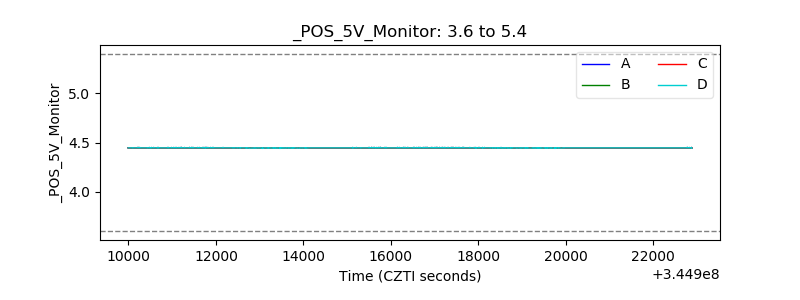 |
| _ROLL_ROT | 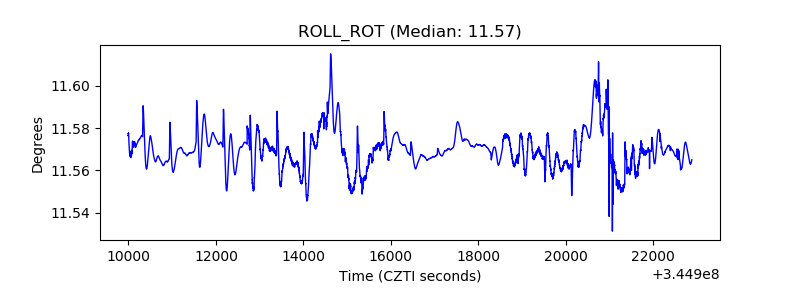 |
| _Roll_DEC | 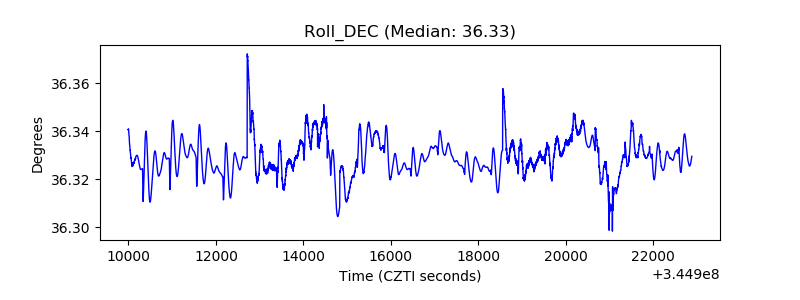 |
| _Roll_RA | 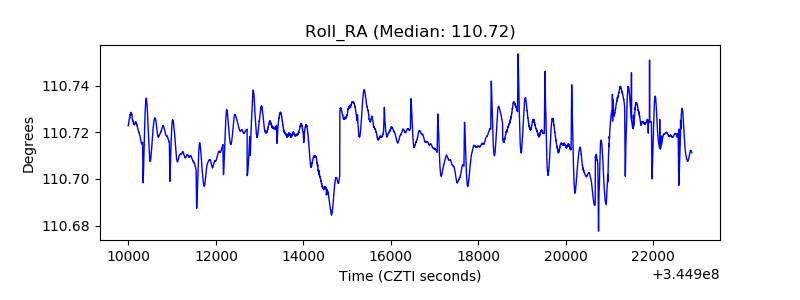 |
| Veto Counter | 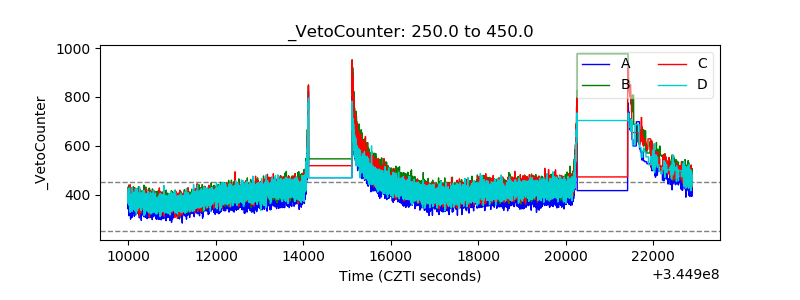 |