| Param | Original file | Final file |
|---|---|---|
| Filename | modeM0/AS1A10_057T02_9000004054_28065cztM0_level2.evt | modeM0/AS1A10_057T02_9000004054_28065cztM0_level2_quad_clean.evt |
| Size (bytes) | 597,306,240 | 105,203,520 |
| Size | 569.6 MB | 100.3 MB |
| Events in quadrant A | 3,477,447 | 712,887 |
| Events in quadrant B | 4,609,271 | 704,934 |
| Events in quadrant C | 3,332,275 | 669,865 |
| Events in quadrant D | 6,226,173 | 640,640 |
| Mode M9 | |||
|---|---|---|---|
| Quadrant | BADHDUFLAG | Total packets | Discarded packets |
| A | 0 | 16 | 0 |
| B | 0 | 17 | 0 |
| C | 0 | 17 | 0 |
| D | 0 | 17 | 0 |
| Mode M0 | |||
|---|---|---|---|
| Quadrant | BADHDUFLAG | Total packets | Discarded packets |
| A | 0 | 14172 | 0 |
| B | 0 | 17683 | 0 |
| C | 0 | 13740 | 0 |
| D | 0 | 22863 | 0 |
| Quadrant | Total seconds | Saturated seconds | Saturation percentage |
|---|---|---|---|
| A | 6559 | 60 | 0.914774% |
| B | 6559 | 436 | 6.647355% |
| C | 6559 | 93 | 1.417899% |
| D | 6559 | 677 | 10.321695% |
Noise dominated data is calculated using 1-second bins in cleaned event files. If a bin has >2000 counts, and if more than 50% of those come from <1% of pixels, then it is considered to be noise-dominated and hence unusable.
| Quadrant | # 1 sec bins | Bins with >0 counts | Bins with >2000 counts | High rate bins dominated by noise | Noise dominated (total time) | Noise dominated (detector-on time) | Marked lightcurve |
|---|---|---|---|---|---|---|---|
| A | 7764 | 6559 | 2 | 2 | 0.03% | 0.03% | 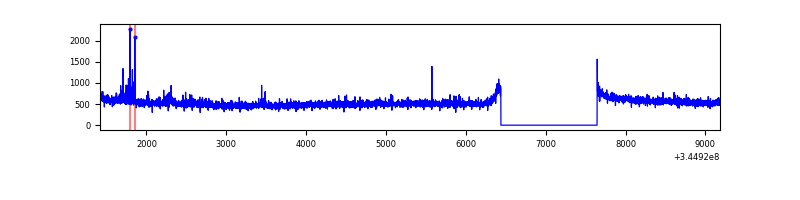 |
| B | 7764 | 6559 | 293 | 293 | 3.77% | 4.47% | 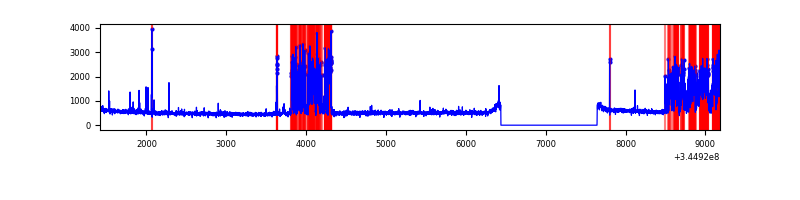 |
| C | 7764 | 6559 | 0 | 0 | 0.00% | 0.00% | 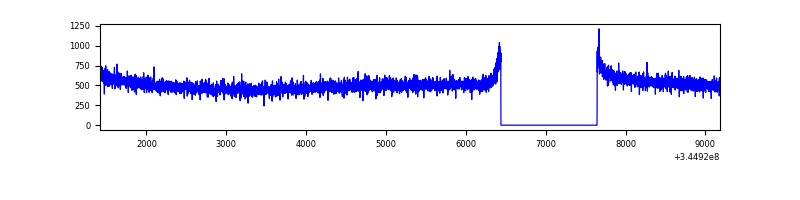 |
| D | 7764 | 6559 | 652 | 652 | 8.40% | 9.94% | 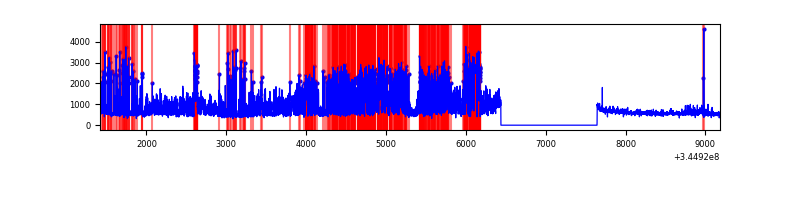 |
Top three noisy pixels from each quadrant. If the there are fewer than three noisy pixels in the level2.evt file, extra rows are filled as -1
| Pixel properties | Quadrant properties | ||||||
|---|---|---|---|---|---|---|---|
| Quadrant | DetID | PixID | Counts | Sigma | Mean | Median | Sigma |
| A | 0 | 13 | 59160 | 336.73 | 878 | 865 | 173.1 |
| A | 4 | 2 | 25916 | 144.7 | 878 | 865 | 173.1 |
| A | 13 | 254 | 10311 | 54.56 | 878 | 865 | 173.1 |
| B | 10 | 245 | 1293312 | 8183.62 | 842 | 823 | 157.9 |
| B | 12 | 111 | 18859 | 114.2 | 842 | 823 | 157.9 |
| B | 11 | 111 | 16731 | 100.72 | 842 | 823 | 157.9 |
| C | 14 | 238 | 133734 | 708.13 | 815 | 821 | 187.7 |
| C | 3 | 233 | 21263 | 108.91 | 815 | 821 | 187.7 |
| C | 13 | 61 | 5732 | 26.16 | 815 | 821 | 187.7 |
| D | 8 | 195 | 2317810 | 12280.75 | 812 | 795 | 188.7 |
| D | 2 | 250 | 516362 | 2732.63 | 812 | 795 | 188.7 |
| D | 1 | 52 | 288045 | 1522.5 | 812 | 795 | 188.7 |
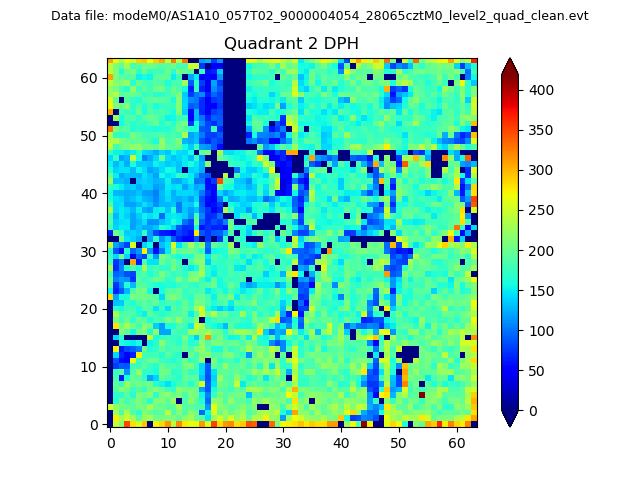
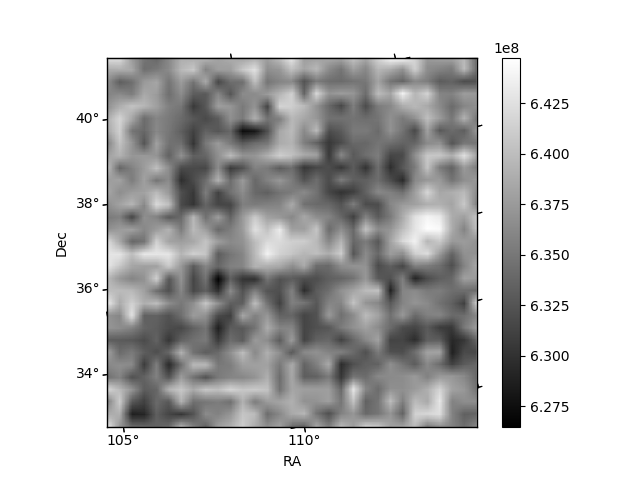
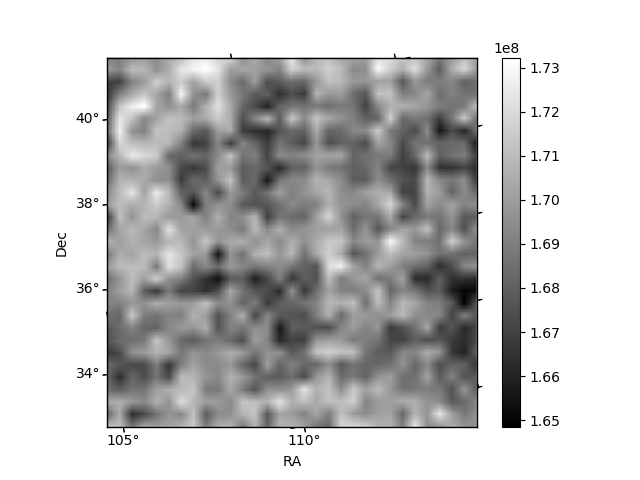
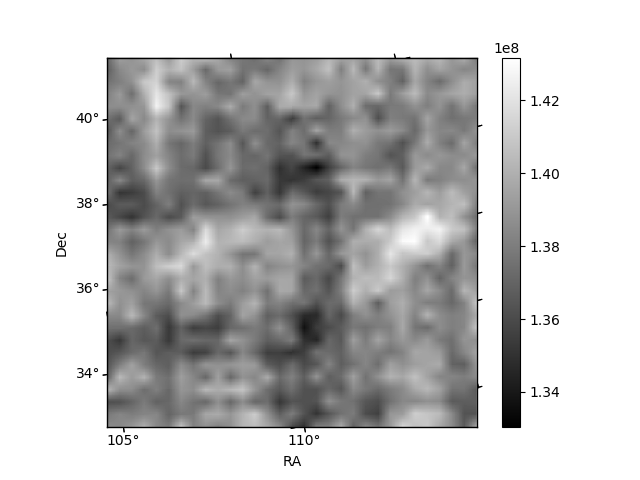
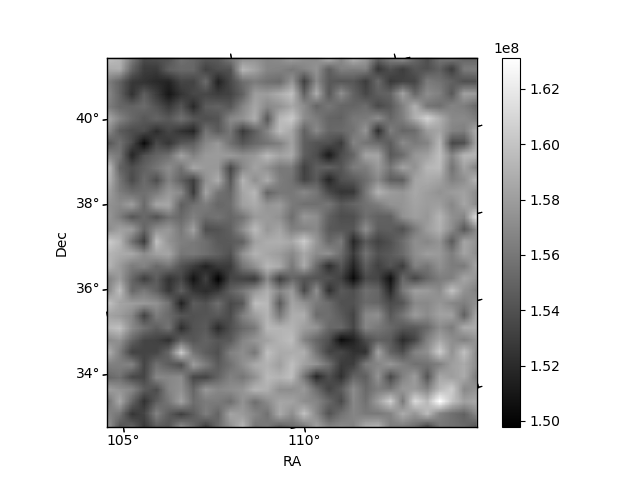
Histogram calculated using DETX and DETY for each event in the final _common_clean file
| Quadrant A | 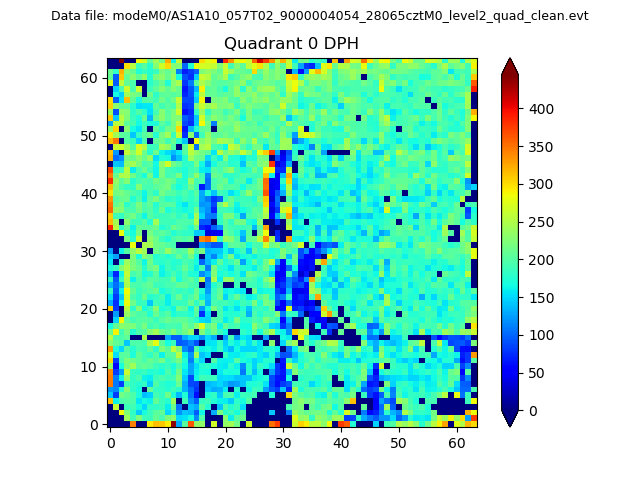 |
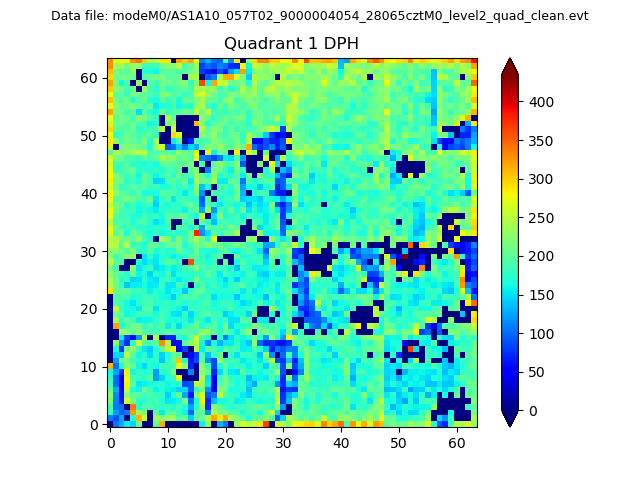 |
Quadrant B |
|---|---|---|---|
| Quadrant D | 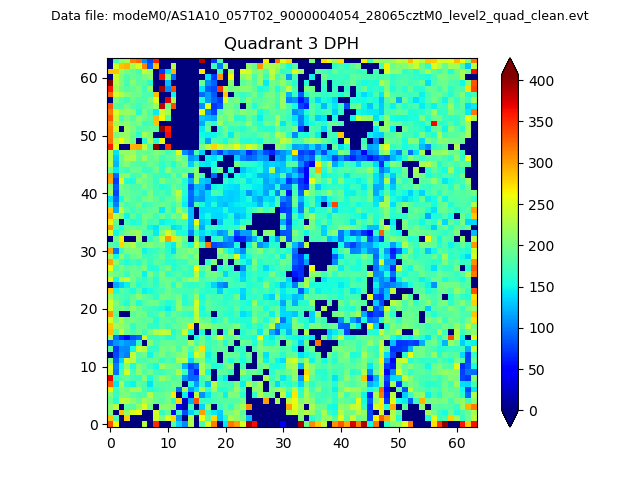 |
 |
Quadrant C |
| Plot type | Count rate plots | Images |
|---|---|---|
| Comparison with Poisson distribution Blue bars denote a histogram of data divided into 1 sec bins. Red curve is a Poisson curve with rate = median count rate of data. |
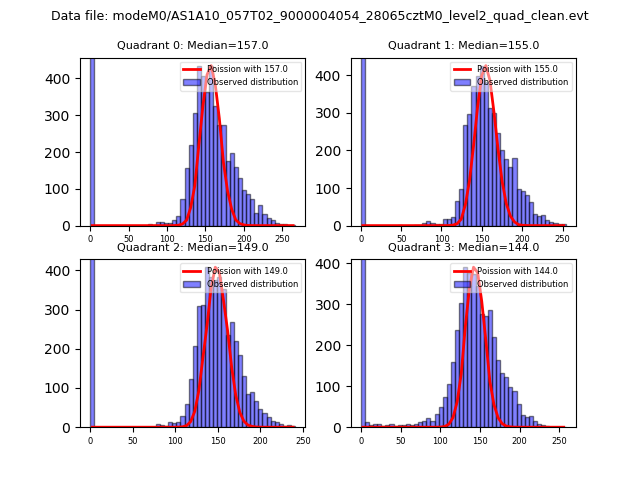 |
 |
| Quadrant-wise count rates Data is divided into 100 sec bins |
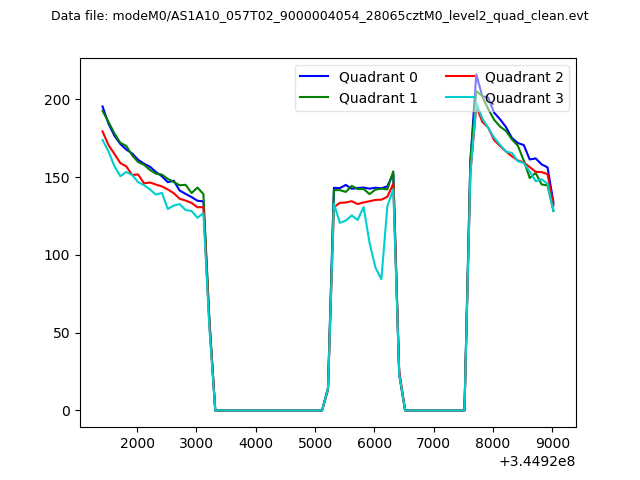 |
|
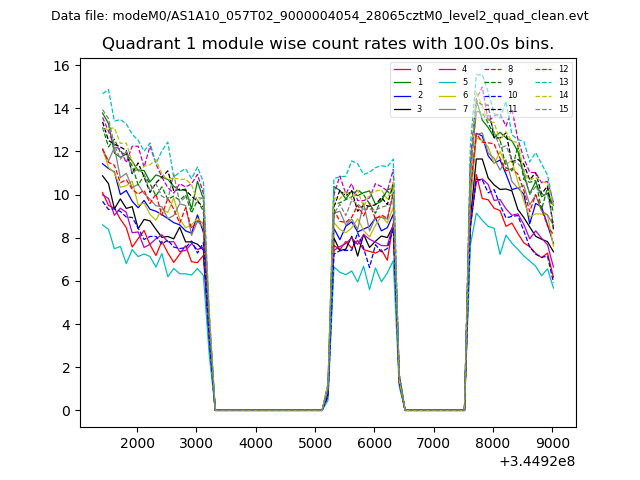
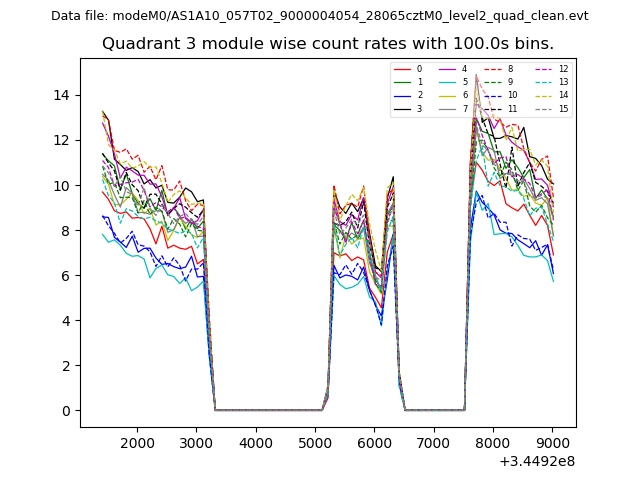
| Module-wise count rates for Quadrant A Data is divided into 100 sec bins |
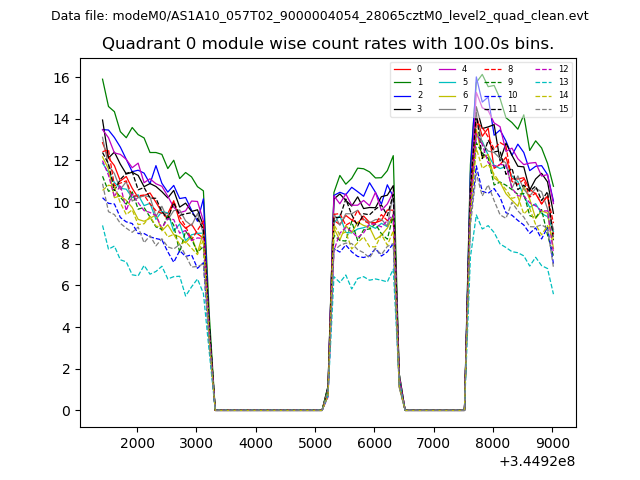 |
 |
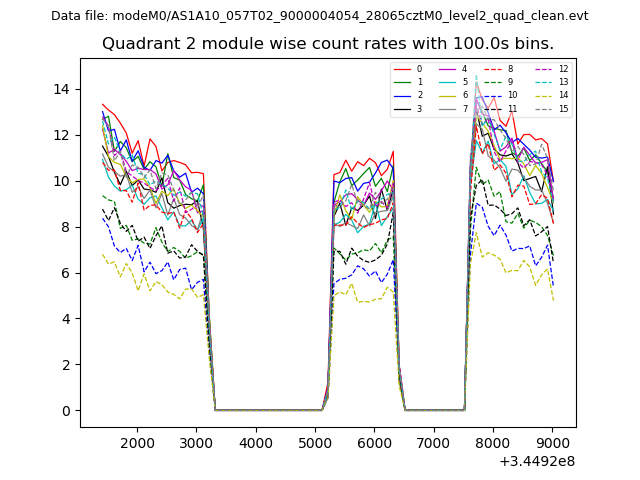
| Module-wise count rates for Quadrant B Data is divided into 100 sec bins |
 |
 |
| Module-wise count rates for Quadrant C Data is divided into 100 sec bins |
 |
 |
| Module-wise count rates for Quadrant D Data is divided into 100 sec bins |
 |
 |
| Parameter | Plot |
|---|---|
| CZT HV Monitor | 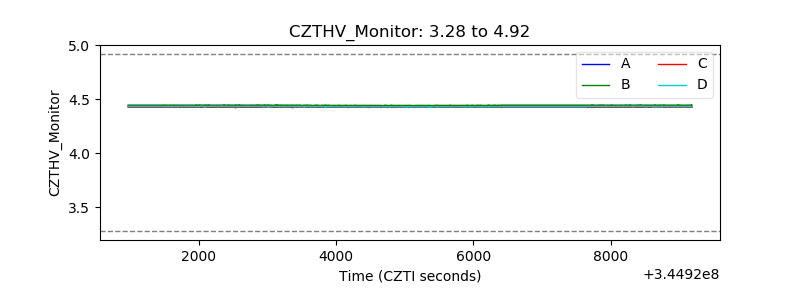 |
| D_VDD | 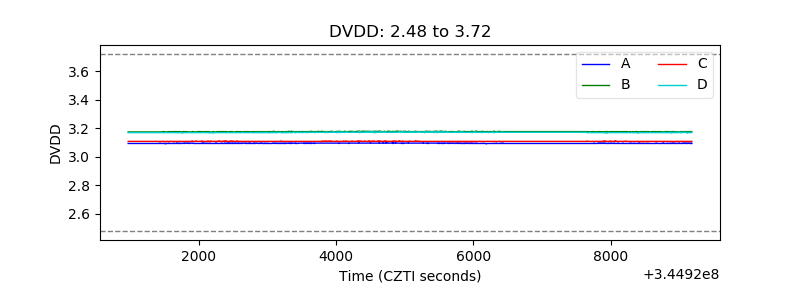 |
| Temperature 1 | 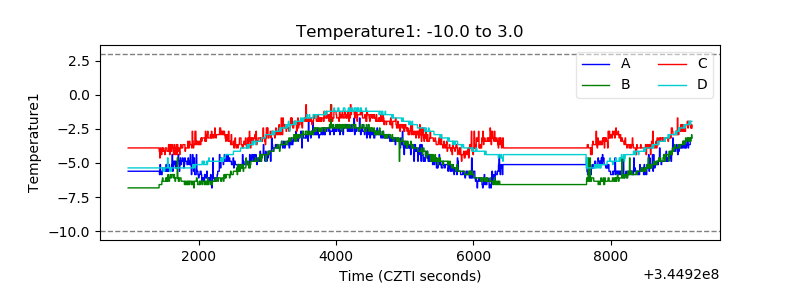 |
| Veto HV Monitor | 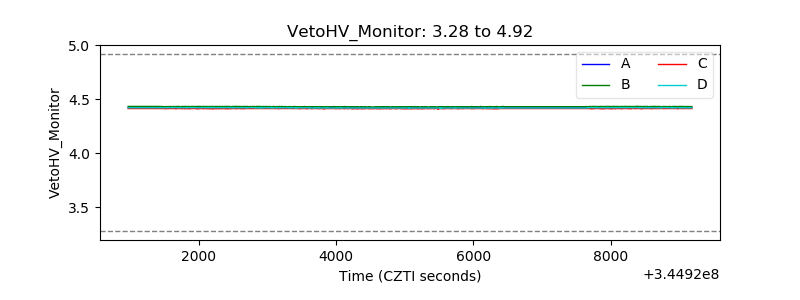 |
| Veto LLD | 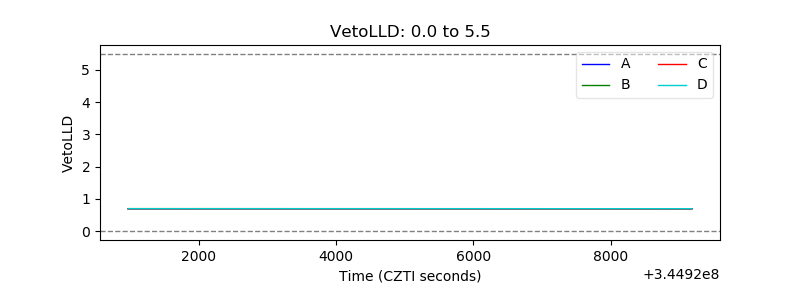 |
| Alpha Counter | 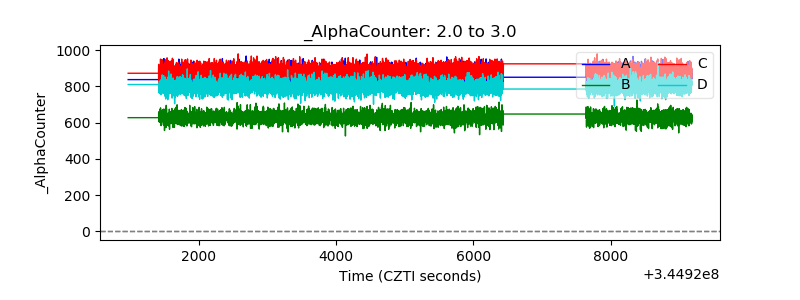 |
| _CPM_Rate | 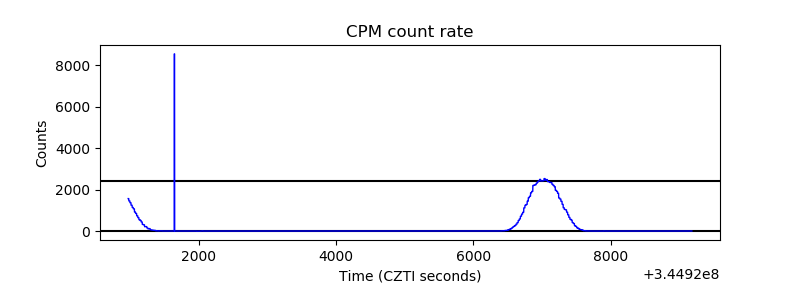 |
| CZT Counter | 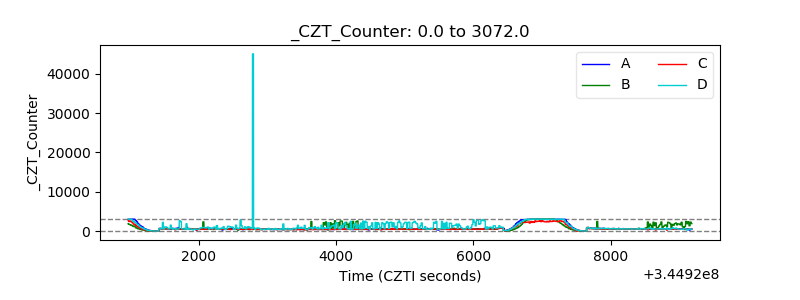 |
| +2.5 Volts monitor |  |
| +5 Volts monitor |  |
| _ROLL_ROT | 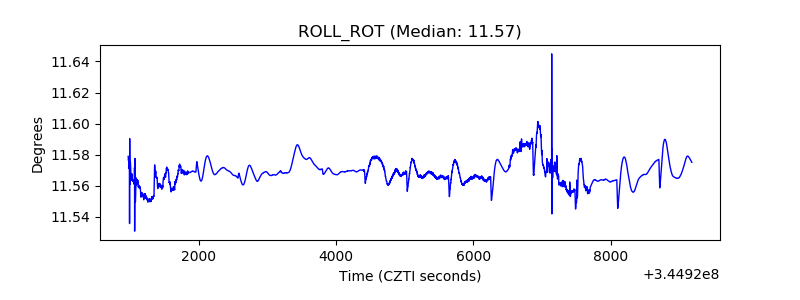 |
| _Roll_DEC | 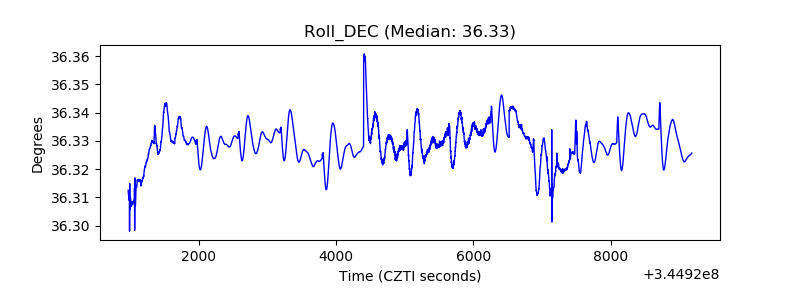 |
| _Roll_RA | 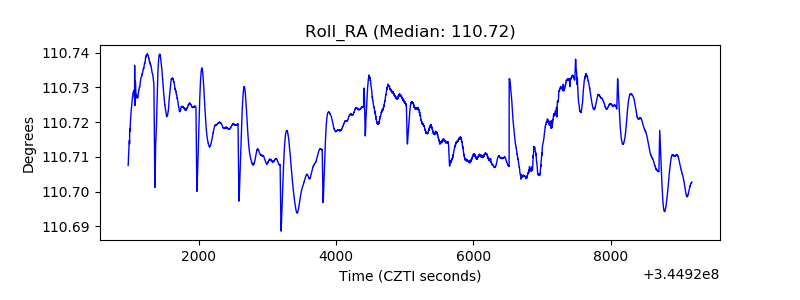 |
| Veto Counter | 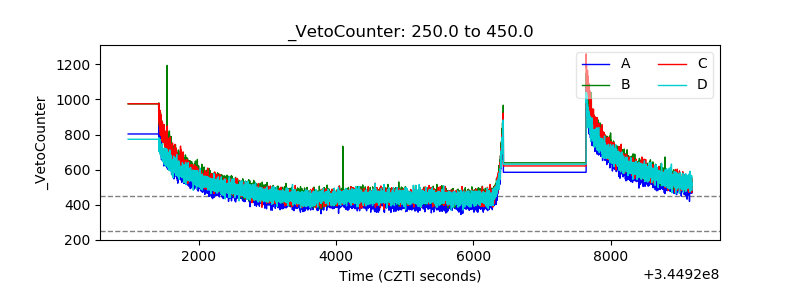 |