| Param | Original file | Final file |
|---|---|---|
| Filename | modeM0/AS1A10_057T02_9000004054_28066cztM0_level2.evt | modeM0/AS1A10_057T02_9000004054_28066cztM0_level2_quad_clean.evt |
| Size (bytes) | 599,258,880 | 71,009,280 |
| Size | 571.5 MB | 67.7 MB |
| Events in quadrant A | 3,049,799 | 509,798 |
| Events in quadrant B | 7,400,684 | 319,116 |
| Events in quadrant C | 3,189,393 | 479,255 |
| Events in quadrant D | 4,147,582 | 467,365 |
| Mode M9 | |||
|---|---|---|---|
| Quadrant | BADHDUFLAG | Total packets | Discarded packets |
| A | 0 | 13 | 0 |
| B | 0 | 13 | 0 |
| C | 0 | 13 | 0 |
| D | 0 | 13 | 0 |
| Mode M0 | |||
|---|---|---|---|
| Quadrant | BADHDUFLAG | Total packets | Discarded packets |
| A | 0 | 12324 | 0 |
| B | 0 | 25388 | 0 |
| C | 0 | 12809 | 0 |
| D | 0 | 15843 | 0 |
| Quadrant | Total seconds | Saturated seconds | Saturation percentage |
|---|---|---|---|
| A | 5339 | 75 | 1.404757% |
| B | 5339 | 2036 | 38.134482% |
| C | 5339 | 114 | 2.135231% |
| D | 5339 | 248 | 4.645065% |
Noise dominated data is calculated using 1-second bins in cleaned event files. If a bin has >2000 counts, and if more than 50% of those come from <1% of pixels, then it is considered to be noise-dominated and hence unusable.
| Quadrant | # 1 sec bins | Bins with >0 counts | Bins with >2000 counts | High rate bins dominated by noise | Noise dominated (total time) | Noise dominated (detector-on time) | Marked lightcurve |
|---|---|---|---|---|---|---|---|
| A | 6619 | 5340 | 0 | 0 | 0.00% | 0.00% | 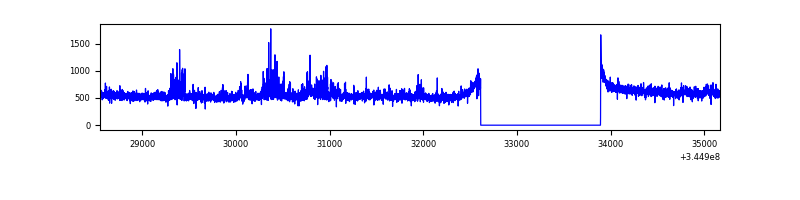 |
| B | 6619 | 5339 | 1812 | 1812 | 27.38% | 33.94% | 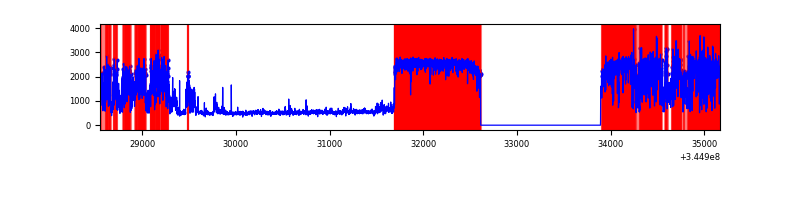 |
| C | 6619 | 5340 | 3 | 3 | 0.05% | 0.06% | 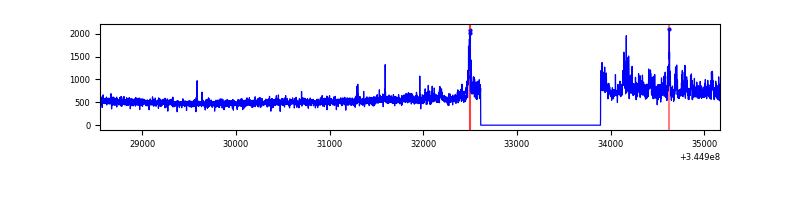 |
| D | 6619 | 5339 | 188 | 188 | 2.84% | 3.52% | 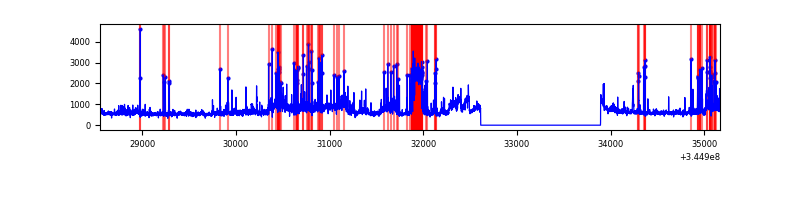 |
Top three noisy pixels from each quadrant. If the there are fewer than three noisy pixels in the level2.evt file, extra rows are filled as -1
| Pixel properties | Quadrant properties | ||||||
|---|---|---|---|---|---|---|---|
| Quadrant | DetID | PixID | Counts | Sigma | Mean | Median | Sigma |
| A | 0 | 13 | 133251 | 902.9 | 739 | 728 | 146.8 |
| A | 6 | 16 | 58883 | 396.22 | 739 | 728 | 146.8 |
| A | 13 | 254 | 8891 | 55.62 | 739 | 728 | 146.8 |
| B | 10 | 245 | 5162174 | 49128.09 | 561 | 549 | 105.1 |
| B | 12 | 111 | 12111 | 110.05 | 561 | 549 | 105.1 |
| B | 11 | 111 | 10946 | 98.96 | 561 | 549 | 105.1 |
| C | 3 | 233 | 380261 | 2396.56 | 689 | 695 | 158.4 |
| C | 14 | 238 | 113653 | 713.21 | 689 | 695 | 158.4 |
| C | 15 | 208 | 8450 | 48.96 | 689 | 695 | 158.4 |
| D | 8 | 195 | 707542 | 4281.5 | 699 | 682 | 165.1 |
| D | 2 | 250 | 333778 | 2017.59 | 699 | 682 | 165.1 |
| D | 1 | 52 | 307325 | 1857.36 | 699 | 682 | 165.1 |
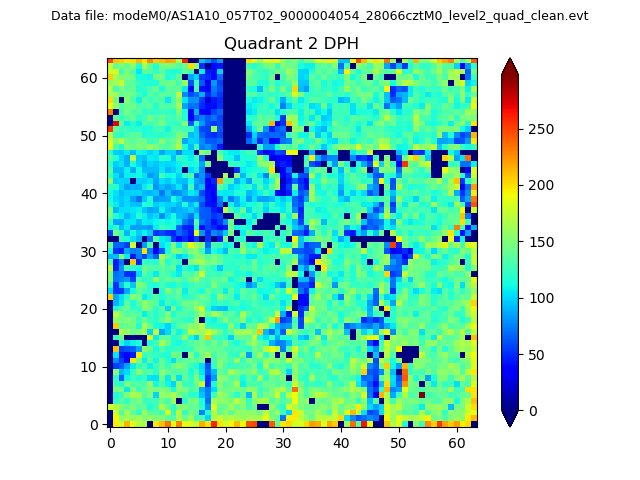
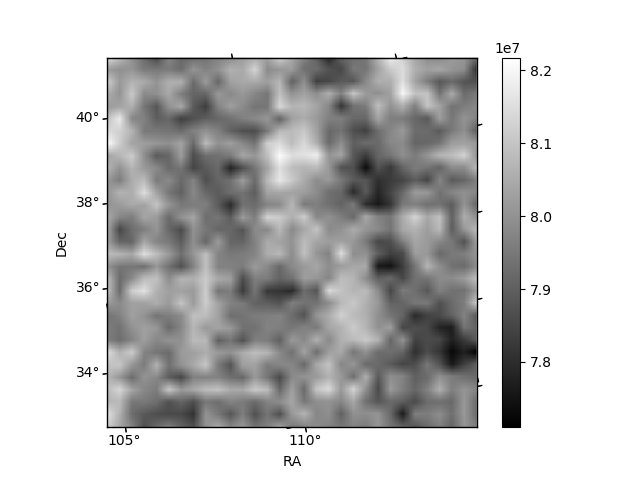
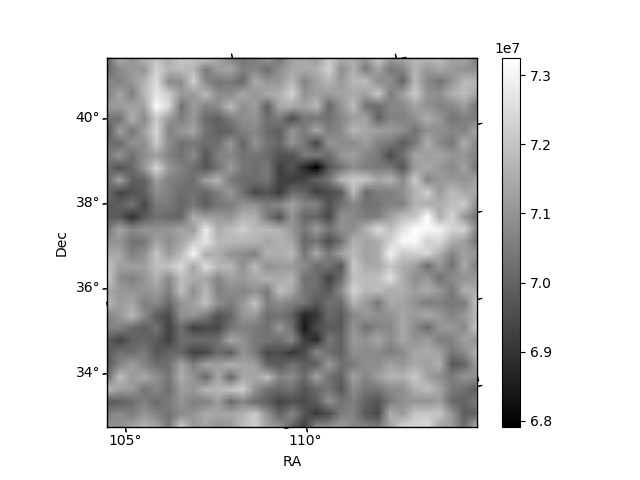
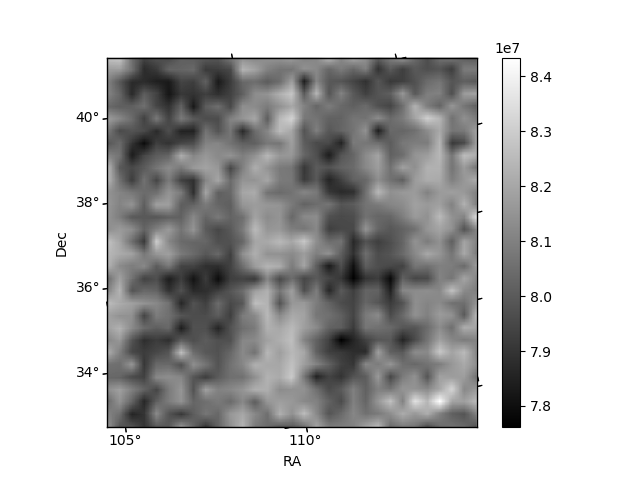
Histogram calculated using DETX and DETY for each event in the final _common_clean file
| Quadrant A |  |
 |
Quadrant B |
|---|---|---|---|
| Quadrant D | 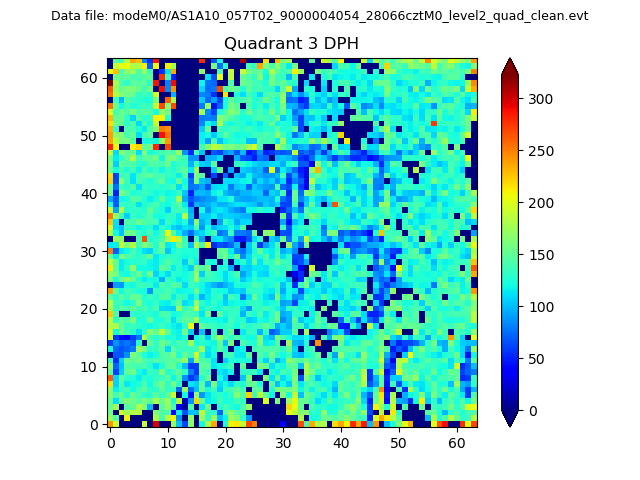 |
 |
Quadrant C |
| Plot type | Count rate plots | Images |
|---|---|---|
| Comparison with Poisson distribution Blue bars denote a histogram of data divided into 1 sec bins. Red curve is a Poisson curve with rate = median count rate of data. |
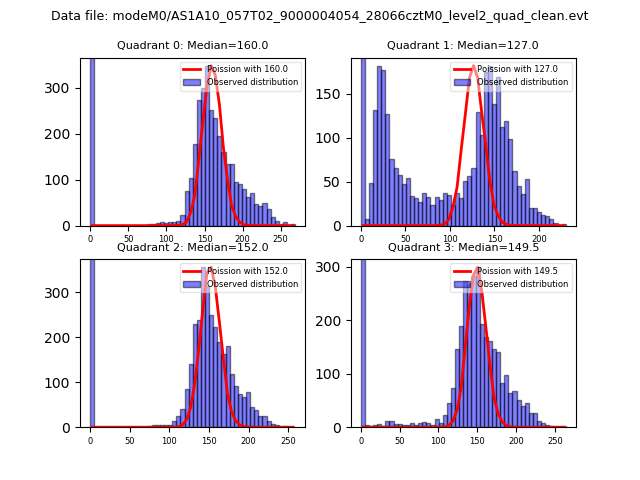 |
 |
| Quadrant-wise count rates Data is divided into 100 sec bins |
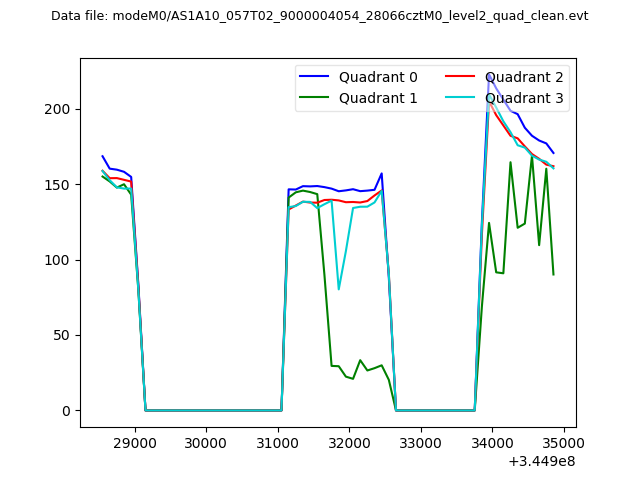 |
|
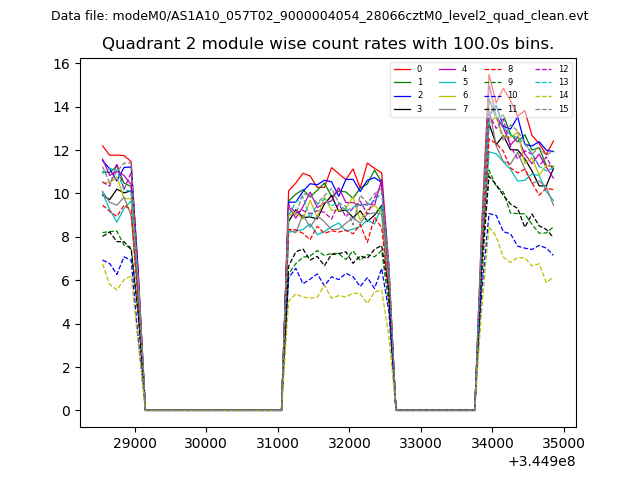
| Module-wise count rates for Quadrant A Data is divided into 100 sec bins |
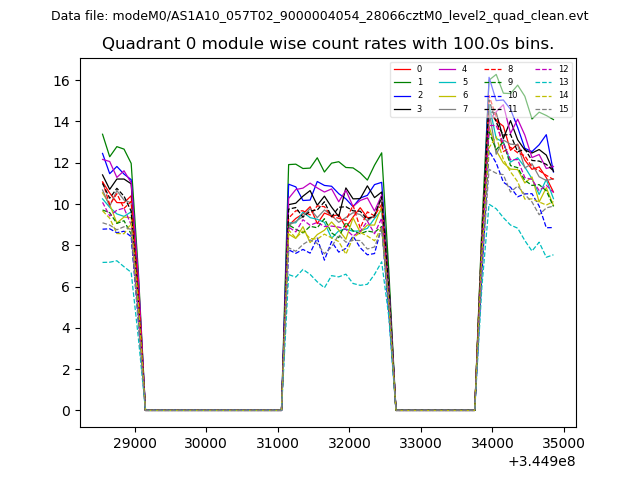 |
 |
| Module-wise count rates for Quadrant B Data is divided into 100 sec bins |
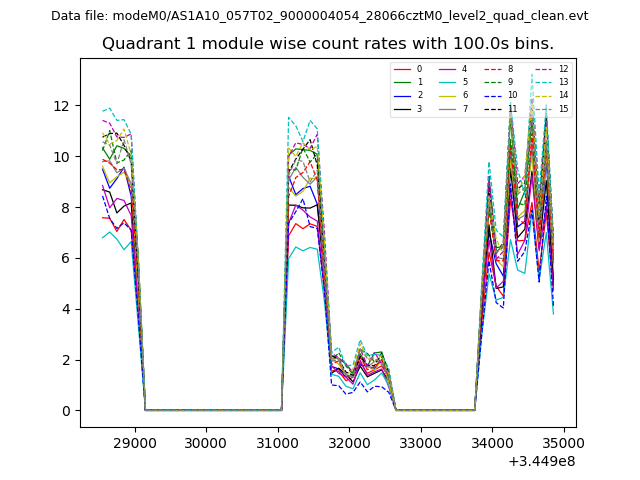 |
 |
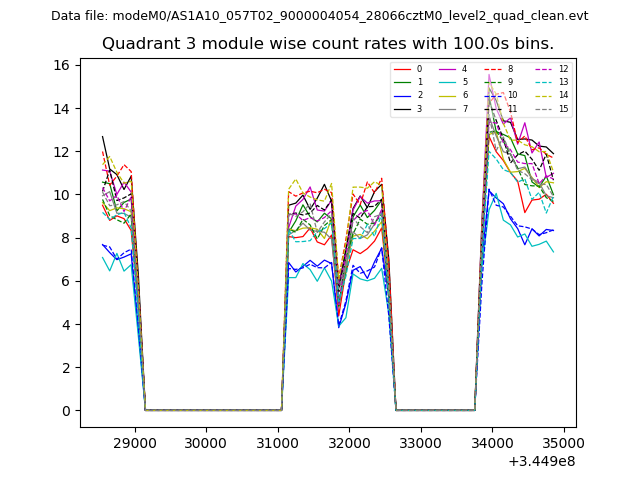
| Module-wise count rates for Quadrant C Data is divided into 100 sec bins |
 |
 |
| Module-wise count rates for Quadrant D Data is divided into 100 sec bins |
 |
 |
| Parameter | Plot |
|---|---|
| CZT HV Monitor | 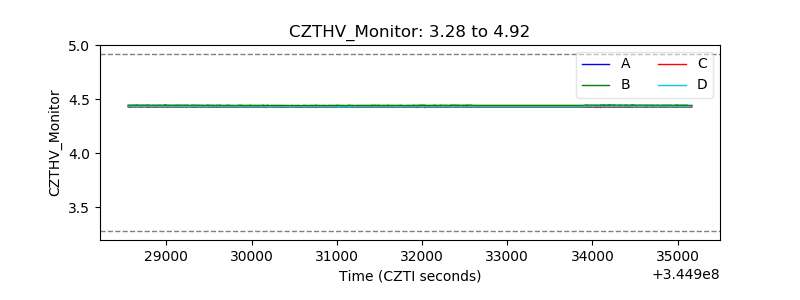 |
| D_VDD | 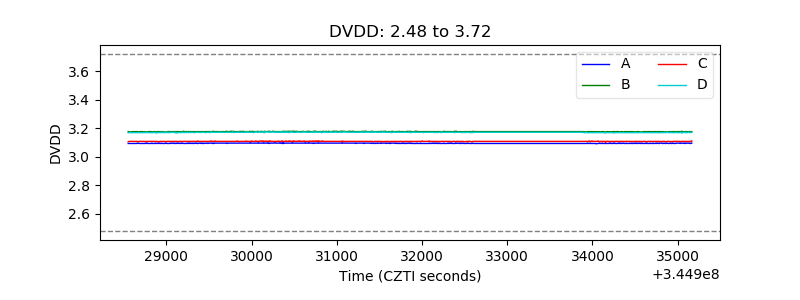 |
| Temperature 1 | 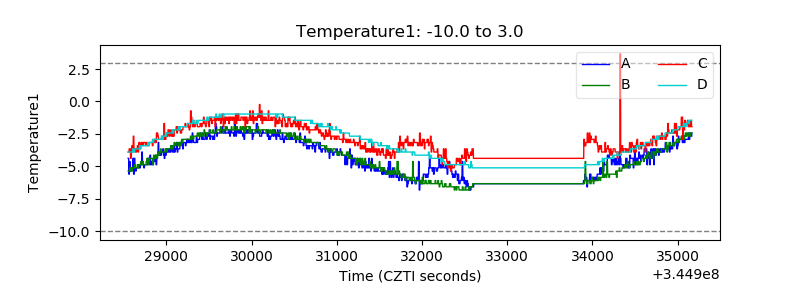 |
| Veto HV Monitor | 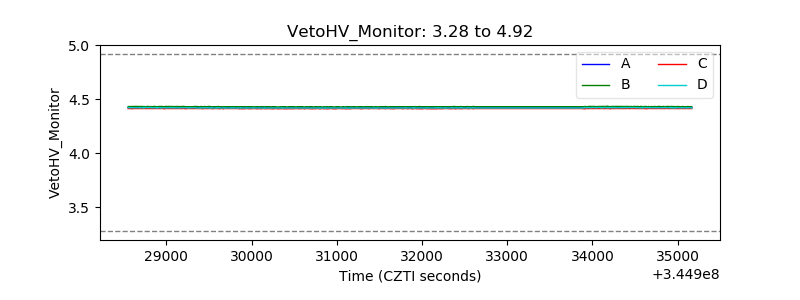 |
| Veto LLD | 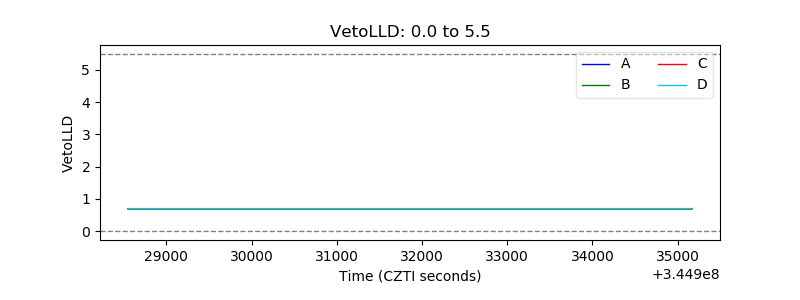 |
| Alpha Counter | 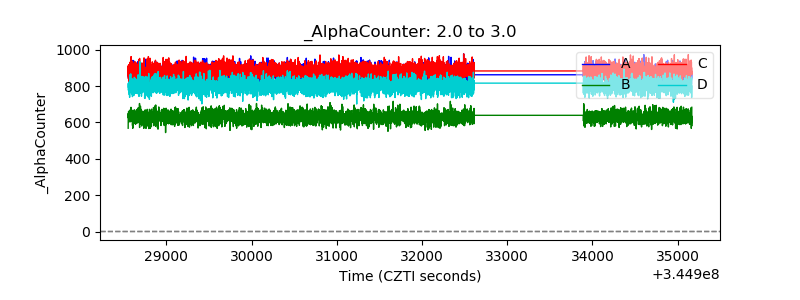 |
| _CPM_Rate | 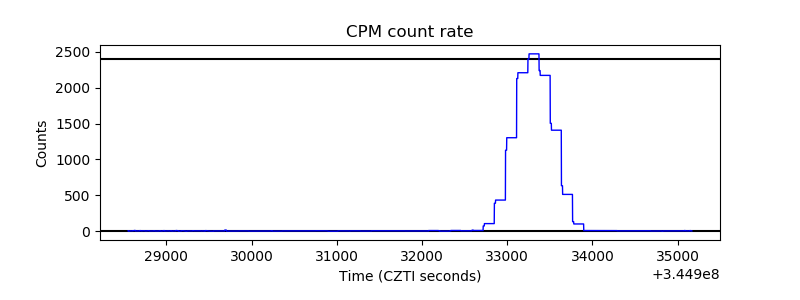 |
| CZT Counter | 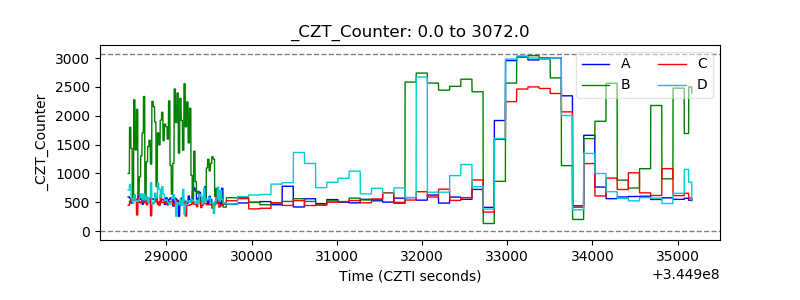 |
| +2.5 Volts monitor |  |
| +5 Volts monitor | 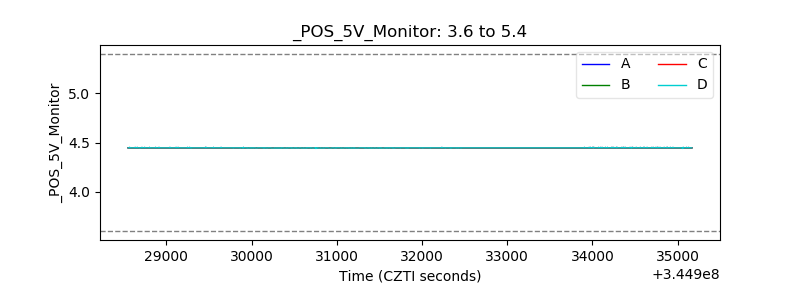 |
| _ROLL_ROT | 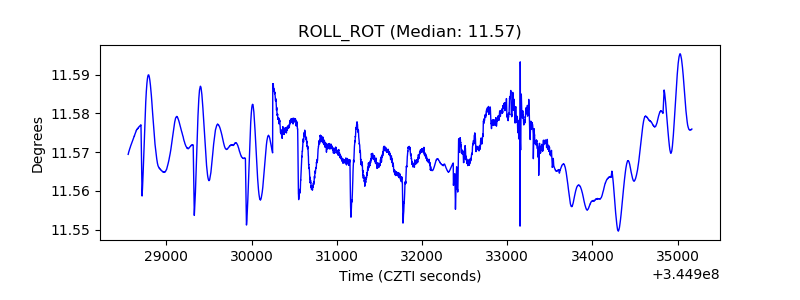 |
| _Roll_DEC | 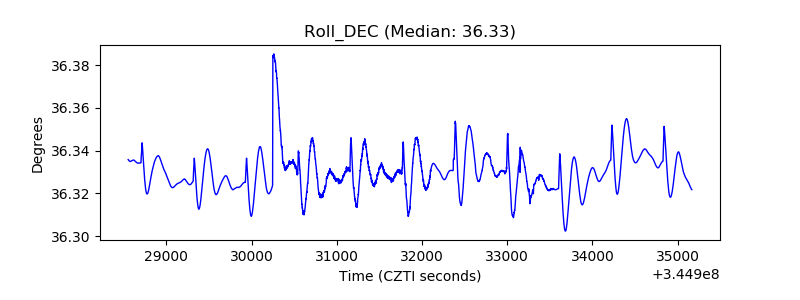 |
| _Roll_RA | 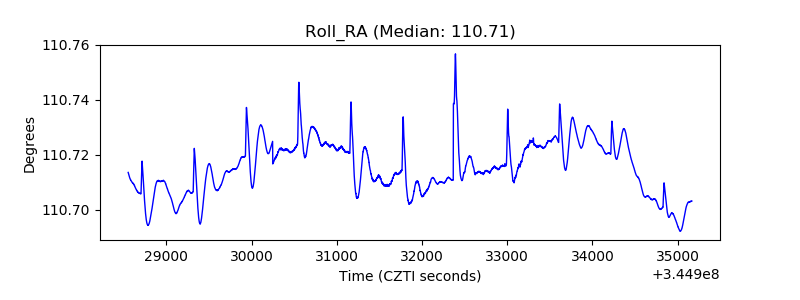 |
| Veto Counter | 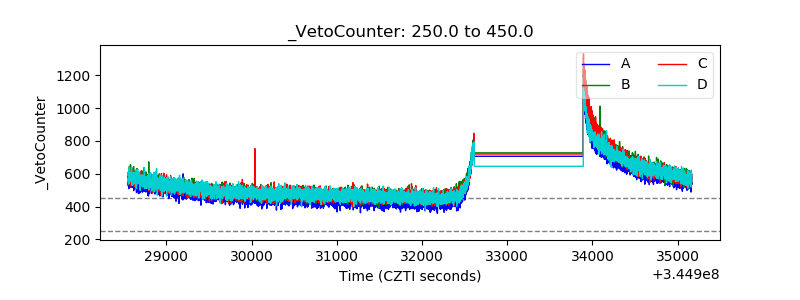 |