| Param | Original file | Final file |
|---|---|---|
| Filename | modeM0/AS1A10_057T02_9000004054_28067cztM0_level2.evt | modeM0/AS1A10_057T02_9000004054_28067cztM0_level2_quad_clean.evt |
| Size (bytes) | 856,033,920 | 82,612,800 |
| Size | 816.4 MB | 78.8 MB |
| Events in quadrant A | 3,733,653 | 575,282 |
| Events in quadrant B | 9,464,135 | 442,826 |
| Events in quadrant C | 6,436,711 | 516,229 |
| Events in quadrant D | 5,860,299 | 520,059 |
| Mode M9 | |||
|---|---|---|---|
| Quadrant | BADHDUFLAG | Total packets | Discarded packets |
| A | 0 | 13 | 0 |
| B | 0 | 13 | 0 |
| C | 0 | 13 | 0 |
| D | 0 | 13 | 0 |
| Mode M0 | |||
|---|---|---|---|
| Quadrant | BADHDUFLAG | Total packets | Discarded packets |
| A | 0 | 15211 | 0 |
| B | 0 | 32463 | 0 |
| C | 0 | 23798 | 0 |
| D | 0 | 21887 | 0 |
| Quadrant | Total seconds | Saturated seconds | Saturation percentage |
|---|---|---|---|
| A | 6392 | 101 | 1.580100% |
| B | 6393 | 2656 | 41.545440% |
| C | 6393 | 598 | 9.353981% |
| D | 6393 | 526 | 8.227749% |
Noise dominated data is calculated using 1-second bins in cleaned event files. If a bin has >2000 counts, and if more than 50% of those come from <1% of pixels, then it is considered to be noise-dominated and hence unusable.
| Quadrant | # 1 sec bins | Bins with >0 counts | Bins with >2000 counts | High rate bins dominated by noise | Noise dominated (total time) | Noise dominated (detector-on time) | Marked lightcurve |
|---|---|---|---|---|---|---|---|
| A | 7692 | 6392 | 1 | 1 | 0.01% | 0.02% | 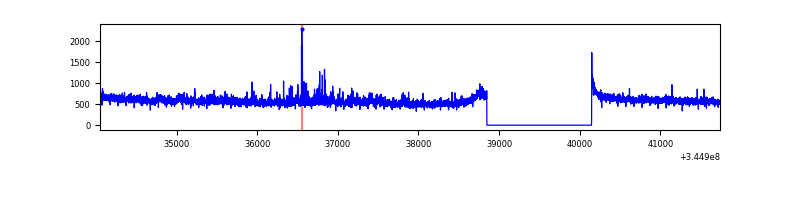 |
| B | 7693 | 6393 | 2152 | 2152 | 27.97% | 33.66% | 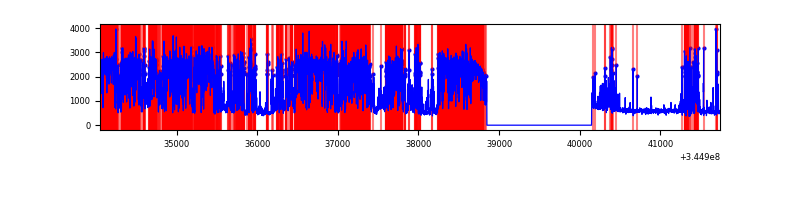 |
| C | 7693 | 6393 | 179 | 179 | 2.33% | 2.80% | 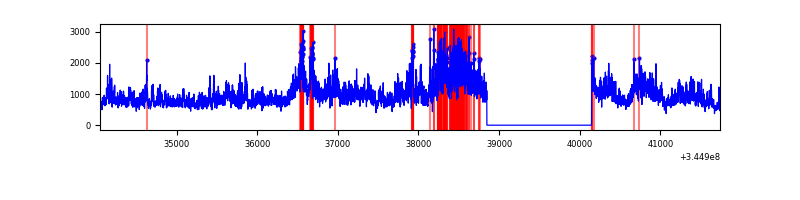 |
| D | 7693 | 6393 | 421 | 421 | 5.47% | 6.59% | 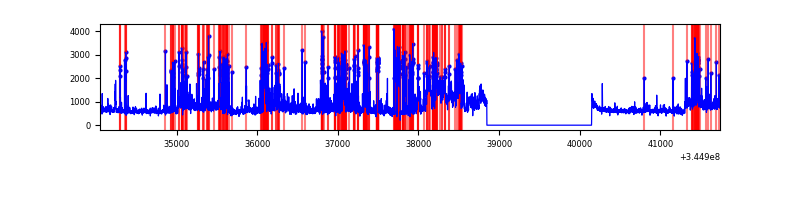 |
Top three noisy pixels from each quadrant. If the there are fewer than three noisy pixels in the level2.evt file, extra rows are filled as -1
| Pixel properties | Quadrant properties | ||||||
|---|---|---|---|---|---|---|---|
| Quadrant | DetID | PixID | Counts | Sigma | Mean | Median | Sigma |
| A | 0 | 13 | 207982 | 1159.74 | 909 | 896 | 178.6 |
| A | 12 | 96 | 13604 | 71.17 | 909 | 896 | 178.6 |
| A | 13 | 254 | 10680 | 54.79 | 909 | 896 | 178.6 |
| B | 10 | 245 | 6520994 | 47415.02 | 738 | 722 | 137.5 |
| B | 15 | 32 | 23837 | 168.09 | 738 | 722 | 137.5 |
| B | 12 | 111 | 15552 | 107.84 | 738 | 722 | 137.5 |
| C | 3 | 233 | 3067811 | 16194.95 | 829 | 835 | 189.4 |
| C | 14 | 238 | 136095 | 714.23 | 829 | 835 | 189.4 |
| C | 13 | 61 | 5632 | 25.33 | 829 | 835 | 189.4 |
| D | 1 | 52 | 1069364 | 5405.55 | 850 | 830 | 197.7 |
| D | 8 | 195 | 718409 | 3630.13 | 850 | 830 | 197.7 |
| D | 7 | 238 | 485727 | 2453.02 | 850 | 830 | 197.7 |
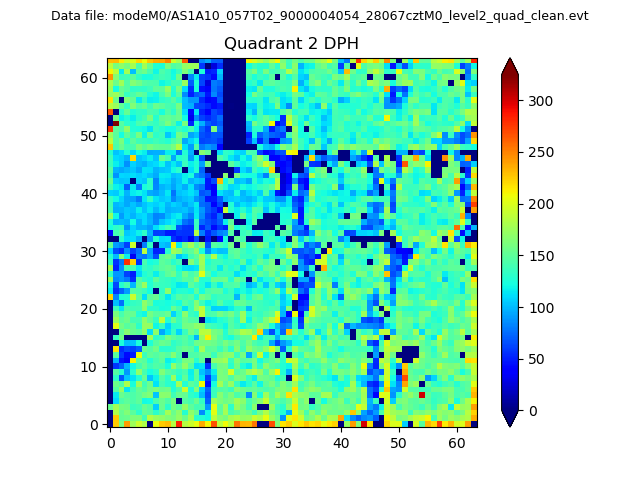
Histogram calculated using DETX and DETY for each event in the final _common_clean file
| Quadrant A |  |
 |
Quadrant B |
|---|---|---|---|
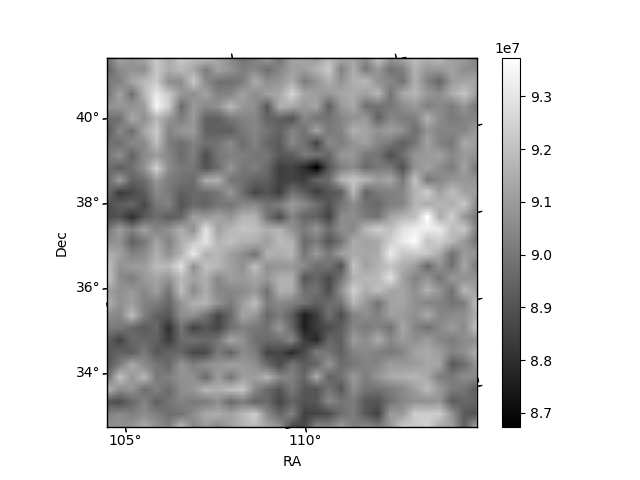
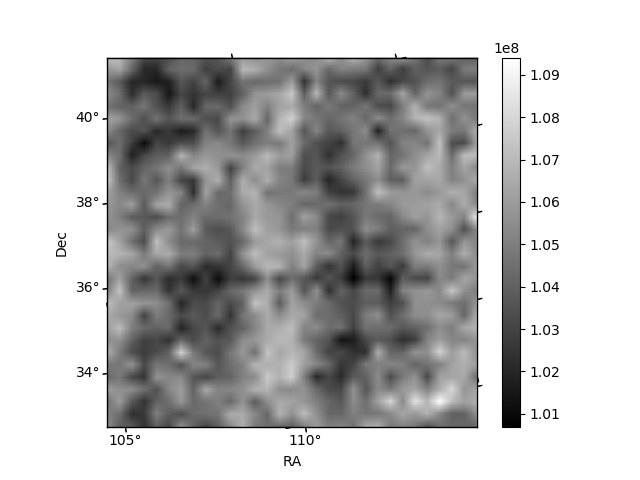
| Quadrant D | 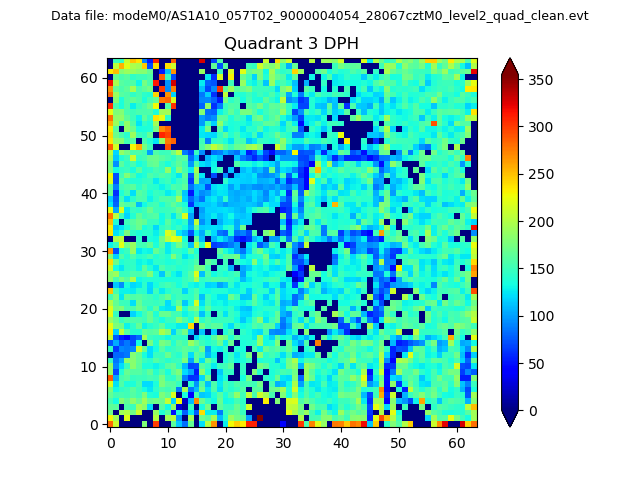 |
 |
Quadrant C |
| Plot type | Count rate plots | Images |
|---|---|---|
| Comparison with Poisson distribution Blue bars denote a histogram of data divided into 1 sec bins. Red curve is a Poisson curve with rate = median count rate of data. |
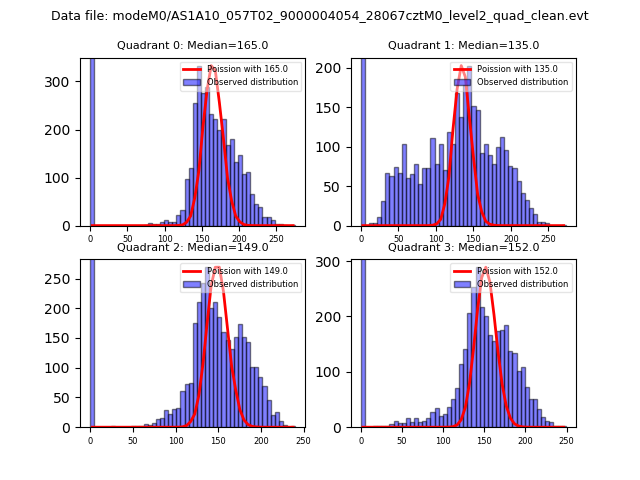 |
 |
| Quadrant-wise count rates Data is divided into 100 sec bins |
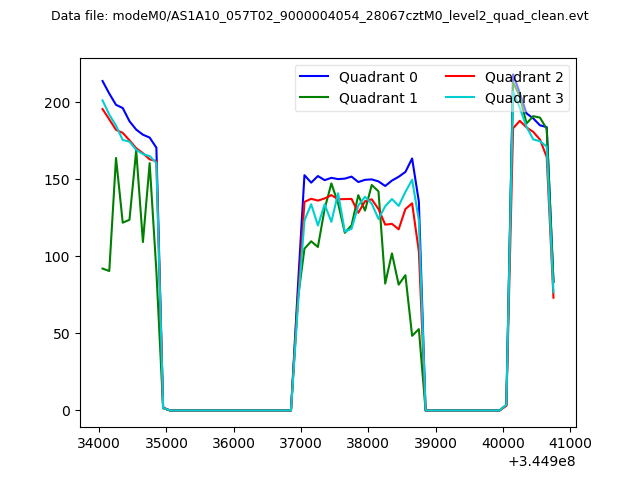 |
|
| Module-wise count rates for Quadrant A Data is divided into 100 sec bins |
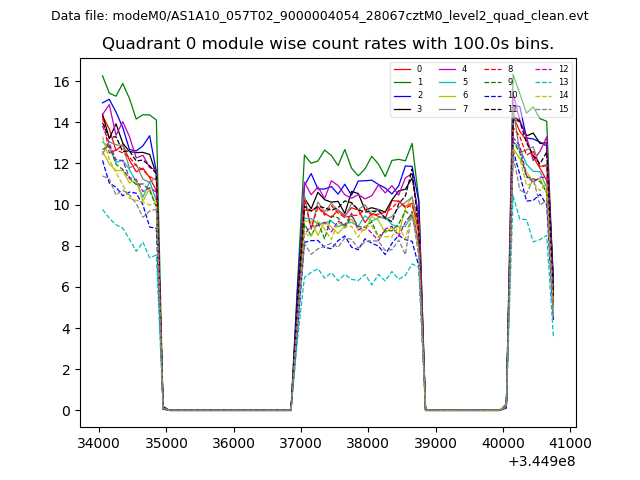 |
 |
| Module-wise count rates for Quadrant B Data is divided into 100 sec bins |
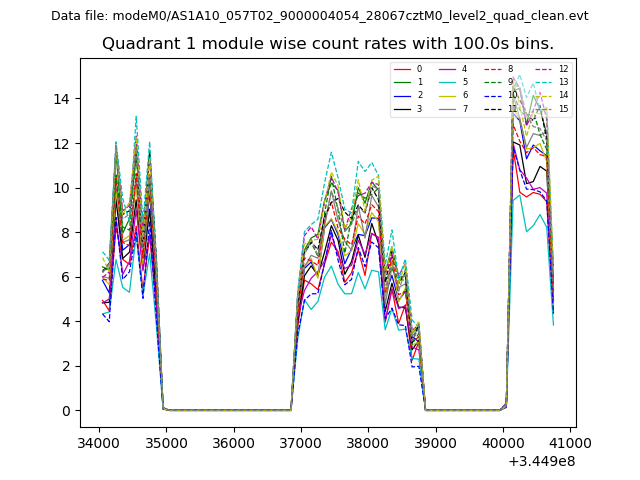 |
 |
| Module-wise count rates for Quadrant C Data is divided into 100 sec bins |
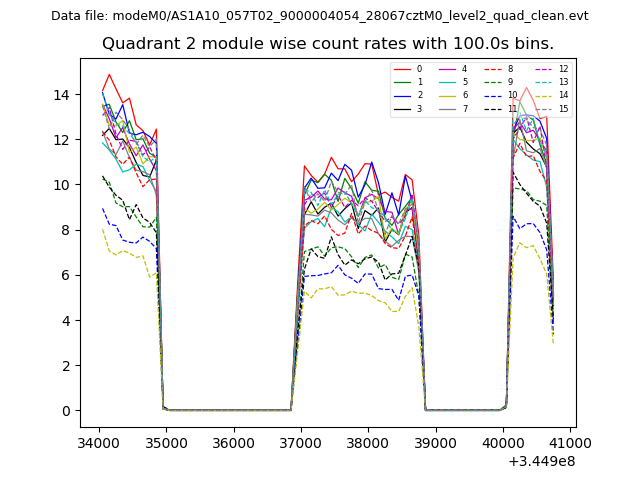 |
 |
| Module-wise count rates for Quadrant D Data is divided into 100 sec bins |
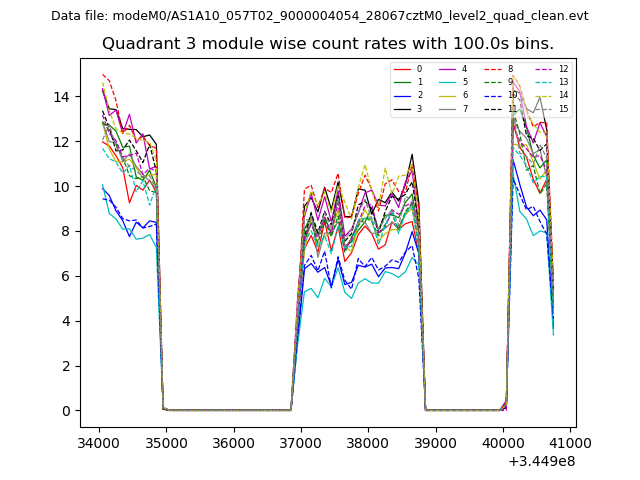 |
 |
| Parameter | Plot |
|---|---|
| CZT HV Monitor | 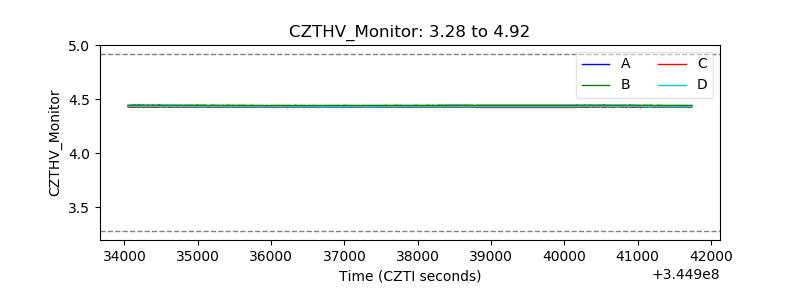 |
| D_VDD |  |
| Temperature 1 | 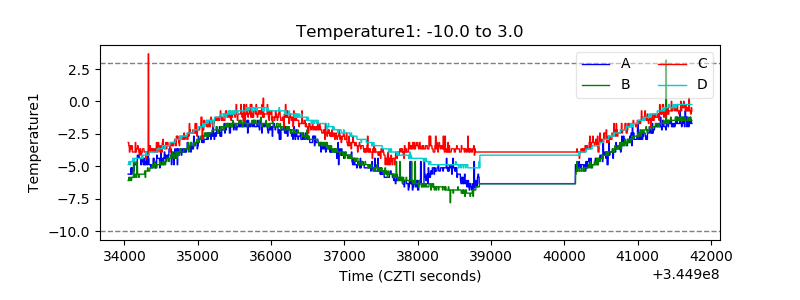 |
| Veto HV Monitor | 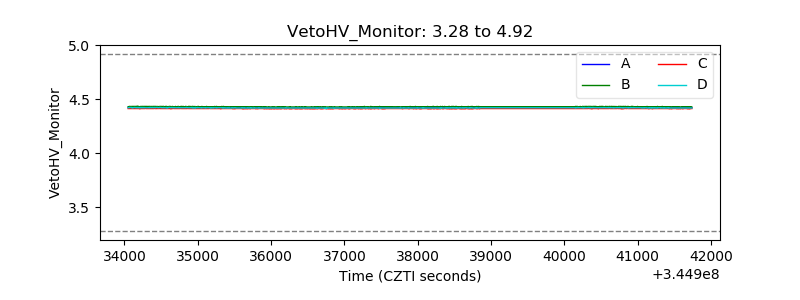 |
| Veto LLD | 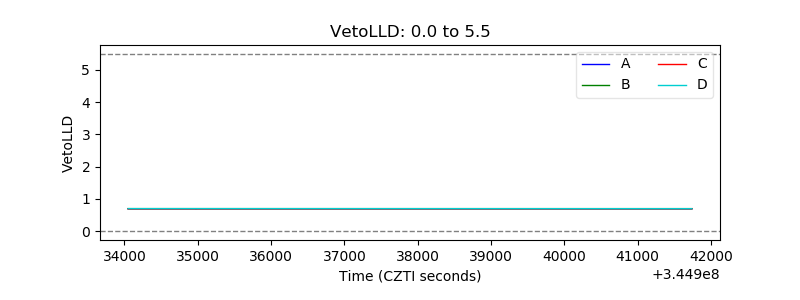 |
| Alpha Counter | 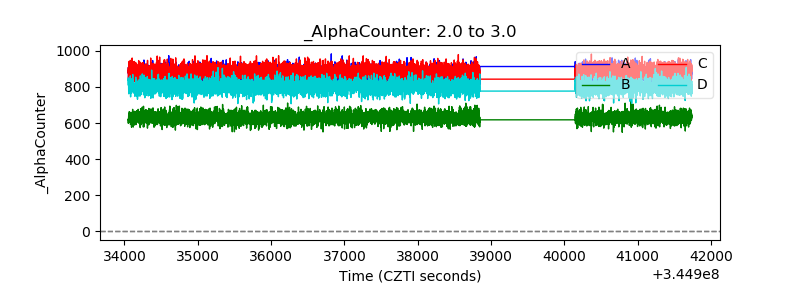 |
| _CPM_Rate | 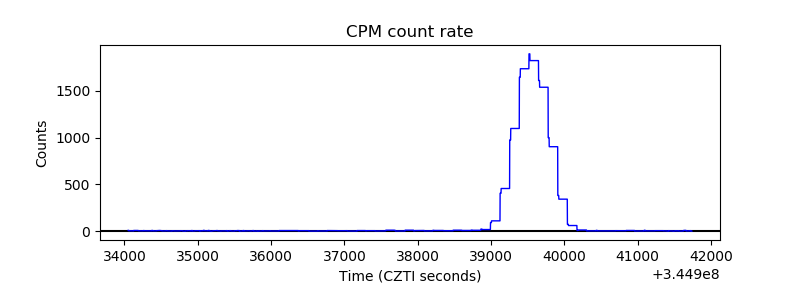 |
| CZT Counter | 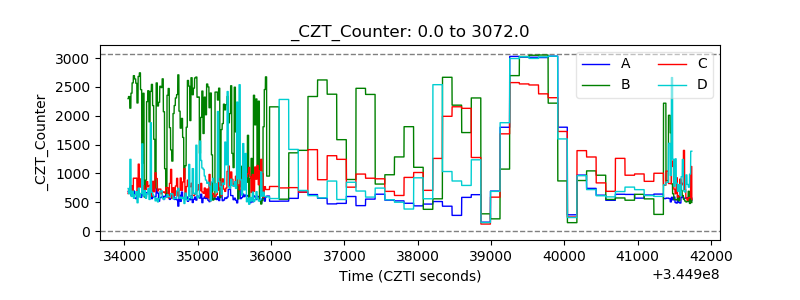 |
| +2.5 Volts monitor |  |
| +5 Volts monitor | 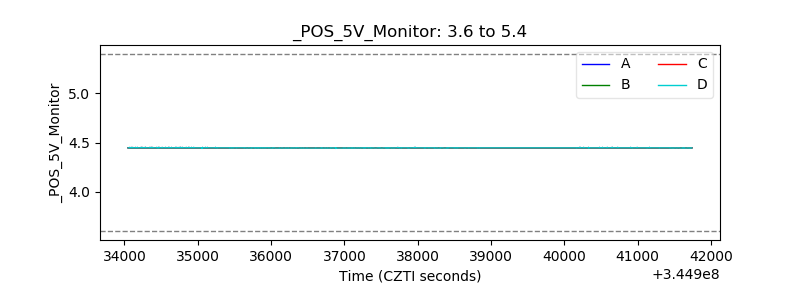 |
| _ROLL_ROT | 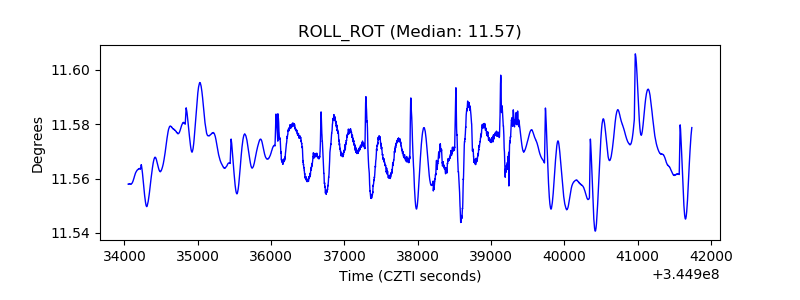 |
| _Roll_DEC | 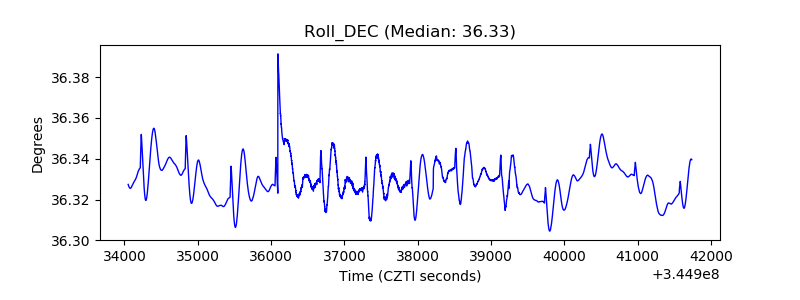 |
| _Roll_RA | 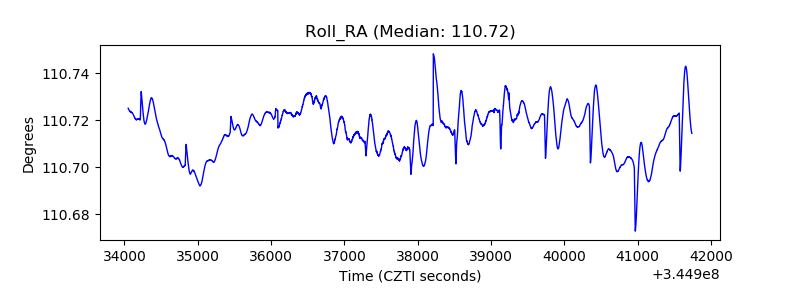 |
| Veto Counter | 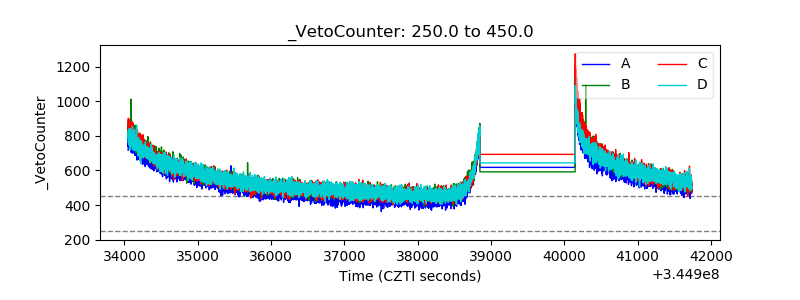 |