| Param | Original file | Final file |
|---|---|---|
| Filename | modeM0/AS1A10_057T02_9000004054_28068cztM0_level2.evt | modeM0/AS1A10_057T02_9000004054_28068cztM0_level2_quad_clean.evt |
| Size (bytes) | 667,673,280 | 69,480,000 |
| Size | 636.7 MB | 66.3 MB |
| Events in quadrant A | 3,374,683 | 439,758 |
| Events in quadrant B | 7,001,998 | 410,931 |
| Events in quadrant C | 4,264,261 | 413,286 |
| Events in quadrant D | 5,162,825 | 409,093 |
| Mode M9 | |||
|---|---|---|---|
| Quadrant | BADHDUFLAG | Total packets | Discarded packets |
| A | 0 | 13 | 0 |
| B | 0 | 13 | 0 |
| C | 0 | 13 | 0 |
| D | 0 | 13 | 0 |
| Mode M0 | |||
|---|---|---|---|
| Quadrant | BADHDUFLAG | Total packets | Discarded packets |
| A | 0 | 13564 | 0 |
| B | 0 | 24913 | 0 |
| C | 0 | 16760 | 0 |
| D | 0 | 19778 | 0 |
| Quadrant | Total seconds | Saturated seconds | Saturation percentage |
|---|---|---|---|
| A | 6170 | 105 | 1.701783% |
| B | 6171 | 1586 | 25.700859% |
| C | 6170 | 192 | 3.111831% |
| D | 6170 | 394 | 6.385737% |
Noise dominated data is calculated using 1-second bins in cleaned event files. If a bin has >2000 counts, and if more than 50% of those come from <1% of pixels, then it is considered to be noise-dominated and hence unusable.
| Quadrant | # 1 sec bins | Bins with >0 counts | Bins with >2000 counts | High rate bins dominated by noise | Noise dominated (total time) | Noise dominated (detector-on time) | Marked lightcurve |
|---|---|---|---|---|---|---|---|
| A | 7435 | 6170 | 0 | 0 | 0.00% | 0.00% | 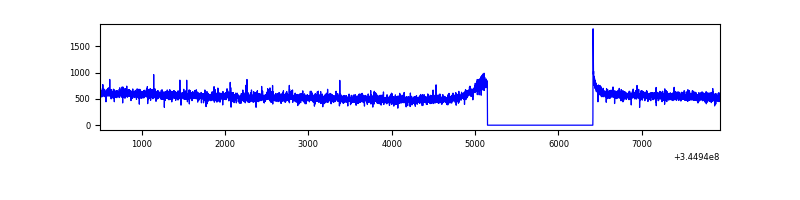 |
| B | 7436 | 6171 | 1099 | 1099 | 14.78% | 17.81% |  |
| C | 7435 | 6170 | 4 | 4 | 0.05% | 0.06% | 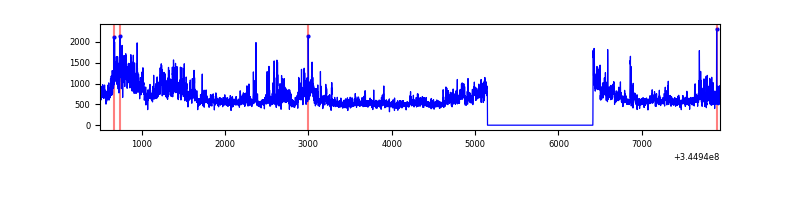 |
| D | 7434 | 6169 | 286 | 286 | 3.85% | 4.64% | 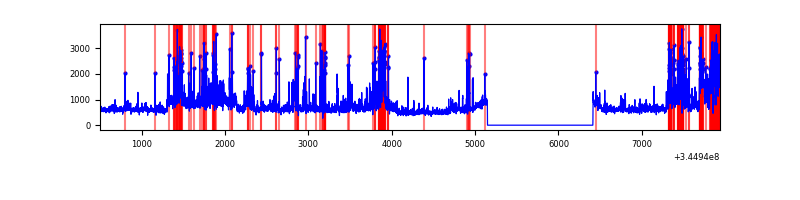 |
Top three noisy pixels from each quadrant. If the there are fewer than three noisy pixels in the level2.evt file, extra rows are filled as -1
| Pixel properties | Quadrant properties | ||||||
|---|---|---|---|---|---|---|---|
| Quadrant | DetID | PixID | Counts | Sigma | Mean | Median | Sigma |
| A | 0 | 13 | 87954 | 517.28 | 851 | 837 | 168.4 |
| A | 13 | 254 | 10747 | 58.84 | 851 | 837 | 168.4 |
| A | 3 | 137 | 7546 | 39.84 | 851 | 837 | 168.4 |
| B | 10 | 245 | 3932155 | 27924.2 | 762 | 745 | 140.8 |
| B | 4 | 52 | 19876 | 135.88 | 762 | 745 | 140.8 |
| B | 0 | 229 | 18913 | 129.04 | 762 | 745 | 140.8 |
| C | 3 | 233 | 1018738 | 5577.12 | 798 | 802 | 182.5 |
| C | 14 | 238 | 132598 | 722.09 | 798 | 802 | 182.5 |
| C | 13 | 61 | 5510 | 25.79 | 798 | 802 | 182.5 |
| D | 1 | 52 | 825204 | 4291.07 | 808 | 787 | 192.1 |
| D | 8 | 195 | 790528 | 4110.58 | 808 | 787 | 192.1 |
| D | 2 | 250 | 322970 | 1676.96 | 808 | 787 | 192.1 |
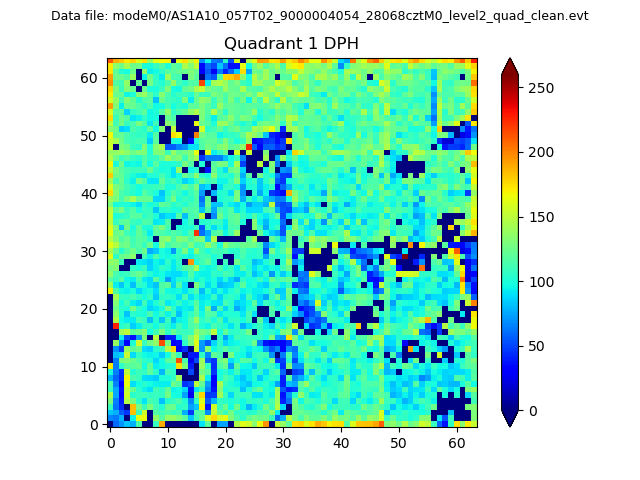
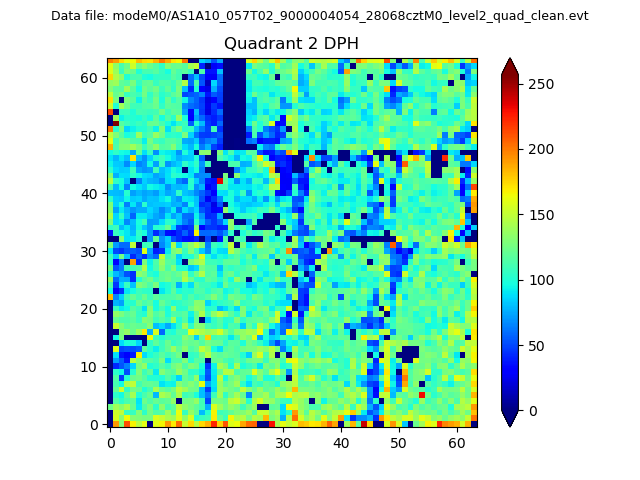
Histogram calculated using DETX and DETY for each event in the final _common_clean file
| Quadrant A | 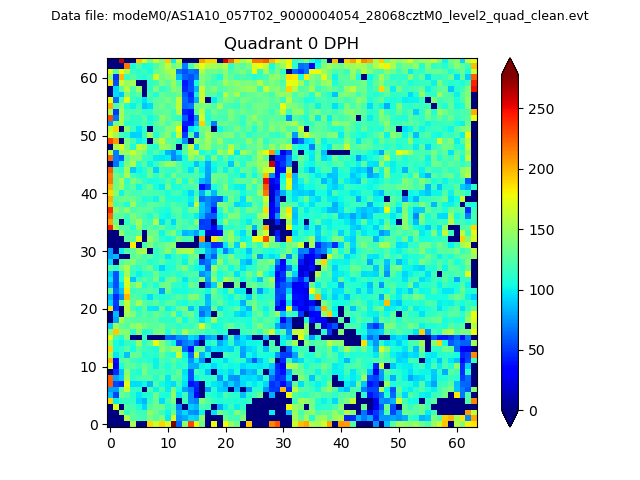 |
 |
Quadrant B |
|---|---|---|---|
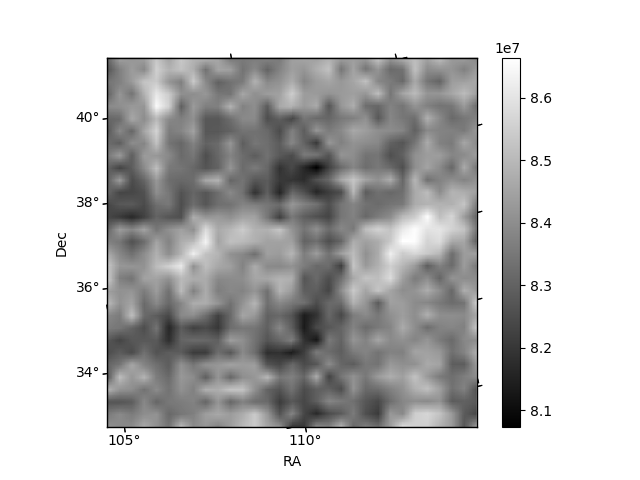
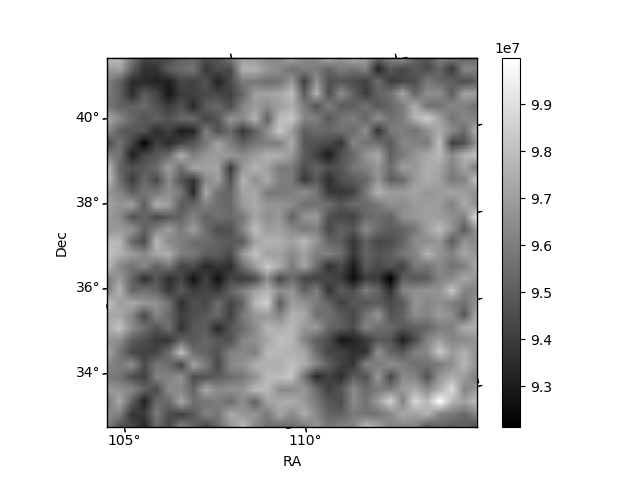
| Quadrant D | 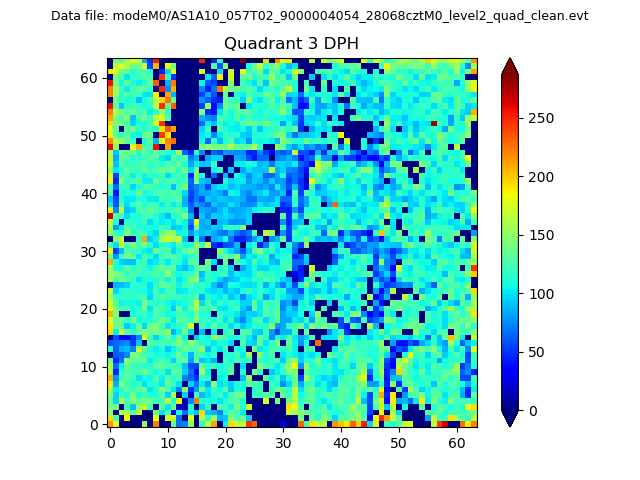 |
 |
Quadrant C |
| Plot type | Count rate plots | Images |
|---|---|---|
| Comparison with Poisson distribution Blue bars denote a histogram of data divided into 1 sec bins. Red curve is a Poisson curve with rate = median count rate of data. |
 |
 |
| Quadrant-wise count rates Data is divided into 100 sec bins |
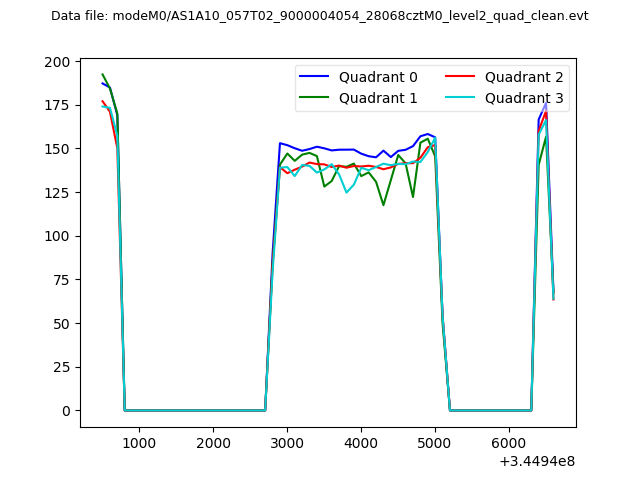 |
|
| Module-wise count rates for Quadrant A Data is divided into 100 sec bins |
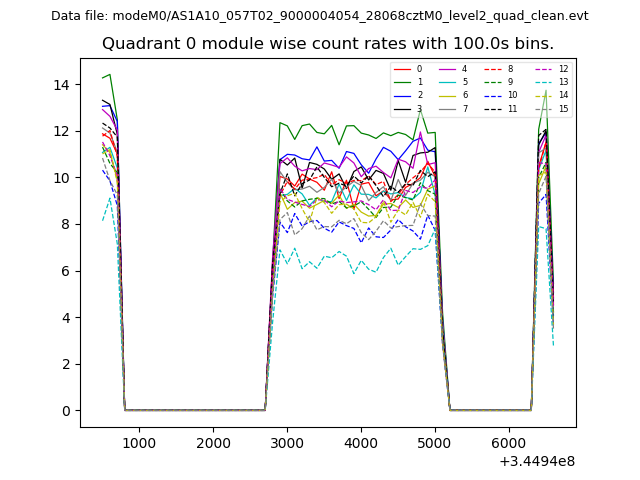 |
 |
| Module-wise count rates for Quadrant B Data is divided into 100 sec bins |
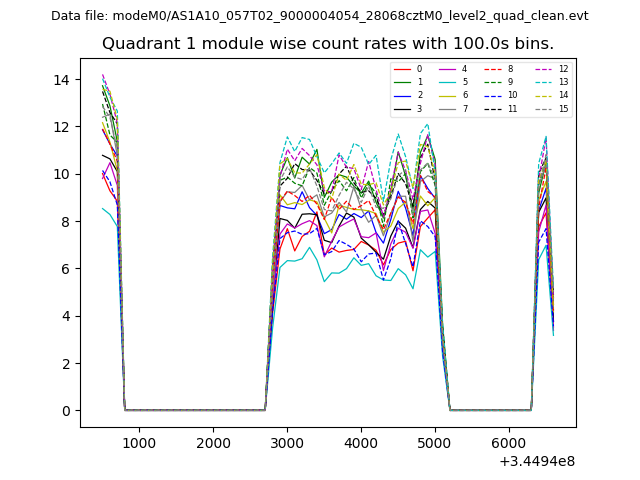 |
 |
| Module-wise count rates for Quadrant C Data is divided into 100 sec bins |
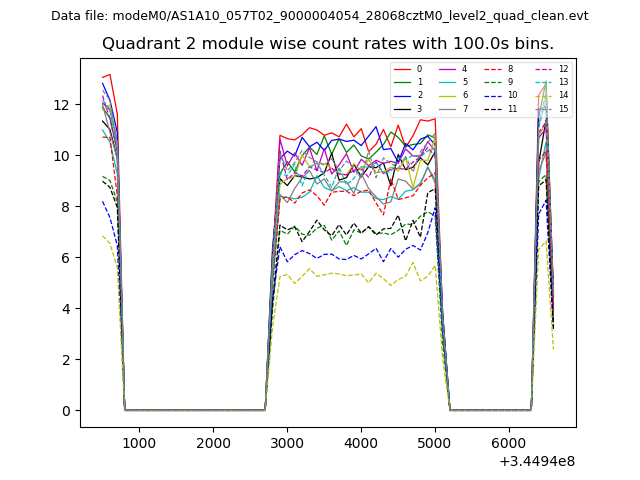 |
 |
| Module-wise count rates for Quadrant D Data is divided into 100 sec bins |
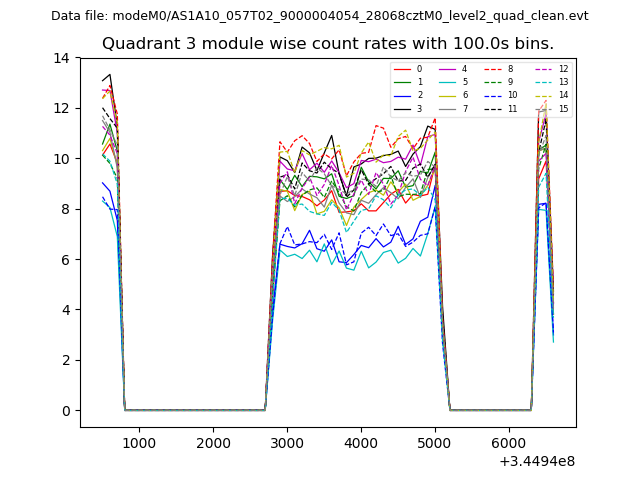 |
 |
| Parameter | Plot |
|---|---|
| CZT HV Monitor | 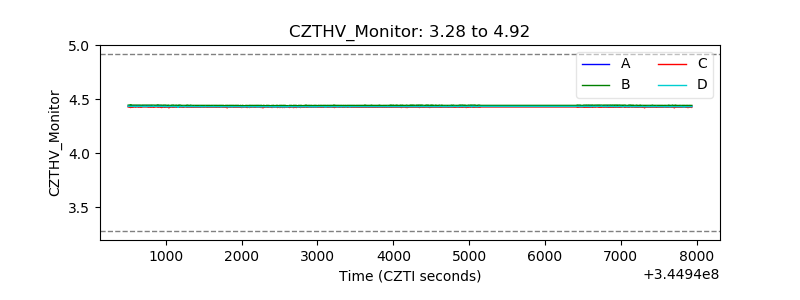 |
| D_VDD |  |
| Temperature 1 | 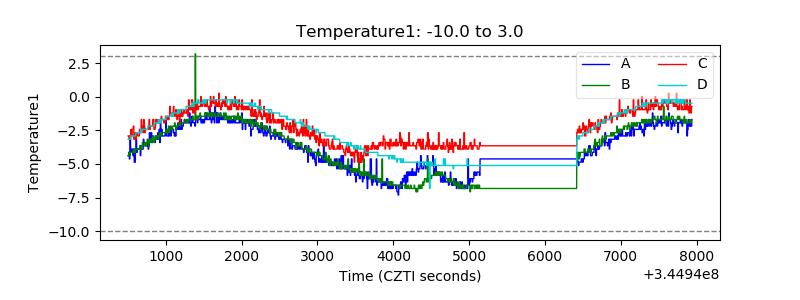 |
| Veto HV Monitor | 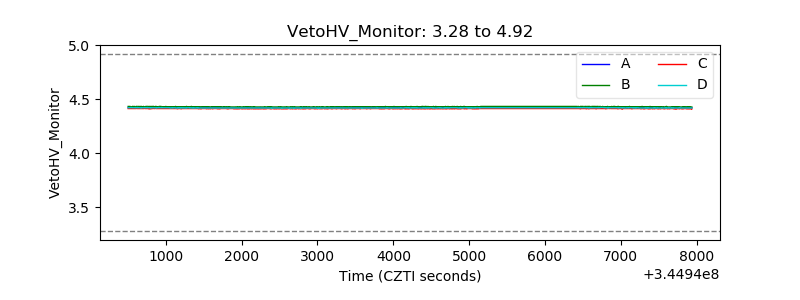 |
| Veto LLD | 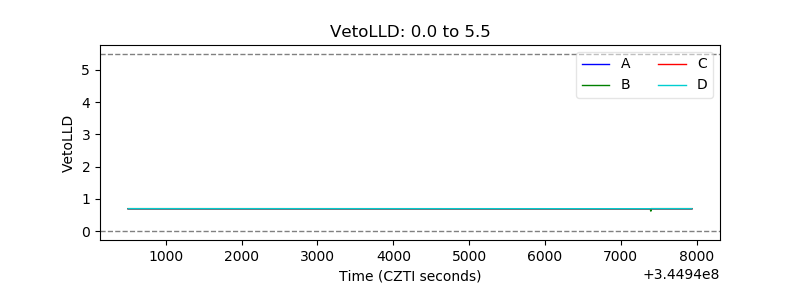 |
| Alpha Counter | 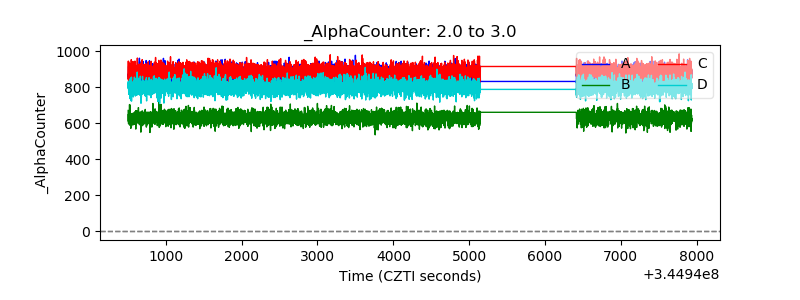 |
| _CPM_Rate | 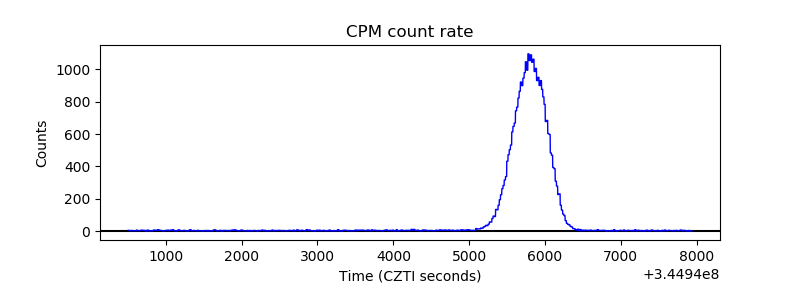 |
| CZT Counter | 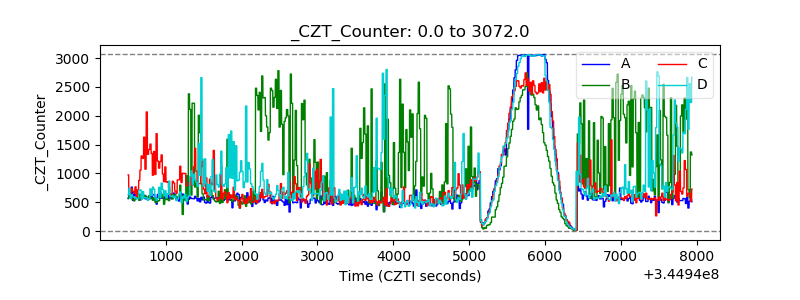 |
| +2.5 Volts monitor |  |
| +5 Volts monitor |  |
| _ROLL_ROT | 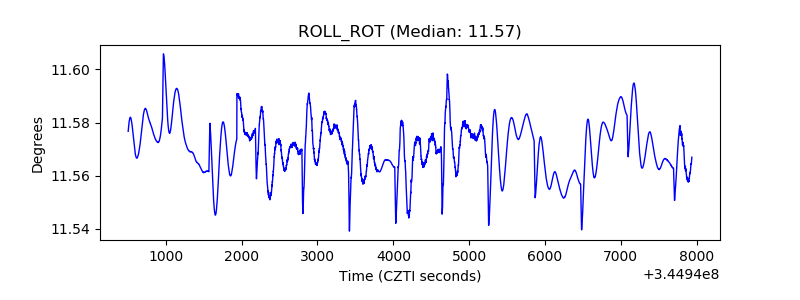 |
| _Roll_DEC | 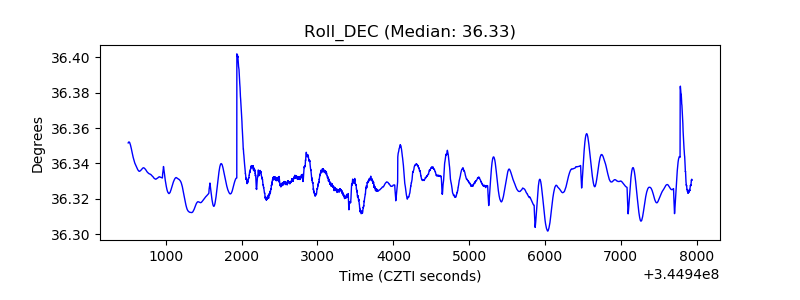 |
| _Roll_RA | 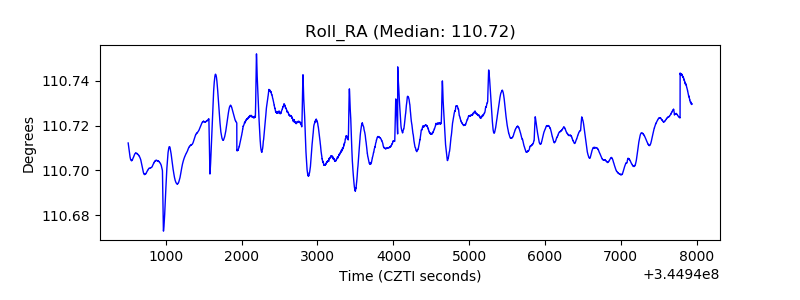 |
| Veto Counter | 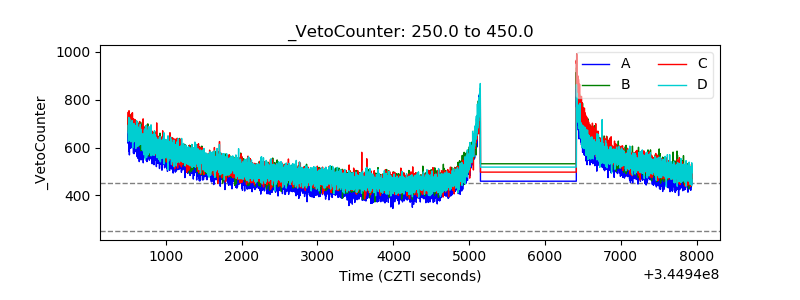 |