| Param | Original file | Final file |
|---|---|---|
| Filename | modeM0/AS1A10_057T02_9000004054_28069cztM0_level2.evt | modeM0/AS1A10_057T02_9000004054_28069cztM0_level2_quad_clean.evt |
| Size (bytes) | 503,697,600 | 46,157,760 |
| Size | 480.4 MB | 44.0 MB |
| Events in quadrant A | 2,089,949 | 298,436 |
| Events in quadrant B | 5,953,482 | 263,722 |
| Events in quadrant C | 2,598,067 | 280,662 |
| Events in quadrant D | 4,336,258 | 266,266 |
| Mode M9 | |||
|---|---|---|---|
| Quadrant | BADHDUFLAG | Total packets | Discarded packets |
| A | 0 | 3 | 0 |
| B | 0 | 4 | 0 |
| C | 0 | 4 | 0 |
| D | 0 | 4 | 0 |
| Mode M0 | |||
|---|---|---|---|
| Quadrant | BADHDUFLAG | Total packets | Discarded packets |
| A | 0 | 8598 | 0 |
| B | 0 | 20498 | 0 |
| C | 0 | 10431 | 0 |
| D | 0 | 15786 | 0 |
| Quadrant | Total seconds | Saturated seconds | Saturation percentage |
|---|---|---|---|
| A | 4083 | 10 | 0.244918% |
| B | 4083 | 1515 | 37.105070% |
| C | 4083 | 55 | 1.347049% |
| D | 4083 | 526 | 12.882684% |
Noise dominated data is calculated using 1-second bins in cleaned event files. If a bin has >2000 counts, and if more than 50% of those come from <1% of pixels, then it is considered to be noise-dominated and hence unusable.
| Quadrant | # 1 sec bins | Bins with >0 counts | Bins with >2000 counts | High rate bins dominated by noise | Noise dominated (total time) | Noise dominated (detector-on time) | Marked lightcurve |
|---|---|---|---|---|---|---|---|
| A | 4083 | 4083 | 0 | 0 | 0.00% | 0.00% | 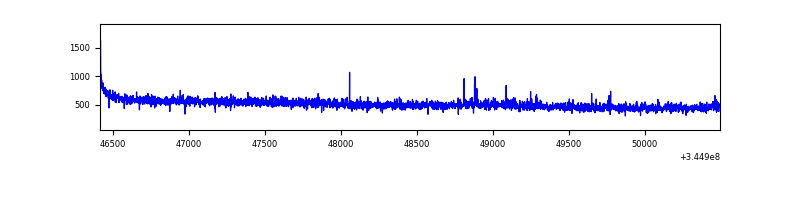 |
| B | 4083 | 4083 | 1153 | 1153 | 28.24% | 28.24% | 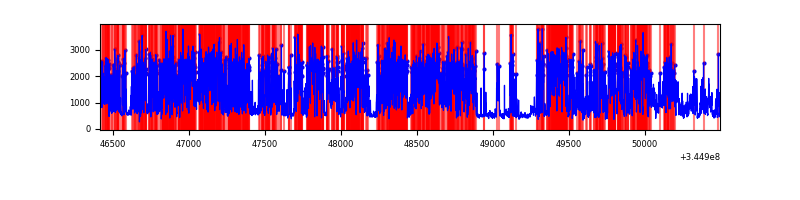 |
| C | 4083 | 4083 | 3 | 3 | 0.07% | 0.07% |  |
| D | 4083 | 4083 | 459 | 459 | 11.24% | 11.24% | 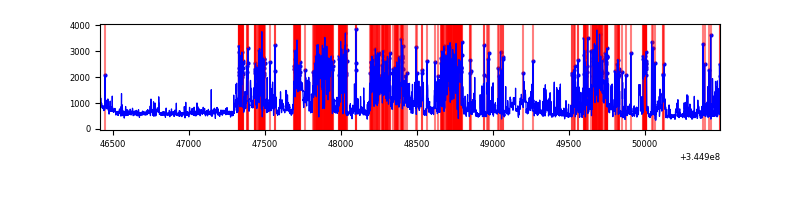 |
Top three noisy pixels from each quadrant. If the there are fewer than three noisy pixels in the level2.evt file, extra rows are filled as -1
| Pixel properties | Quadrant properties | ||||||
|---|---|---|---|---|---|---|---|
| Quadrant | DetID | PixID | Counts | Sigma | Mean | Median | Sigma |
| A | 0 | 13 | 39164 | 367.8 | 528 | 519 | 105.1 |
| A | 13 | 254 | 7312 | 64.65 | 528 | 519 | 105.1 |
| A | 8 | 192 | 4723 | 40.01 | 528 | 519 | 105.1 |
| B | 10 | 245 | 4088537 | 48096.0 | 454 | 445 | 85.0 |
| B | 15 | 222 | 51560 | 601.36 | 454 | 445 | 85.0 |
| B | 0 | 156 | 10284 | 115.75 | 454 | 445 | 85.0 |
| C | 3 | 233 | 554035 | 4755.27 | 503 | 507 | 116.4 |
| C | 14 | 238 | 82840 | 707.31 | 503 | 507 | 116.4 |
| C | 13 | 61 | 3527 | 25.94 | 503 | 507 | 116.4 |
| D | 1 | 52 | 1467253 | 12474.56 | 491 | 479 | 117.6 |
| D | 8 | 195 | 454032 | 3857.36 | 491 | 479 | 117.6 |
| D | 2 | 250 | 325945 | 2768.01 | 491 | 479 | 117.6 |
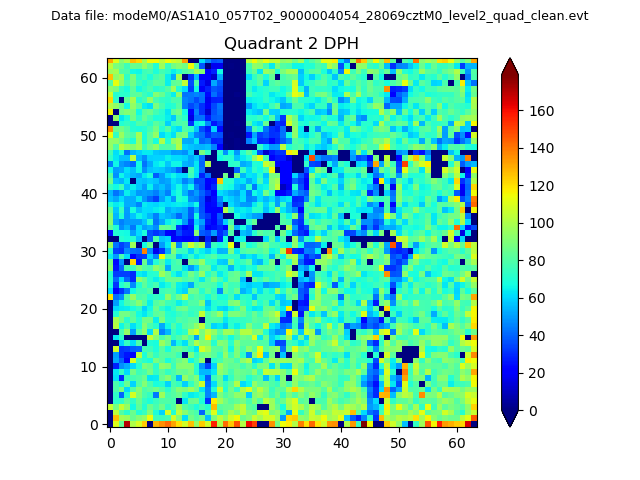
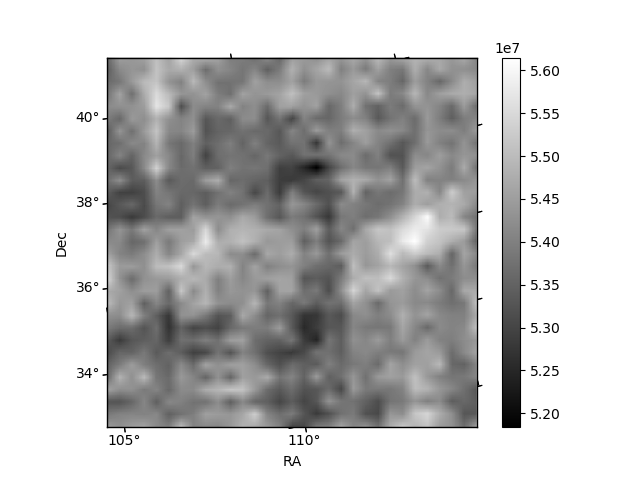
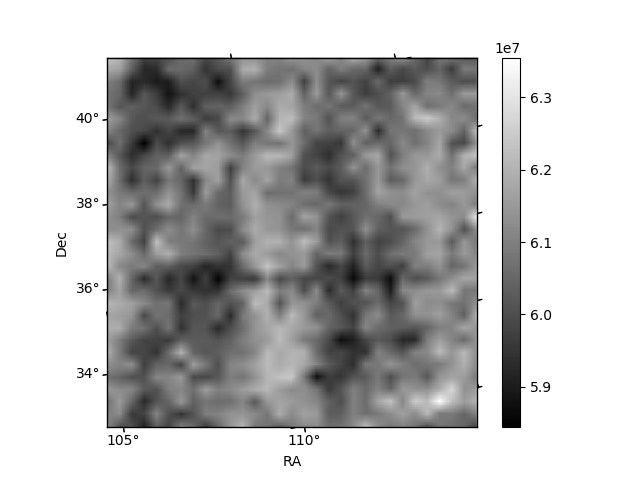
Histogram calculated using DETX and DETY for each event in the final _common_clean file
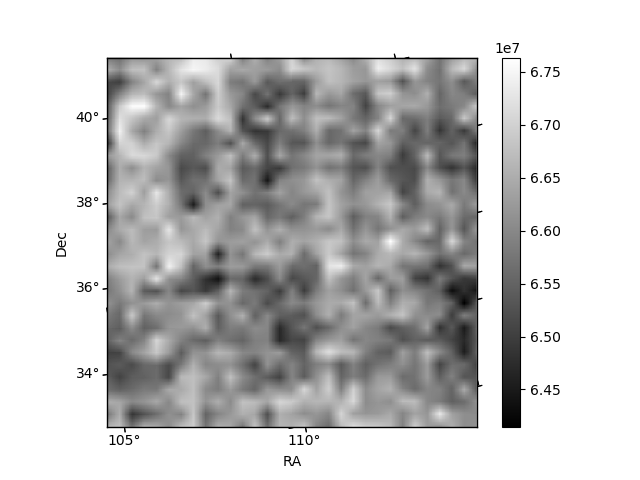
| Quadrant A | 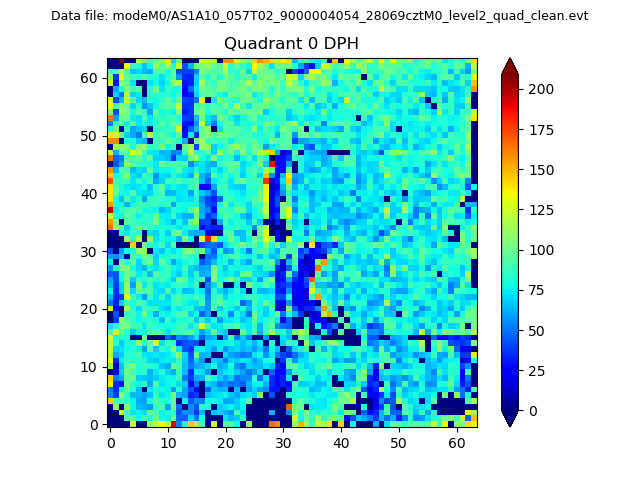 |
 |
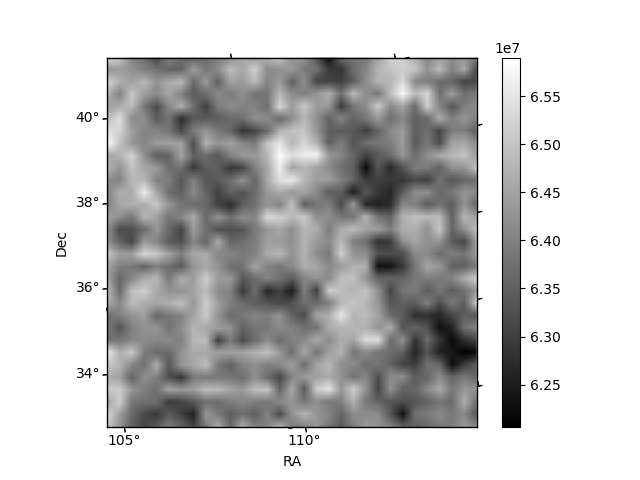
Quadrant B |
|---|---|---|---|
| Quadrant D | 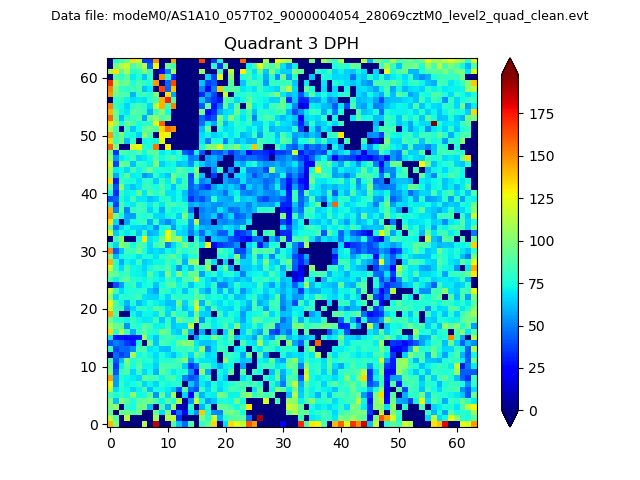 |
 |
Quadrant C |
| Plot type | Count rate plots | Images |
|---|---|---|
| Comparison with Poisson distribution Blue bars denote a histogram of data divided into 1 sec bins. Red curve is a Poisson curve with rate = median count rate of data. |
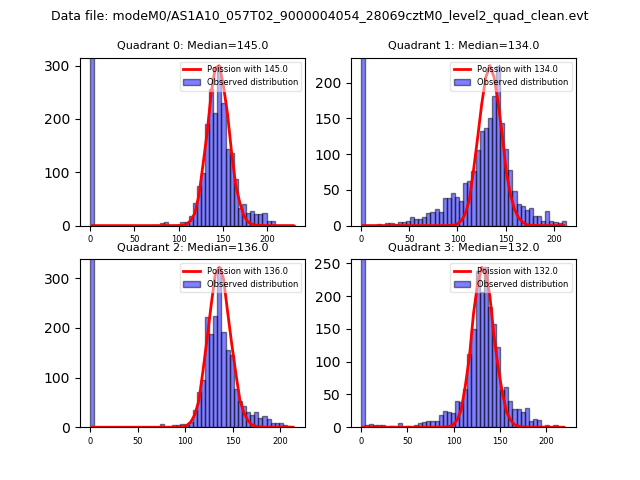 |
 |
| Quadrant-wise count rates Data is divided into 100 sec bins |
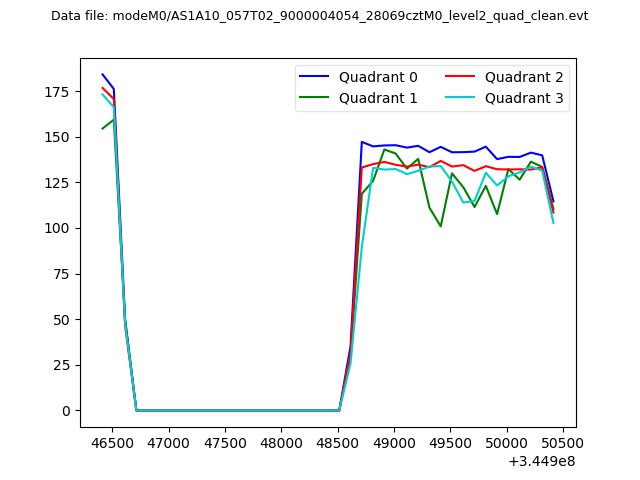 |
|
| Module-wise count rates for Quadrant A Data is divided into 100 sec bins |
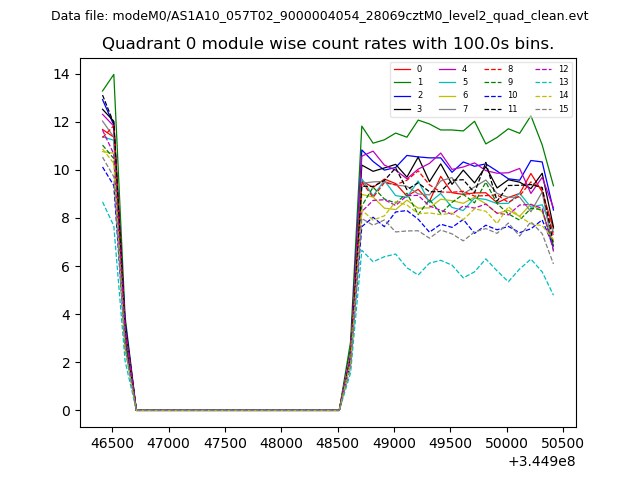 |
 |
| Module-wise count rates for Quadrant B Data is divided into 100 sec bins |
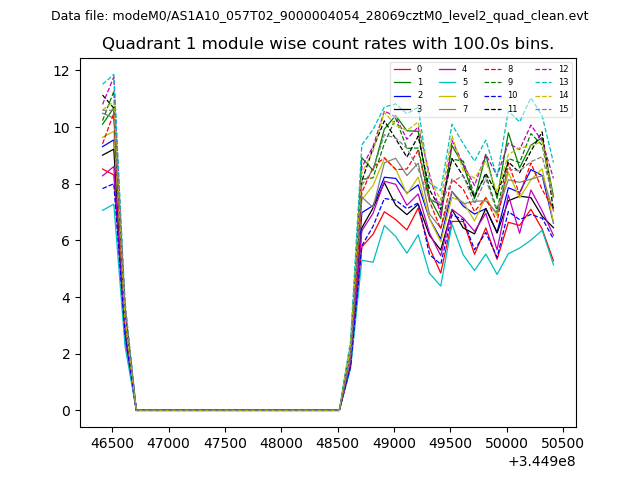 |
 |
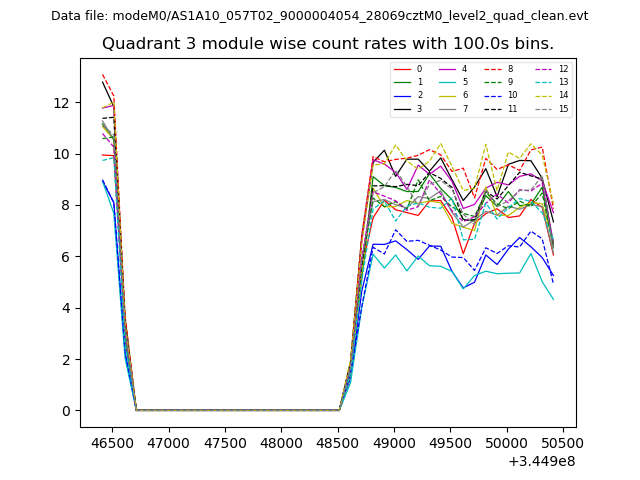
| Module-wise count rates for Quadrant C Data is divided into 100 sec bins |
 |
 |
| Module-wise count rates for Quadrant D Data is divided into 100 sec bins |
 |
 |
| Parameter | Plot |
|---|---|
| CZT HV Monitor | 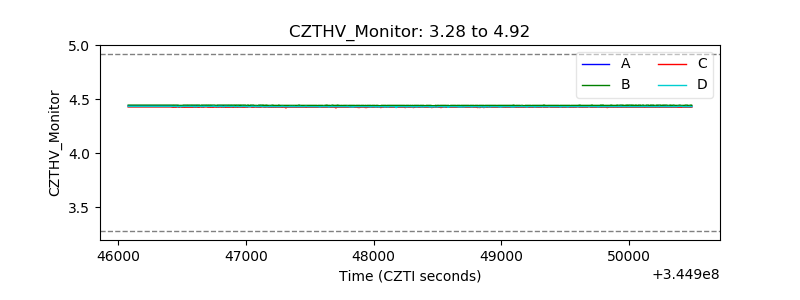 |
| D_VDD | 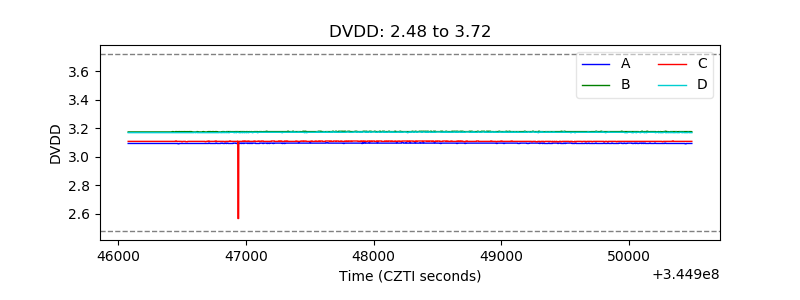 |
| Temperature 1 | 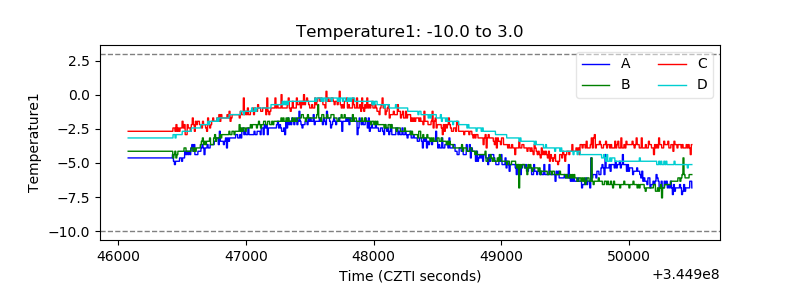 |
| Veto HV Monitor | 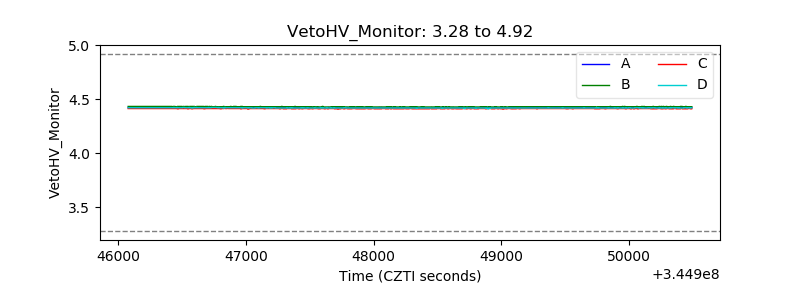 |
| Veto LLD |  |
| Alpha Counter | 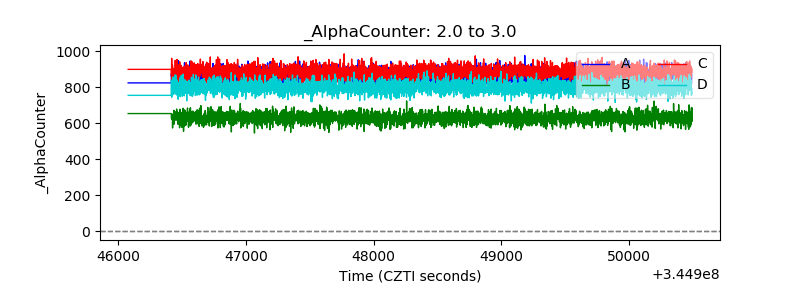 |
| _CPM_Rate | 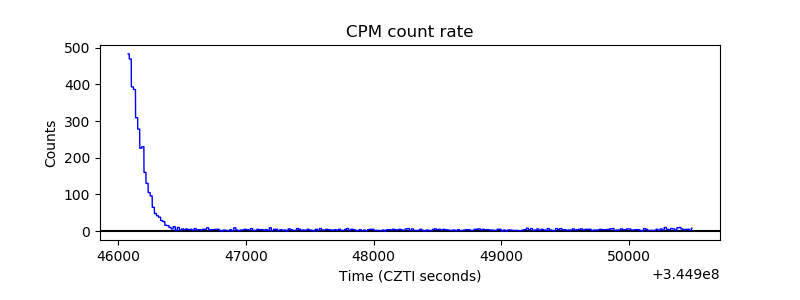 |
| CZT Counter | 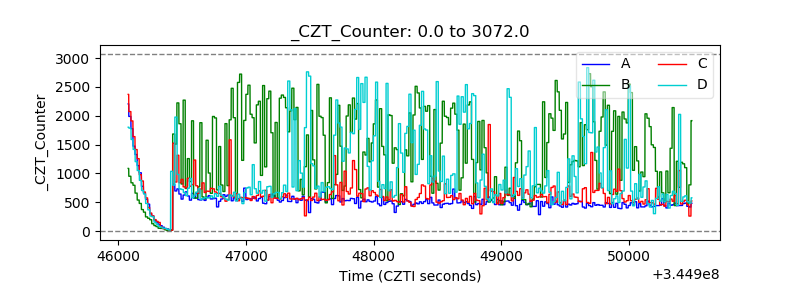 |
| +2.5 Volts monitor |  |
| +5 Volts monitor | 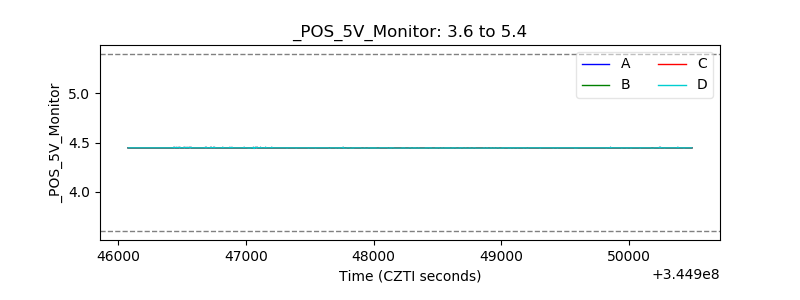 |
| _ROLL_ROT | 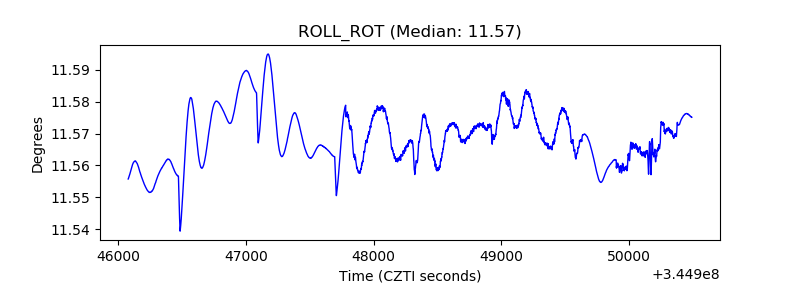 |
| _Roll_DEC | 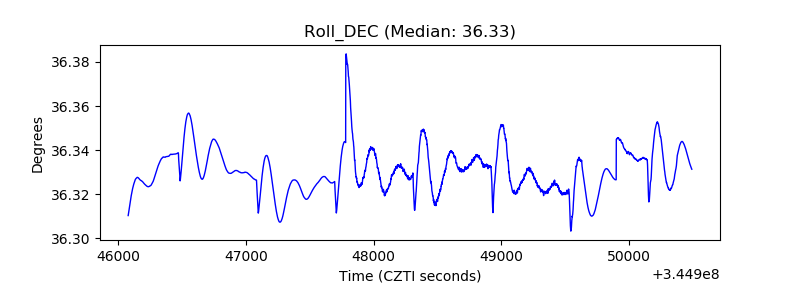 |
| _Roll_RA |  |
| Veto Counter | 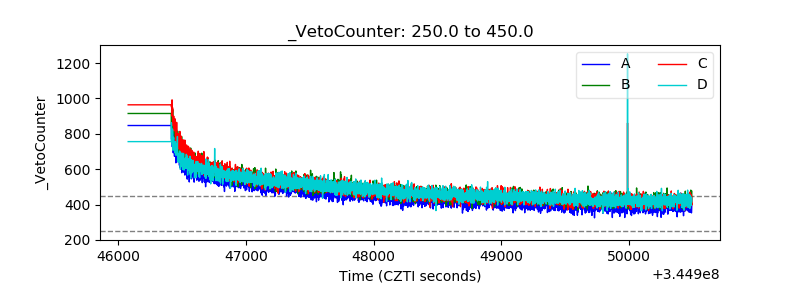 |