| Param | Original file | Final file |
|---|---|---|
| Filename | modeM0/AS1A10_073T01_9000004056_28070cztM0_level2.evt | modeM0/AS1A10_073T01_9000004056_28070cztM0_level2_quad_clean.evt |
| Size (bytes) | 682,200,000 | 129,582,720 |
| Size | 650.6 MB | 123.6 MB |
| Events in quadrant A | 3,275,397 | 924,024 |
| Events in quadrant B | 5,417,920 | 870,141 |
| Events in quadrant C | 5,962,478 | 829,452 |
| Events in quadrant D | 5,551,628 | 833,184 |
| Mode M9 | |||
|---|---|---|---|
| Quadrant | BADHDUFLAG | Total packets | Discarded packets |
| A | 0 | 6 | 0 |
| B | 0 | 6 | 0 |
| C | 0 | 6 | 0 |
| D | 0 | 6 | 0 |
| Mode M0 | |||
|---|---|---|---|
| Quadrant | BADHDUFLAG | Total packets | Discarded packets |
| A | 0 | 13937 | 0 |
| B | 0 | 20355 | 0 |
| C | 0 | 22319 | 0 |
| D | 0 | 21009 | 0 |
| Quadrant | Total seconds | Saturated seconds | Saturation percentage |
|---|---|---|---|
| A | 6705 | 93 | 1.387025% |
| B | 6706 | 764 | 11.392783% |
| C | 6705 | 550 | 8.202834% |
| D | 6705 | 474 | 7.069351% |
Noise dominated data is calculated using 1-second bins in cleaned event files. If a bin has >2000 counts, and if more than 50% of those come from <1% of pixels, then it is considered to be noise-dominated and hence unusable.
| Quadrant | # 1 sec bins | Bins with >0 counts | Bins with >2000 counts | High rate bins dominated by noise | Noise dominated (total time) | Noise dominated (detector-on time) | Marked lightcurve |
|---|---|---|---|---|---|---|---|
| A | 7270 | 6706 | 0 | 0 | 0.00% | 0.00% | 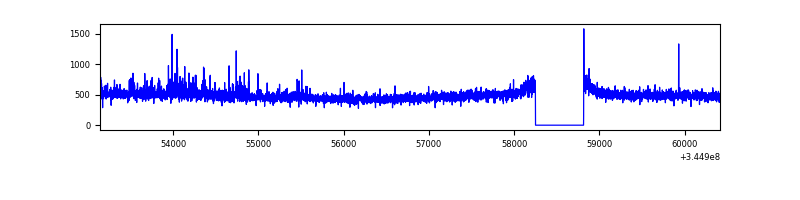 |
| B | 7271 | 6707 | 498 | 498 | 6.85% | 7.43% | 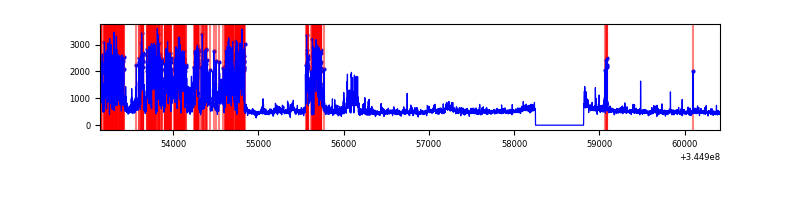 |
| C | 7270 | 6705 | 150 | 150 | 2.06% | 2.24% | 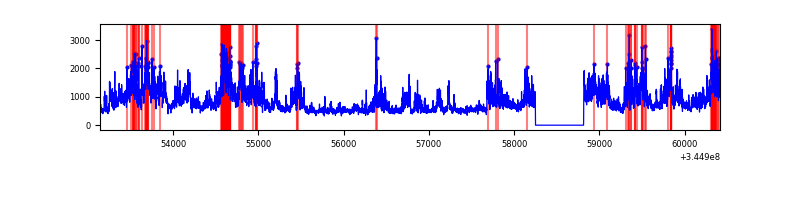 |
| D | 7270 | 6705 | 351 | 351 | 4.83% | 5.23% | 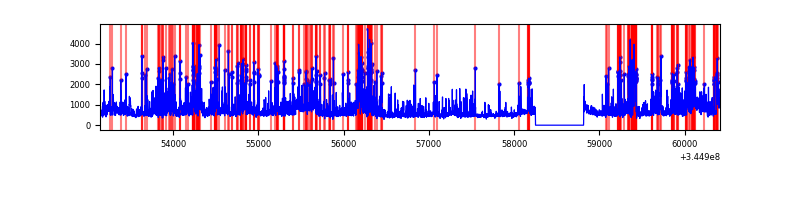 |
Top three noisy pixels from each quadrant. If the there are fewer than three noisy pixels in the level2.evt file, extra rows are filled as -1
| Pixel properties | Quadrant properties | ||||||
|---|---|---|---|---|---|---|---|
| Quadrant | DetID | PixID | Counts | Sigma | Mean | Median | Sigma |
| A | 0 | 13 | 109291 | 665.48 | 818 | 802 | 163.0 |
| A | 13 | 254 | 12228 | 70.09 | 818 | 802 | 163.0 |
| A | 3 | 137 | 7654 | 42.03 | 818 | 802 | 163.0 |
| B | 10 | 245 | 2295354 | 15809.4 | 779 | 761 | 145.1 |
| B | 4 | 52 | 17592 | 115.96 | 779 | 761 | 145.1 |
| B | 12 | 111 | 17335 | 114.19 | 779 | 761 | 145.1 |
| C | 3 | 233 | 2874605 | 16346.93 | 759 | 760 | 175.8 |
| C | 14 | 238 | 122683 | 693.52 | 759 | 760 | 175.8 |
| C | 13 | 61 | 5188 | 25.19 | 759 | 760 | 175.8 |
| D | 1 | 52 | 1318119 | 7179.76 | 770 | 749 | 183.5 |
| D | 8 | 195 | 555351 | 3022.62 | 770 | 749 | 183.5 |
| D | 2 | 250 | 535582 | 2914.88 | 770 | 749 | 183.5 |
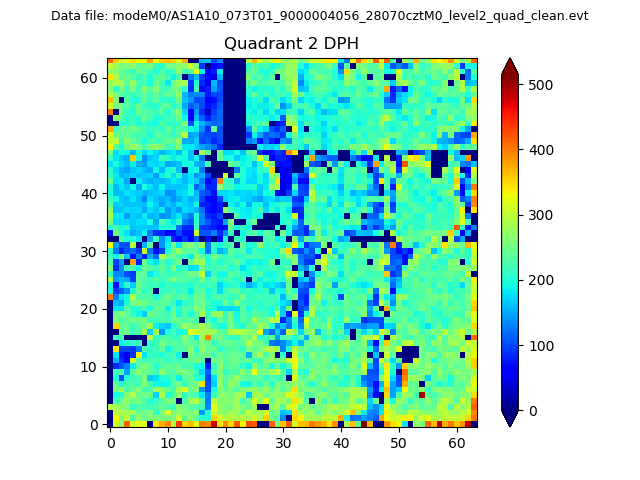
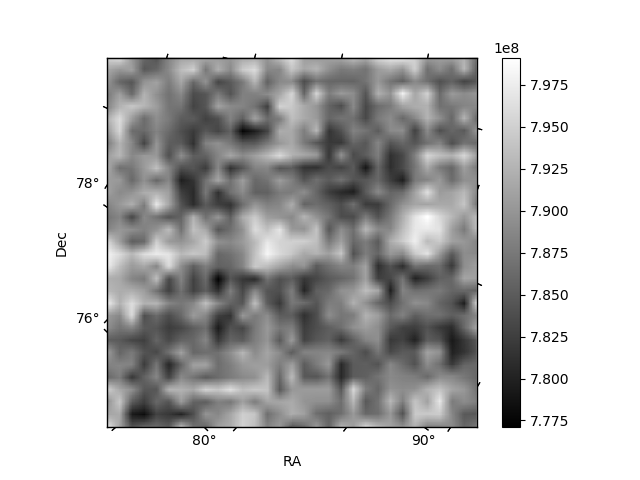
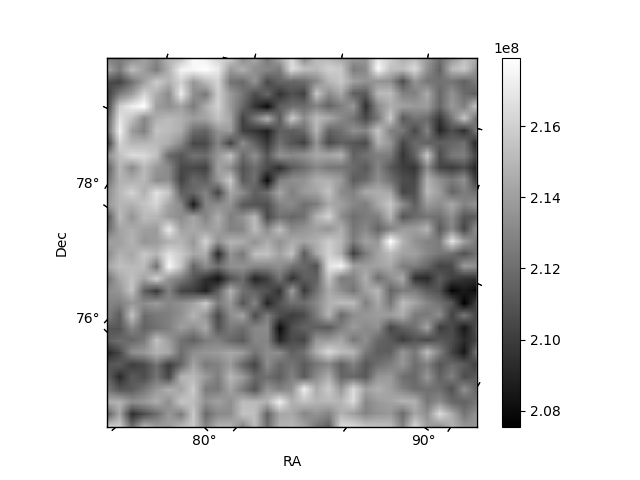
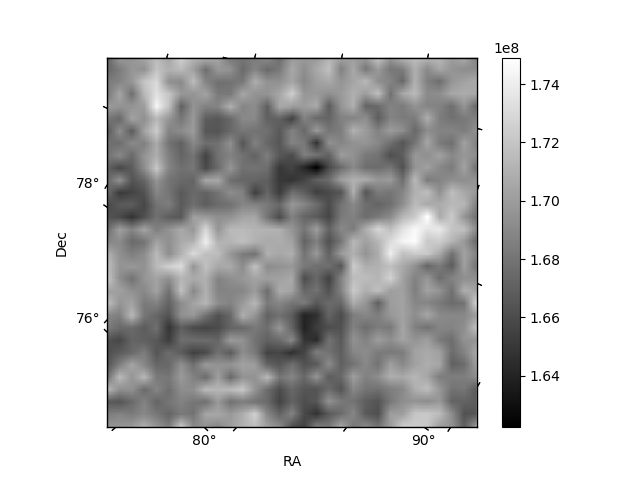
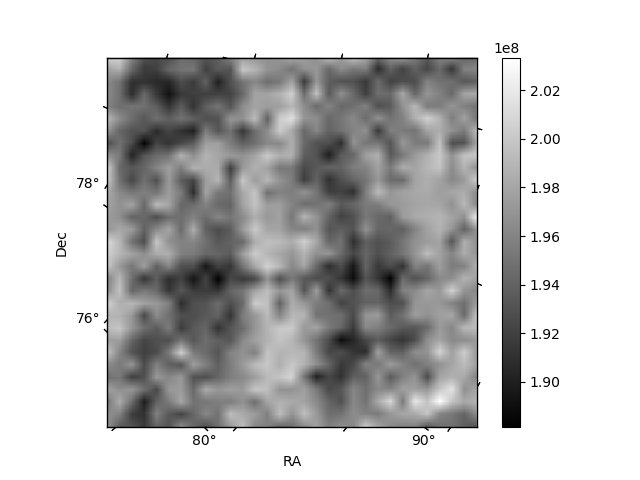
Histogram calculated using DETX and DETY for each event in the final _common_clean file
| Quadrant A | 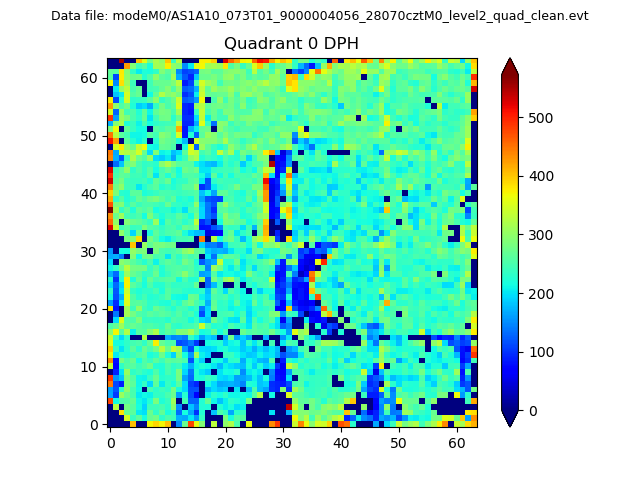 |
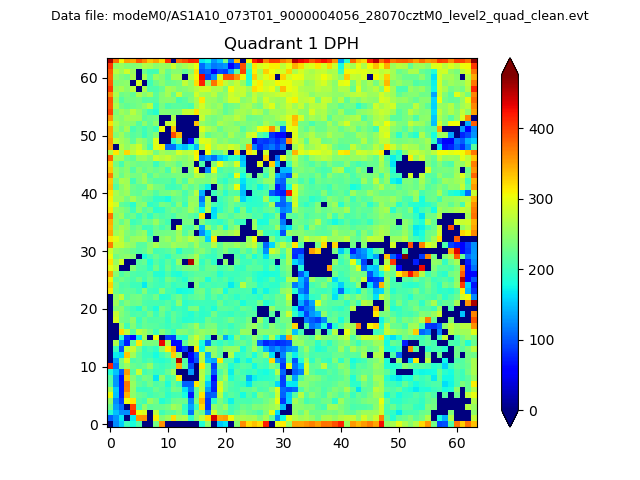 |
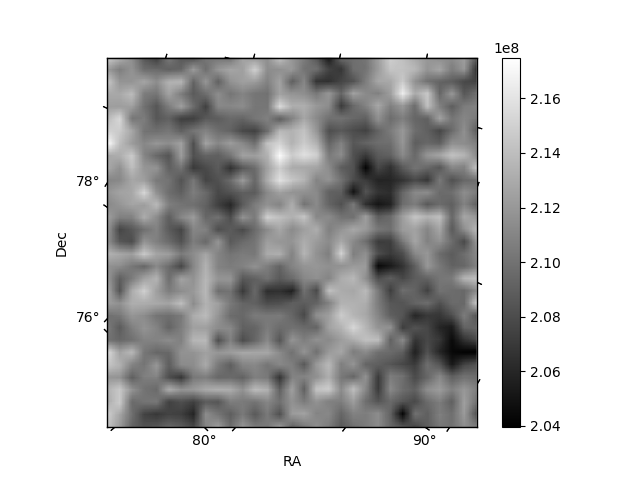
Quadrant B |
|---|---|---|---|
| Quadrant D | 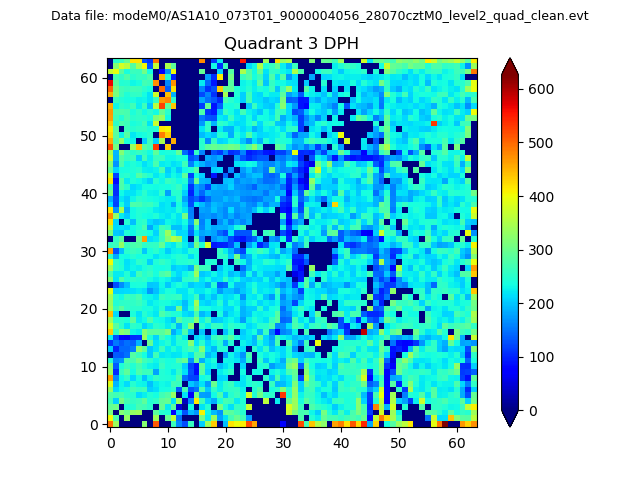 |
 |
Quadrant C |
| Plot type | Count rate plots | Images |
|---|---|---|
| Comparison with Poisson distribution Blue bars denote a histogram of data divided into 1 sec bins. Red curve is a Poisson curve with rate = median count rate of data. |
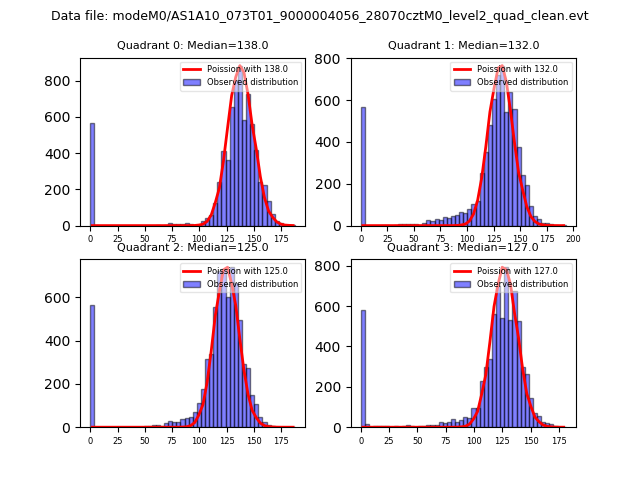 |
 |
| Quadrant-wise count rates Data is divided into 100 sec bins |
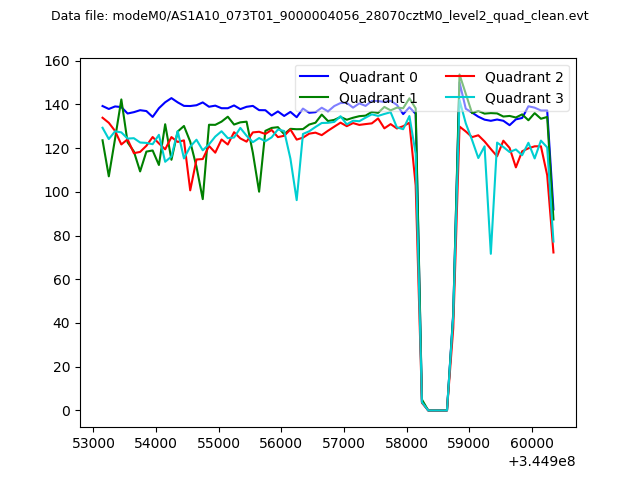 |
|
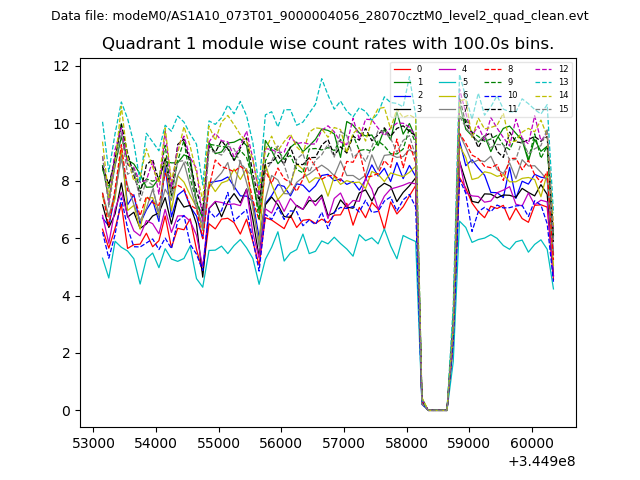
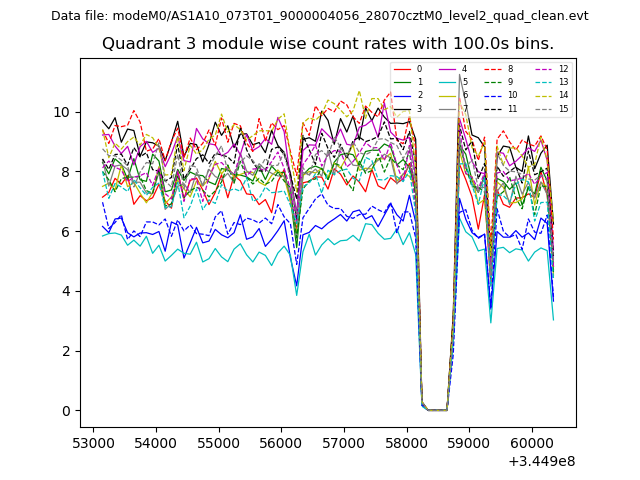
| Module-wise count rates for Quadrant A Data is divided into 100 sec bins |
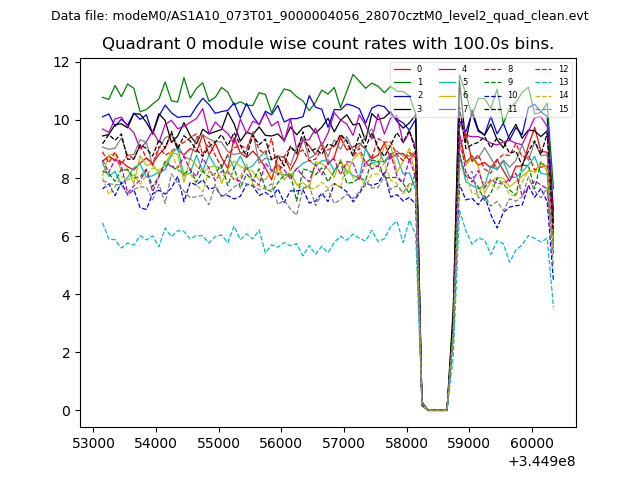 |
 |
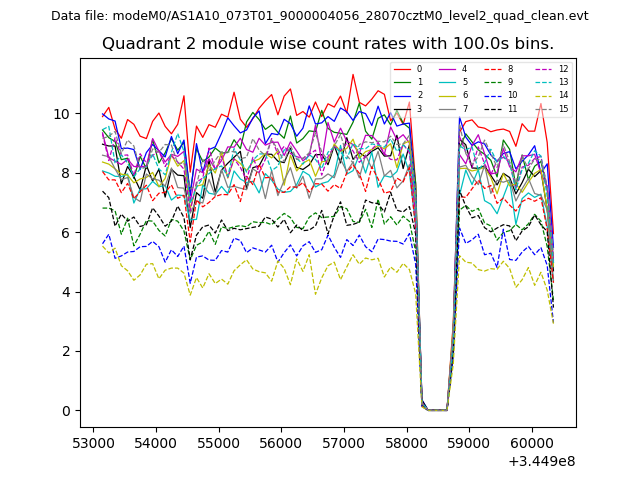
| Module-wise count rates for Quadrant B Data is divided into 100 sec bins |
 |
 |
| Module-wise count rates for Quadrant C Data is divided into 100 sec bins |
 |
 |
| Module-wise count rates for Quadrant D Data is divided into 100 sec bins |
 |
 |
| Parameter | Plot |
|---|---|
| CZT HV Monitor | 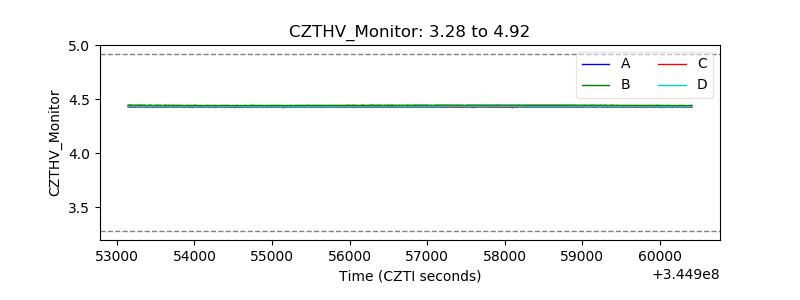 |
| D_VDD | 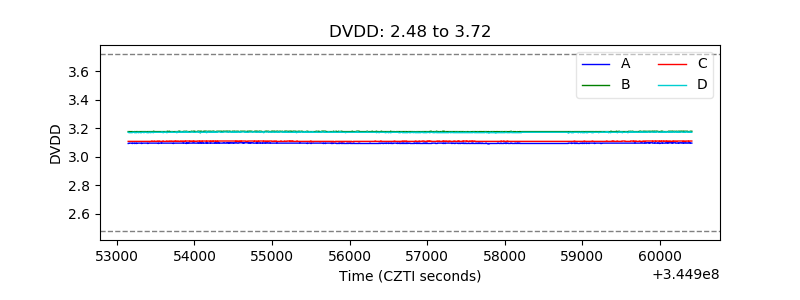 |
| Temperature 1 | 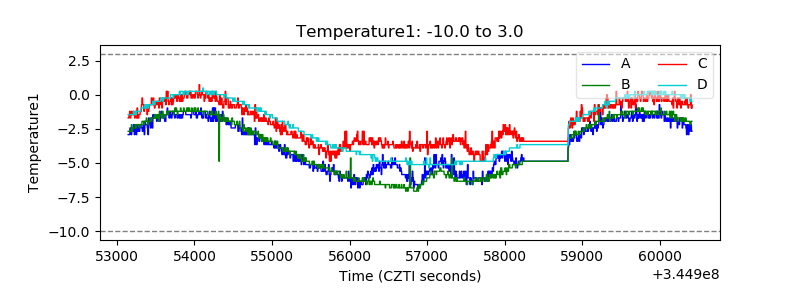 |
| Veto HV Monitor | 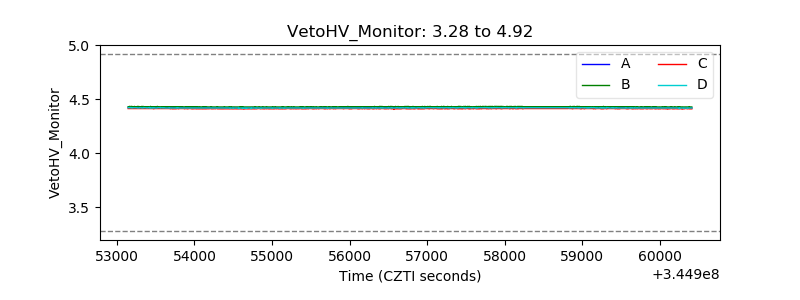 |
| Veto LLD | 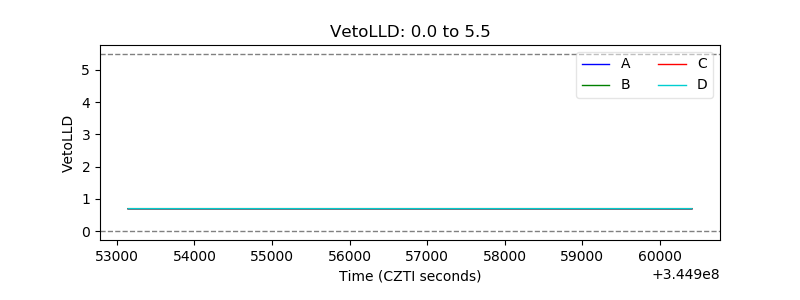 |
| Alpha Counter | 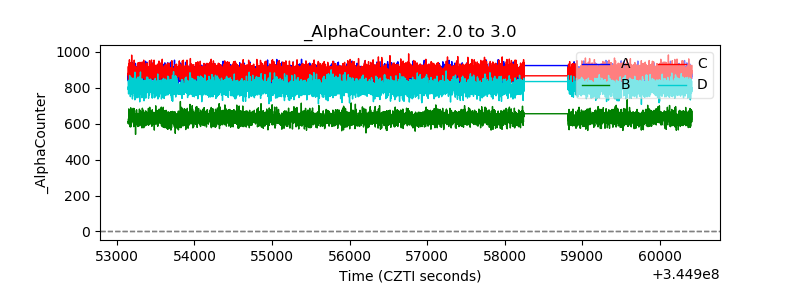 |
| _CPM_Rate | 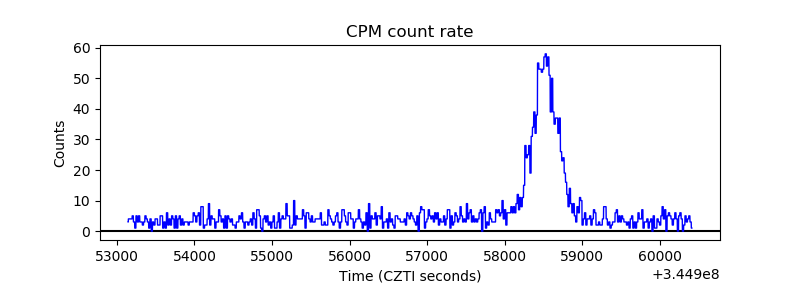 |
| CZT Counter | 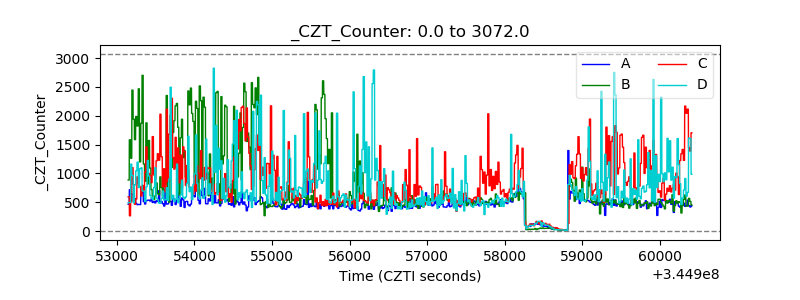 |
| +2.5 Volts monitor | 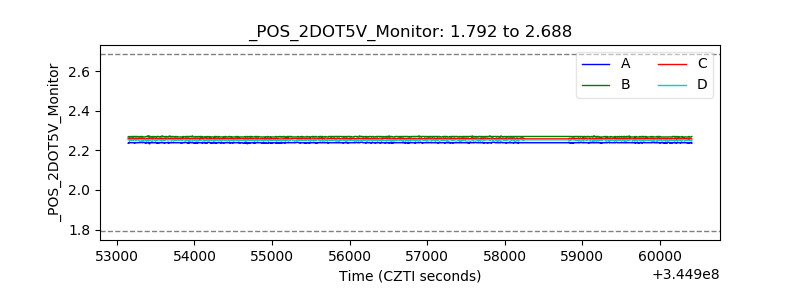 |
| +5 Volts monitor |  |
| _ROLL_ROT | 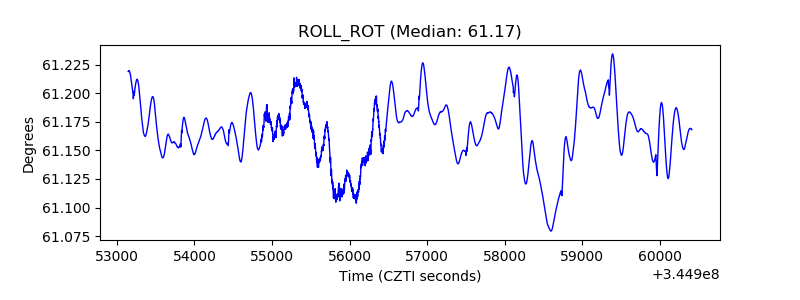 |
| _Roll_DEC | 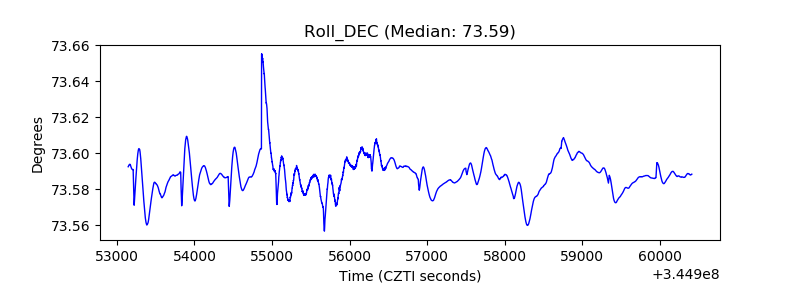 |
| _Roll_RA | 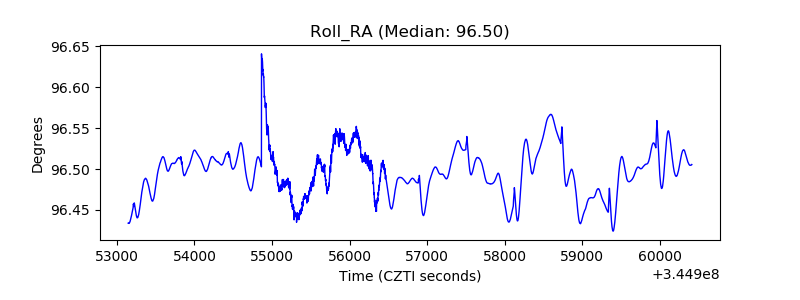 |
| Veto Counter | 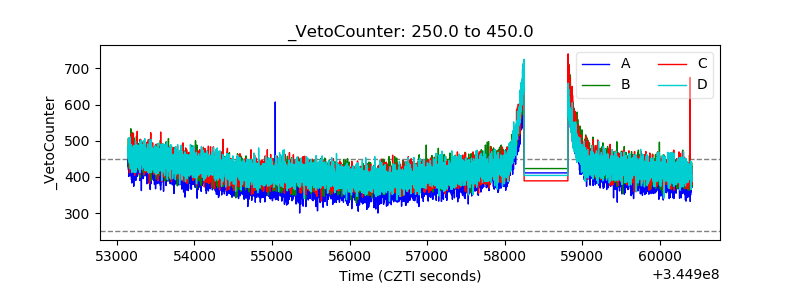 |