| Param | Original file | Final file |
|---|---|---|
| Filename | modeM0/AS1A10_073T01_9000004056_28071cztM0_level2.evt | modeM0/AS1A10_073T01_9000004056_28071cztM0_level2_quad_clean.evt |
| Size (bytes) | 699,871,680 | 131,345,280 |
| Size | 667.4 MB | 125.3 MB |
| Events in quadrant A | 3,306,843 | 930,977 |
| Events in quadrant B | 4,789,539 | 886,194 |
| Events in quadrant C | 5,779,699 | 845,942 |
| Events in quadrant D | 6,850,754 | 830,877 |
| Mode M9 | |||
|---|---|---|---|
| Quadrant | BADHDUFLAG | Total packets | Discarded packets |
| A | 0 | 3 | 0 |
| B | 0 | 3 | 0 |
| C | 0 | 3 | 0 |
| D | 0 | 3 | 0 |
| Mode M0 | |||
|---|---|---|---|
| Quadrant | BADHDUFLAG | Total packets | Discarded packets |
| A | 0 | 14301 | 0 |
| B | 0 | 18868 | 0 |
| C | 0 | 21884 | 0 |
| D | 0 | 25085 | 0 |
| Quadrant | Total seconds | Saturated seconds | Saturation percentage |
|---|---|---|---|
| A | 6943 | 43 | 0.619329% |
| B | 6944 | 649 | 9.346198% |
| C | 6944 | 460 | 6.624424% |
| D | 6944 | 682 | 9.821429% |
Noise dominated data is calculated using 1-second bins in cleaned event files. If a bin has >2000 counts, and if more than 50% of those come from <1% of pixels, then it is considered to be noise-dominated and hence unusable.
| Quadrant | # 1 sec bins | Bins with >0 counts | Bins with >2000 counts | High rate bins dominated by noise | Noise dominated (total time) | Noise dominated (detector-on time) | Marked lightcurve |
|---|---|---|---|---|---|---|---|
| A | 7188 | 6944 | 0 | 0 | 0.00% | 0.00% | 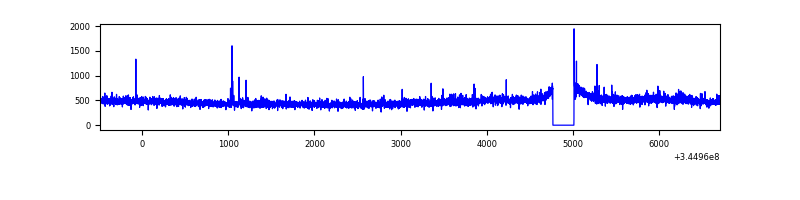 |
| B | 7189 | 6945 | 375 | 375 | 5.22% | 5.40% | 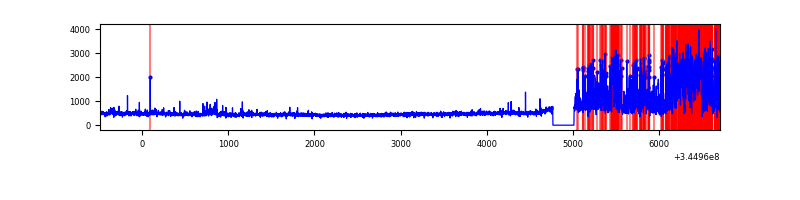 |
| C | 7189 | 6945 | 180 | 180 | 2.50% | 2.59% | 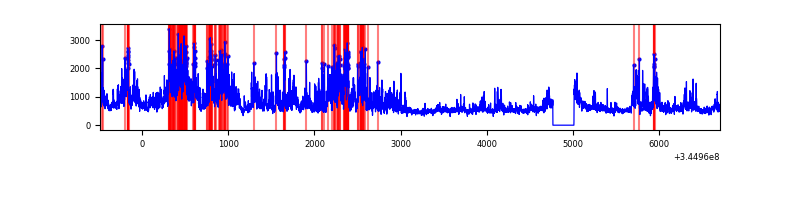 |
| D | 7189 | 6945 | 597 | 597 | 8.30% | 8.60% | 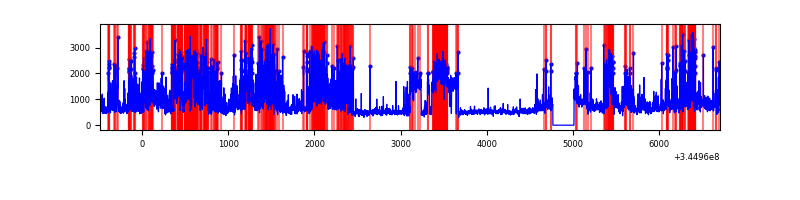 |
Top three noisy pixels from each quadrant. If the there are fewer than three noisy pixels in the level2.evt file, extra rows are filled as -1
| Pixel properties | Quadrant properties | ||||||
|---|---|---|---|---|---|---|---|
| Quadrant | DetID | PixID | Counts | Sigma | Mean | Median | Sigma |
| A | 0 | 13 | 45152 | 262.98 | 839 | 821 | 168.6 |
| A | 12 | 96 | 19543 | 111.06 | 839 | 821 | 168.6 |
| A | 13 | 254 | 12437 | 68.91 | 839 | 821 | 168.6 |
| B | 10 | 245 | 1550689 | 10296.61 | 802 | 781 | 150.5 |
| B | 4 | 200 | 25129 | 161.75 | 802 | 781 | 150.5 |
| B | 4 | 52 | 19563 | 124.78 | 802 | 781 | 150.5 |
| C | 3 | 233 | 2573278 | 14056.07 | 785 | 788 | 183.0 |
| C | 14 | 238 | 125795 | 683.04 | 785 | 788 | 183.0 |
| C | 15 | 208 | 20157 | 105.83 | 785 | 788 | 183.0 |
| D | 1 | 52 | 2545459 | 13650.79 | 788 | 768 | 186.4 |
| D | 8 | 195 | 787872 | 4222.36 | 788 | 768 | 186.4 |
| D | 2 | 250 | 259384 | 1387.33 | 788 | 768 | 186.4 |
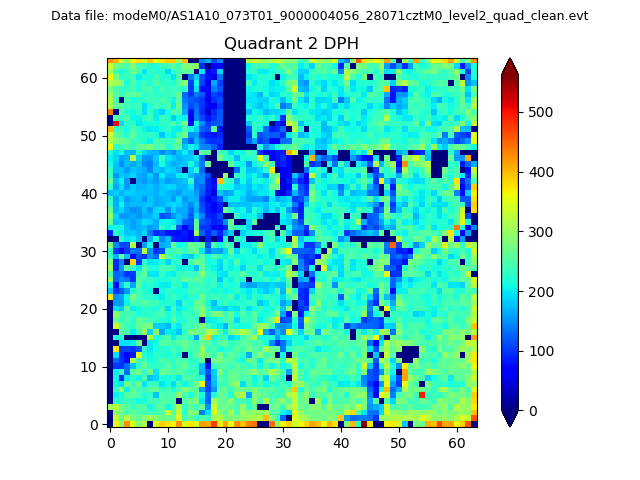
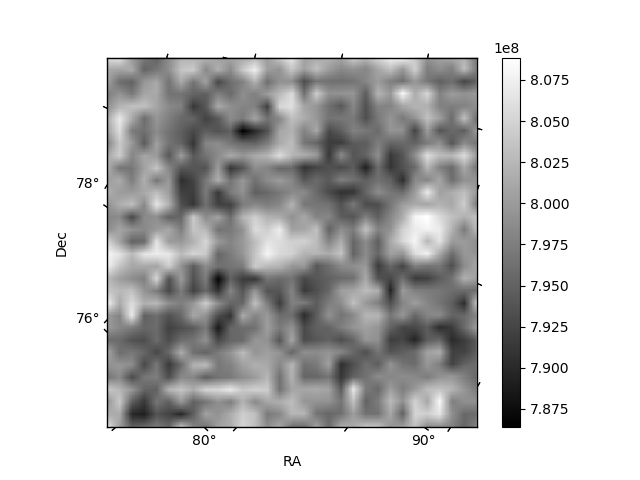
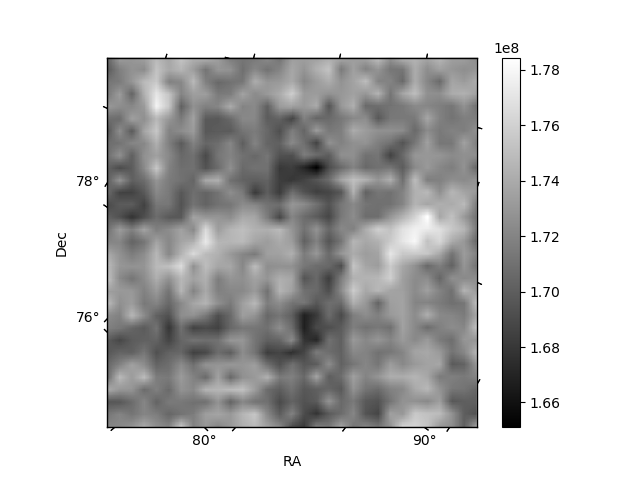
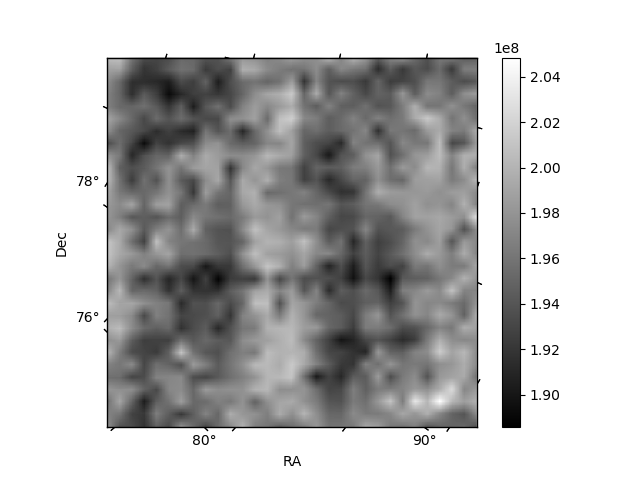
Histogram calculated using DETX and DETY for each event in the final _common_clean file
| Quadrant A | 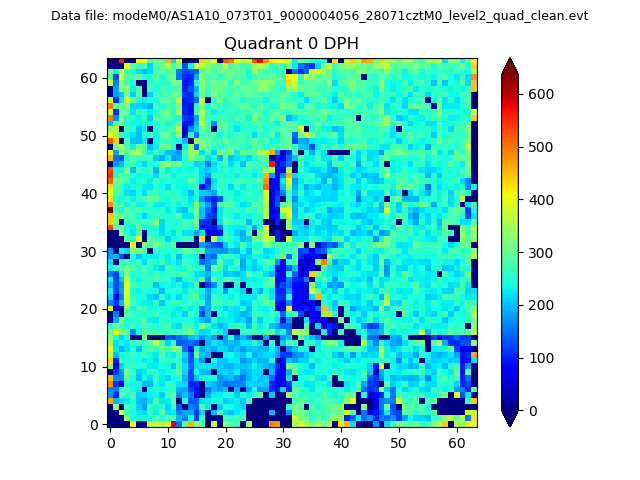 |
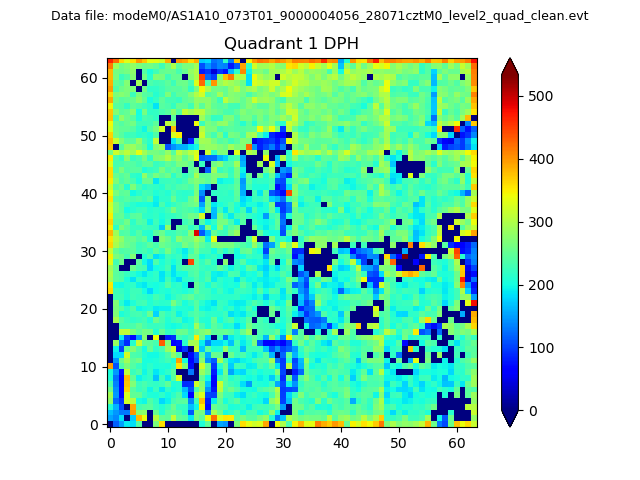 |
Quadrant B |
|---|---|---|---|
| Quadrant D | 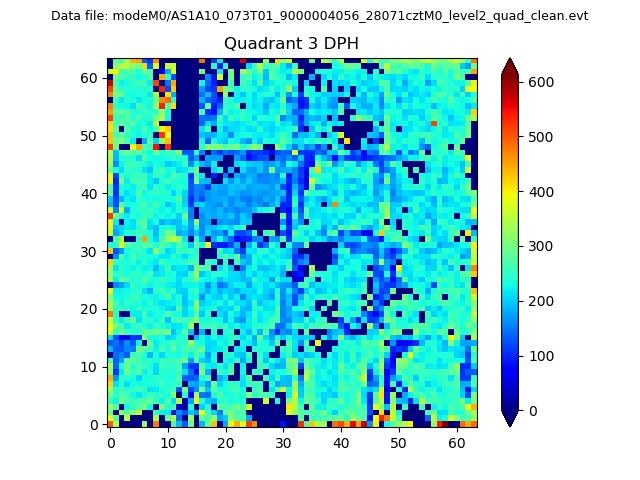 |
 |
Quadrant C |
| Plot type | Count rate plots | Images |
|---|---|---|
| Comparison with Poisson distribution Blue bars denote a histogram of data divided into 1 sec bins. Red curve is a Poisson curve with rate = median count rate of data. |
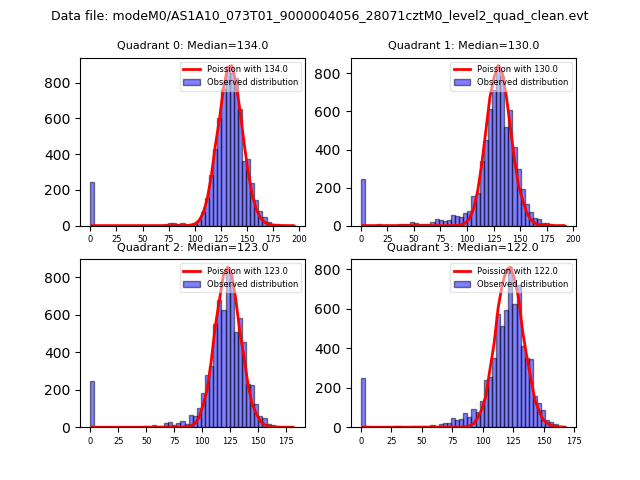 |
 |
| Quadrant-wise count rates Data is divided into 100 sec bins |
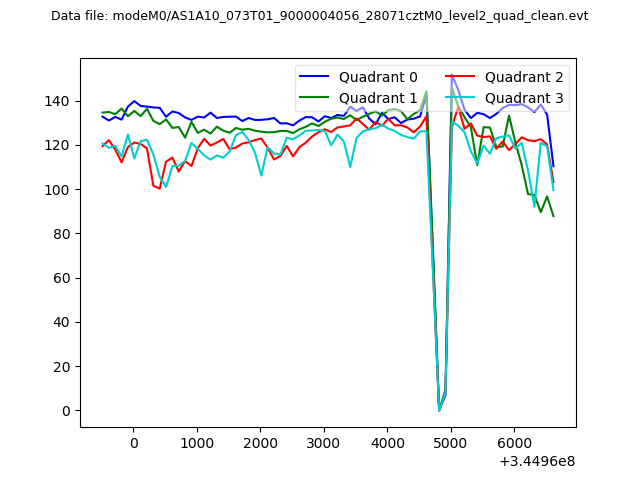 |
|
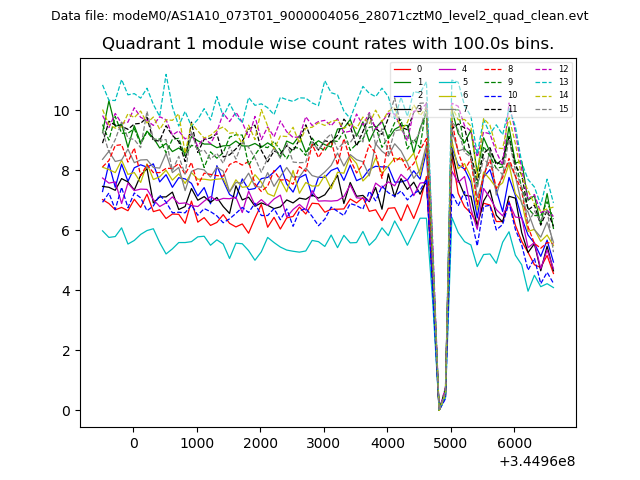
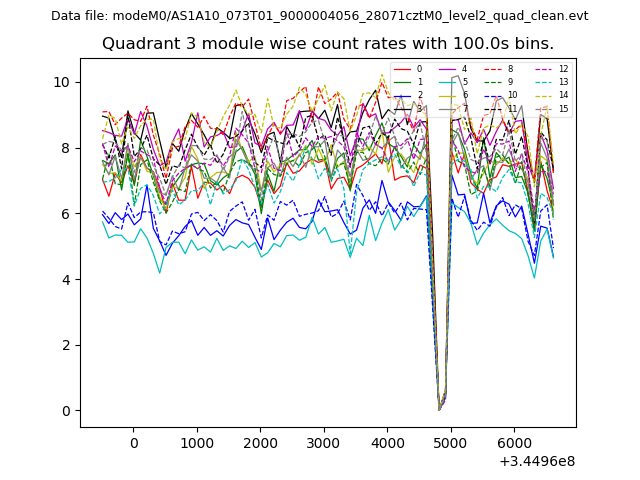
| Module-wise count rates for Quadrant A Data is divided into 100 sec bins |
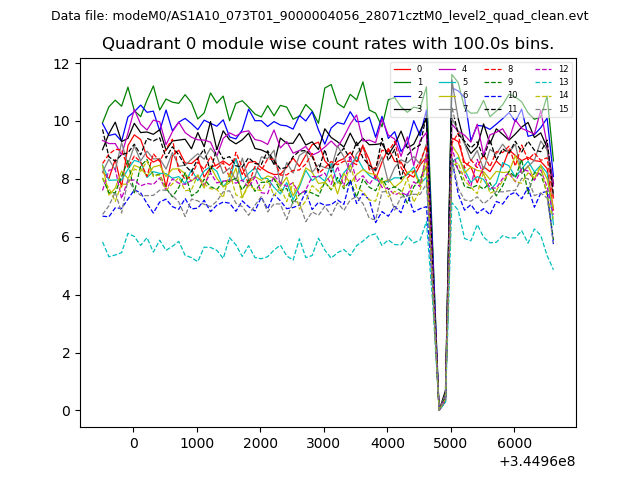 |
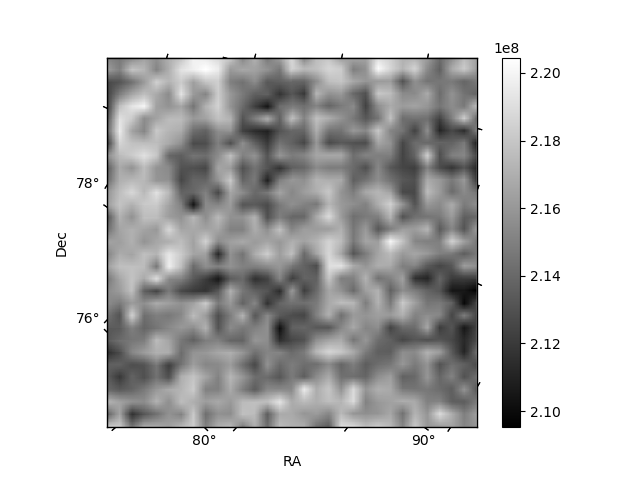 |
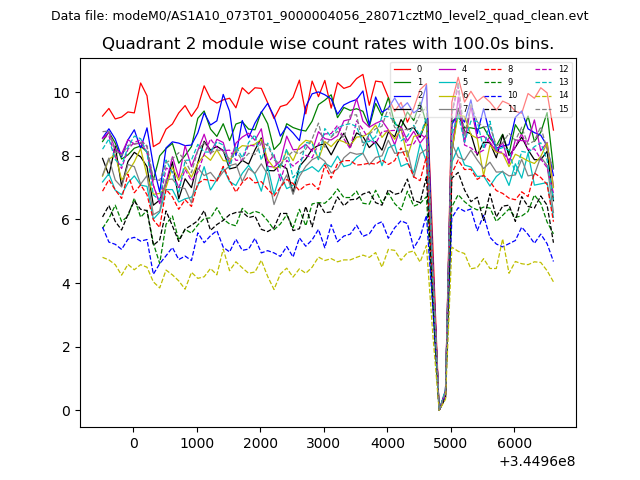
| Module-wise count rates for Quadrant B Data is divided into 100 sec bins |
 |
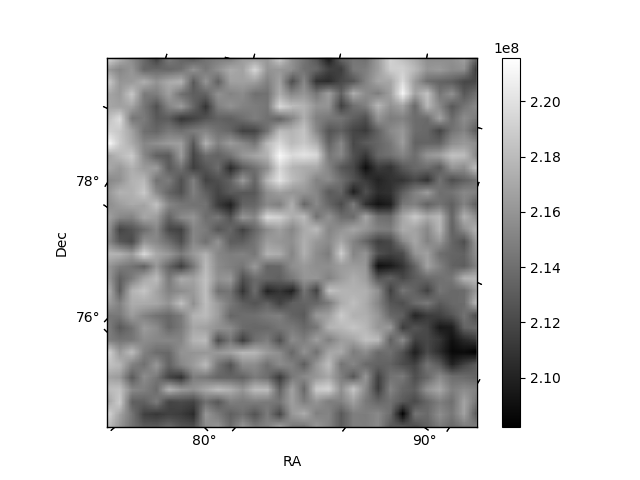 |
| Module-wise count rates for Quadrant C Data is divided into 100 sec bins |
 |
 |
| Module-wise count rates for Quadrant D Data is divided into 100 sec bins |
 |
 |
| Parameter | Plot |
|---|---|
| CZT HV Monitor | 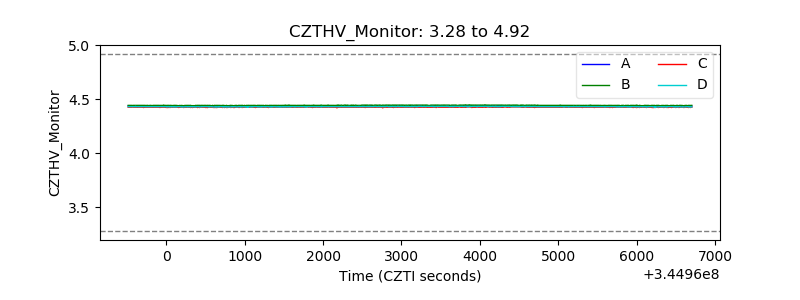 |
| D_VDD | 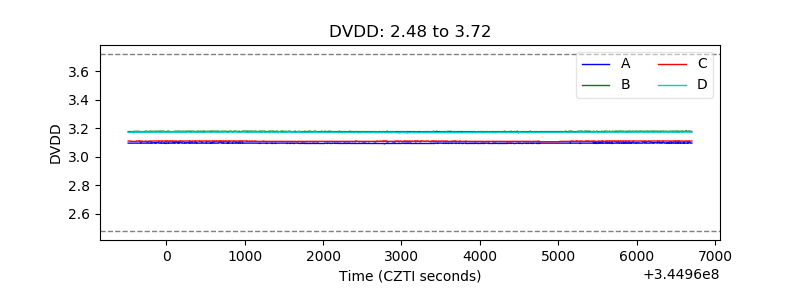 |
| Temperature 1 | 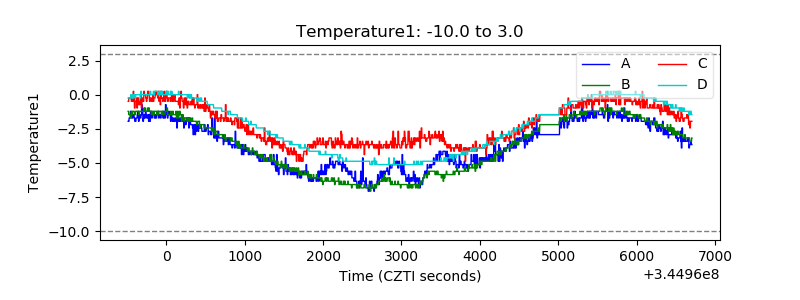 |
| Veto HV Monitor |  |
| Veto LLD | 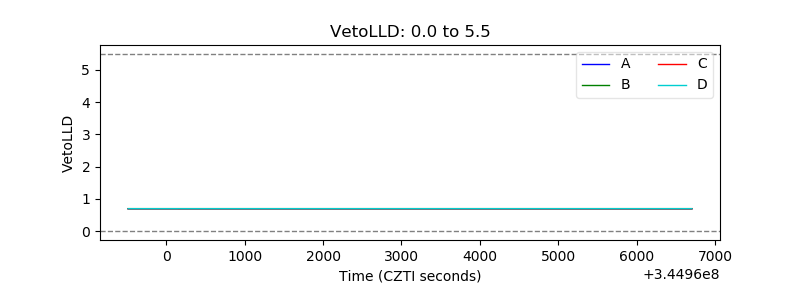 |
| Alpha Counter | 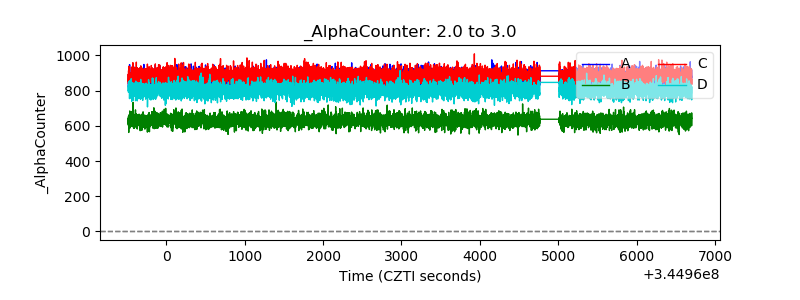 |
| _CPM_Rate |  |
| CZT Counter | 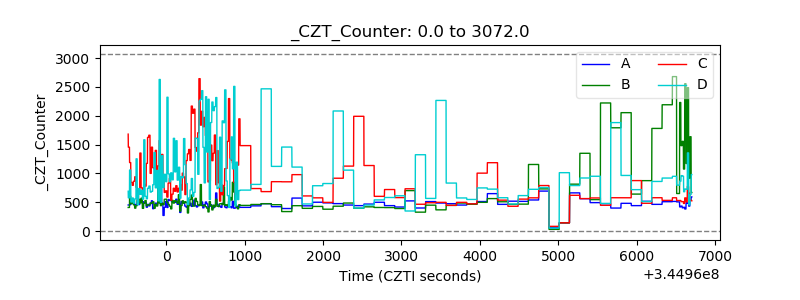 |
| +2.5 Volts monitor | 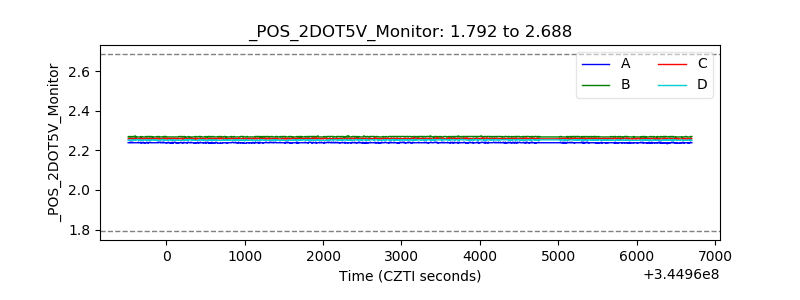 |
| +5 Volts monitor |  |
| _ROLL_ROT | 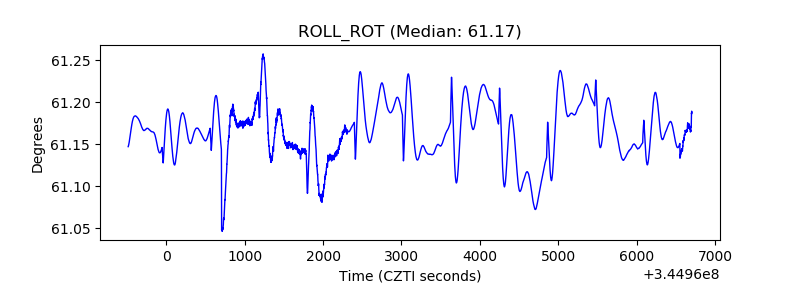 |
| _Roll_DEC | 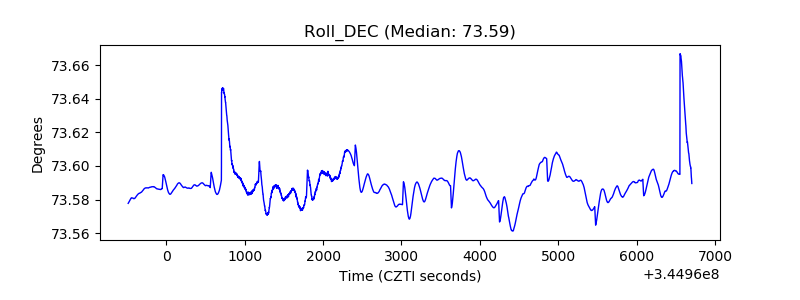 |
| _Roll_RA | 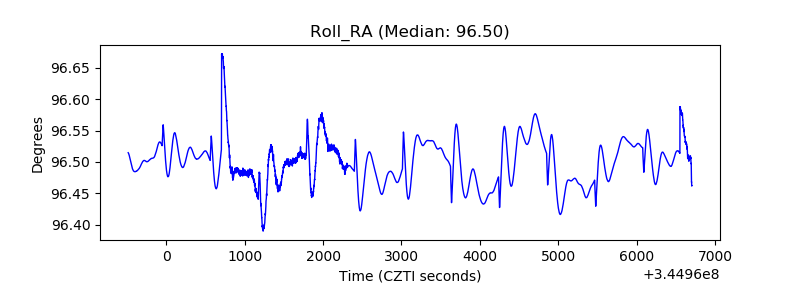 |
| Veto Counter | 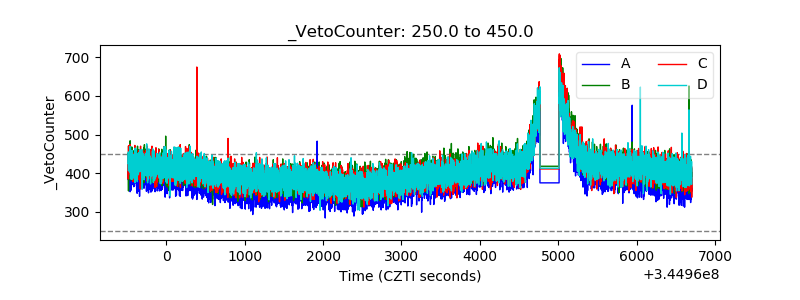 |