| Param | Original file | Final file |
|---|---|---|
| Filename | modeM0/AS1A10_073T01_9000004056_28072cztM0_level2.evt | modeM0/AS1A10_073T01_9000004056_28072cztM0_level2_quad_clean.evt |
| Size (bytes) | 773,055,360 | 126,648,000 |
| Size | 737.2 MB | 120.8 MB |
| Events in quadrant A | 3,294,373 | 910,802 |
| Events in quadrant B | 7,467,078 | 811,146 |
| Events in quadrant C | 5,250,726 | 834,615 |
| Events in quadrant D | 6,936,368 | 799,496 |
| Mode M9 | |||
|---|---|---|---|
| Quadrant | BADHDUFLAG | Total packets | Discarded packets |
| A | 0 | 2 | 0 |
| B | 0 | 2 | 0 |
| C | 0 | 2 | 0 |
| D | 0 | 2 | 0 |
| Mode M0 | |||
|---|---|---|---|
| Quadrant | BADHDUFLAG | Total packets | Discarded packets |
| A | 0 | 14227 | 0 |
| B | 0 | 26942 | 0 |
| C | 0 | 20345 | 0 |
| D | 0 | 25420 | 0 |
| Quadrant | Total seconds | Saturated seconds | Saturation percentage |
|---|---|---|---|
| A | 6868 | 29 | 0.422248% |
| B | 6869 | 1268 | 18.459747% |
| C | 6869 | 324 | 4.716844% |
| D | 6868 | 885 | 12.885847% |
Noise dominated data is calculated using 1-second bins in cleaned event files. If a bin has >2000 counts, and if more than 50% of those come from <1% of pixels, then it is considered to be noise-dominated and hence unusable.
| Quadrant | # 1 sec bins | Bins with >0 counts | Bins with >2000 counts | High rate bins dominated by noise | Noise dominated (total time) | Noise dominated (detector-on time) | Marked lightcurve |
|---|---|---|---|---|---|---|---|
| A | 7148 | 6869 | 3 | 3 | 0.04% | 0.04% | 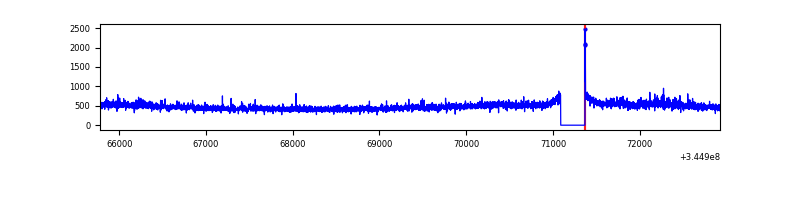 |
| B | 7148 | 6868 | 819 | 819 | 11.46% | 11.92% | 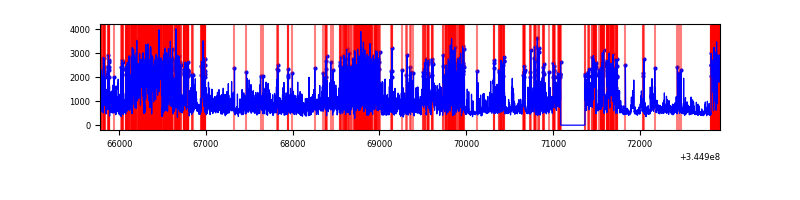 |
| C | 7149 | 6870 | 58 | 58 | 0.81% | 0.84% | 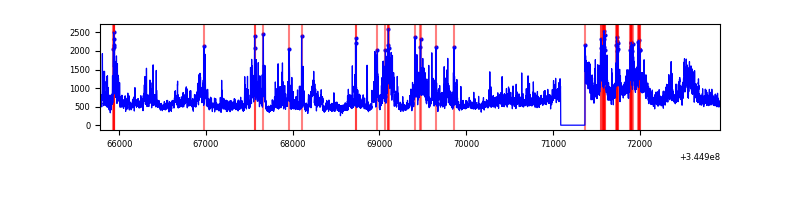 |
| D | 7148 | 6869 | 651 | 651 | 9.11% | 9.48% | 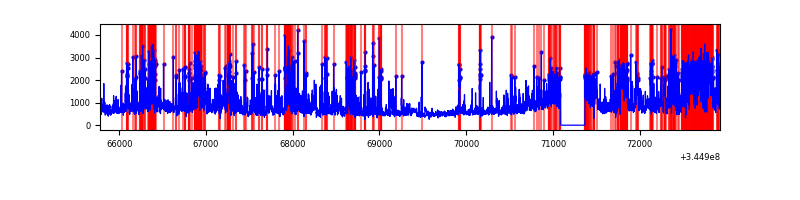 |
Top three noisy pixels from each quadrant. If the there are fewer than three noisy pixels in the level2.evt file, extra rows are filled as -1
| Pixel properties | Quadrant properties | ||||||
|---|---|---|---|---|---|---|---|
| Quadrant | DetID | PixID | Counts | Sigma | Mean | Median | Sigma |
| A | 0 | 13 | 95434 | 574.71 | 824 | 806 | 164.7 |
| A | 13 | 254 | 12001 | 67.99 | 824 | 806 | 164.7 |
| A | 8 | 192 | 8807 | 48.59 | 824 | 806 | 164.7 |
| B | 10 | 245 | 4363229 | 30608.14 | 753 | 734 | 142.5 |
| B | 0 | 190 | 63067 | 437.34 | 753 | 734 | 142.5 |
| B | 4 | 52 | 25990 | 177.2 | 753 | 734 | 142.5 |
| C | 3 | 233 | 2103895 | 11665.57 | 774 | 777 | 180.3 |
| C | 14 | 238 | 124847 | 688.19 | 774 | 777 | 180.3 |
| C | 13 | 61 | 5339 | 25.3 | 774 | 777 | 180.3 |
| D | 1 | 52 | 2472031 | 13331.1 | 763 | 741 | 185.4 |
| D | 8 | 195 | 1000809 | 5394.76 | 763 | 741 | 185.4 |
| D | 2 | 250 | 238496 | 1282.54 | 763 | 741 | 185.4 |
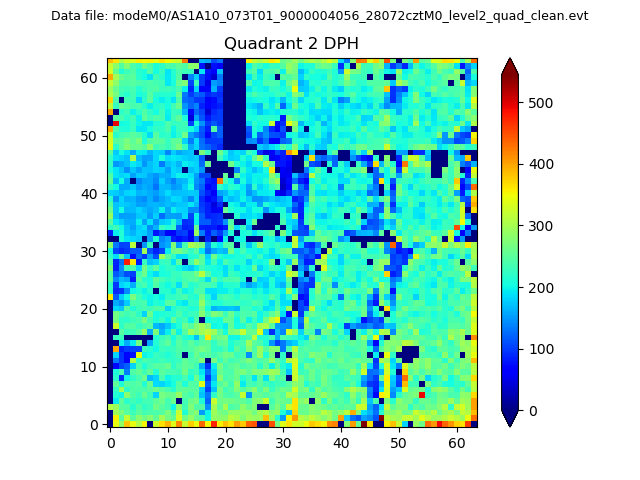
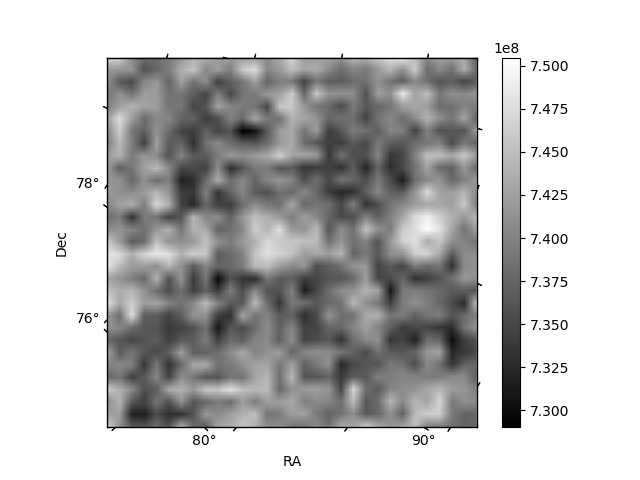
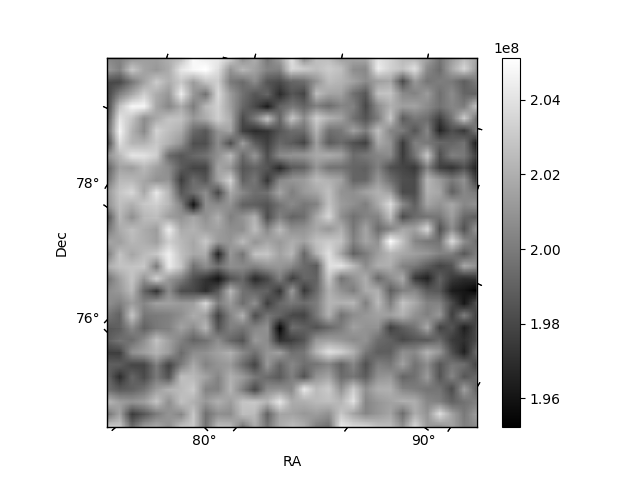
Histogram calculated using DETX and DETY for each event in the final _common_clean file
| Quadrant A | 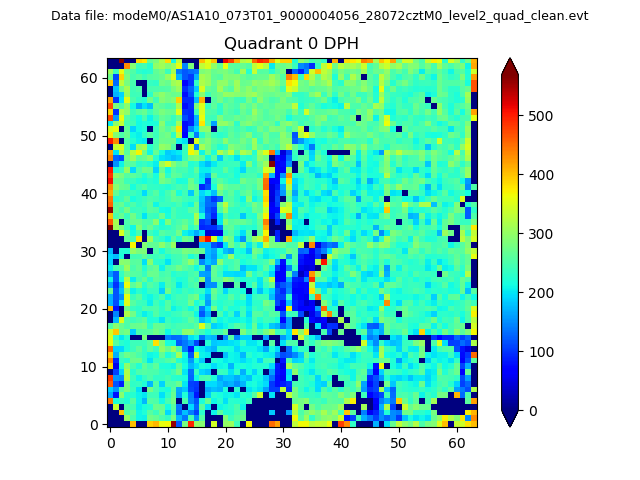 |
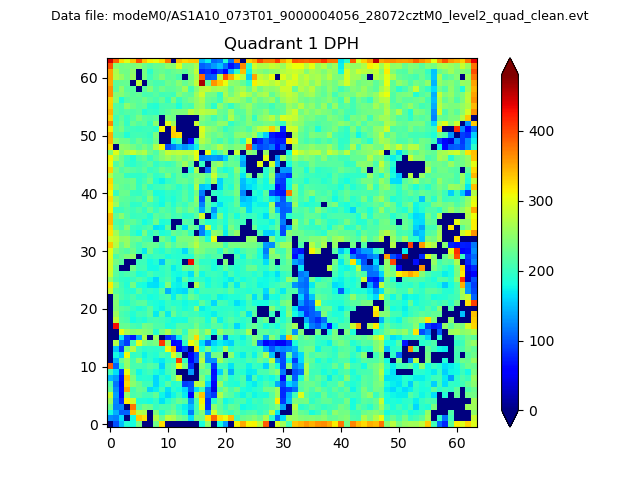 |
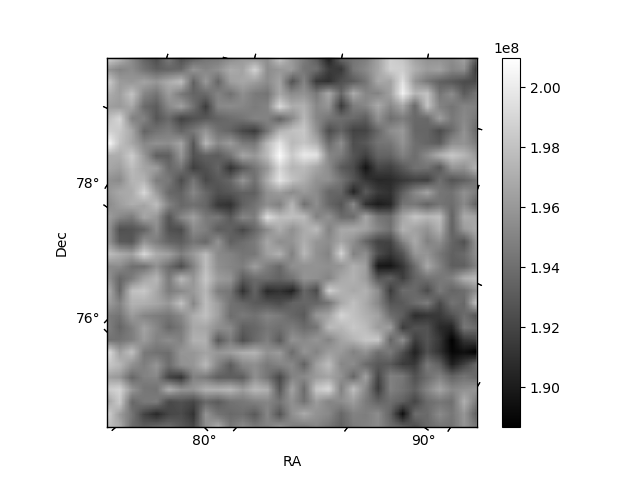
Quadrant B |
|---|---|---|---|
| Quadrant D | 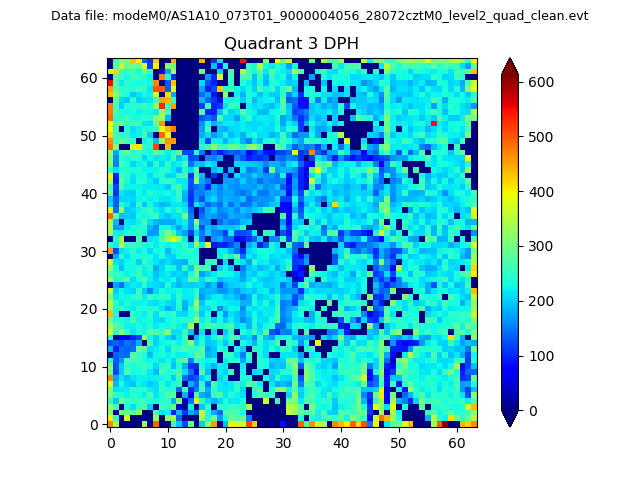 |
 |
Quadrant C |
| Plot type | Count rate plots | Images |
|---|---|---|
| Comparison with Poisson distribution Blue bars denote a histogram of data divided into 1 sec bins. Red curve is a Poisson curve with rate = median count rate of data. |
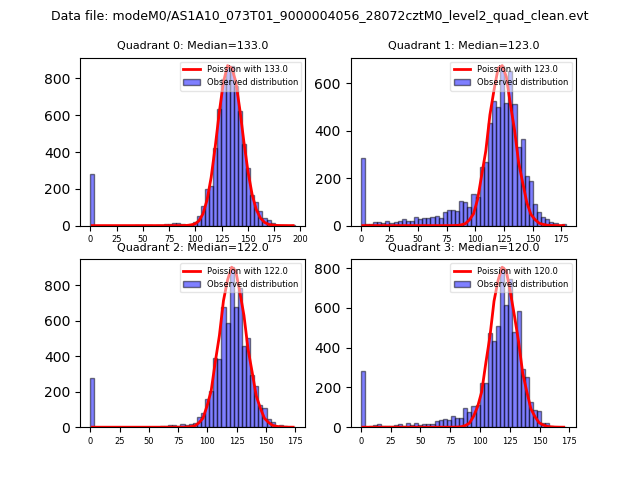 |
 |
| Quadrant-wise count rates Data is divided into 100 sec bins |
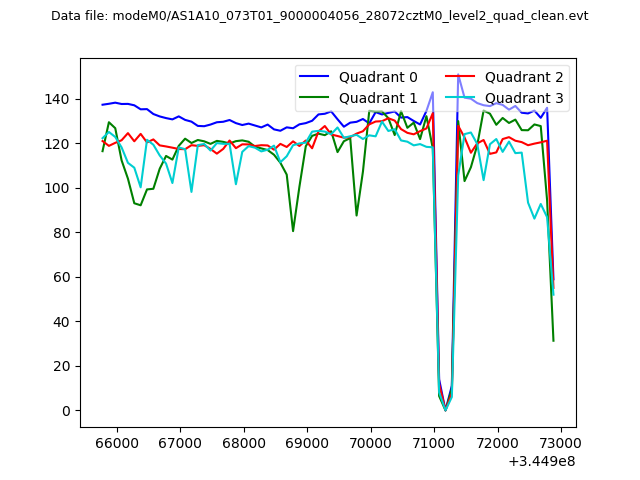 |
|
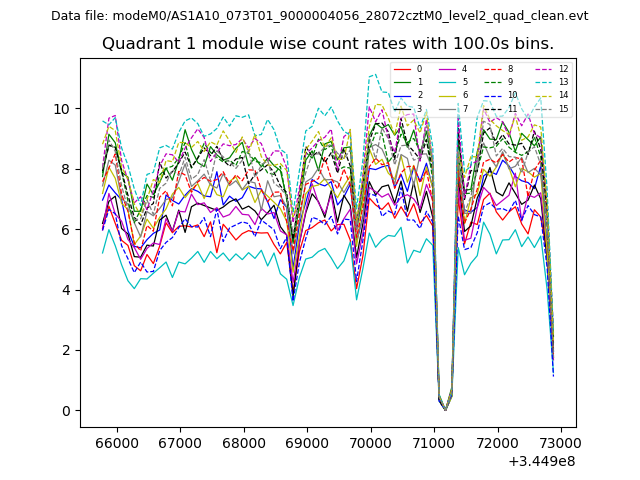
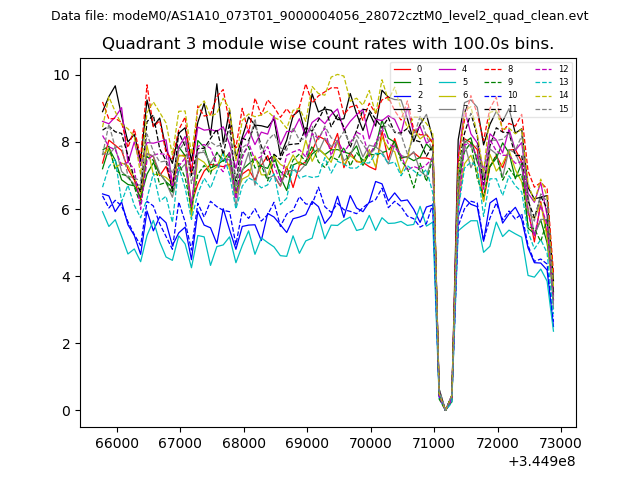
| Module-wise count rates for Quadrant A Data is divided into 100 sec bins |
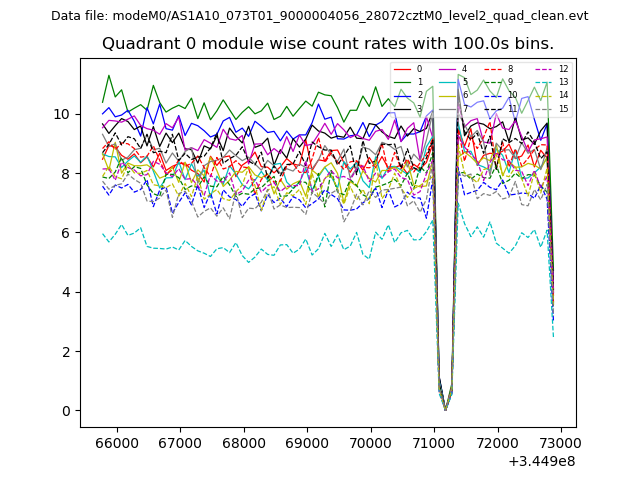 |
 |
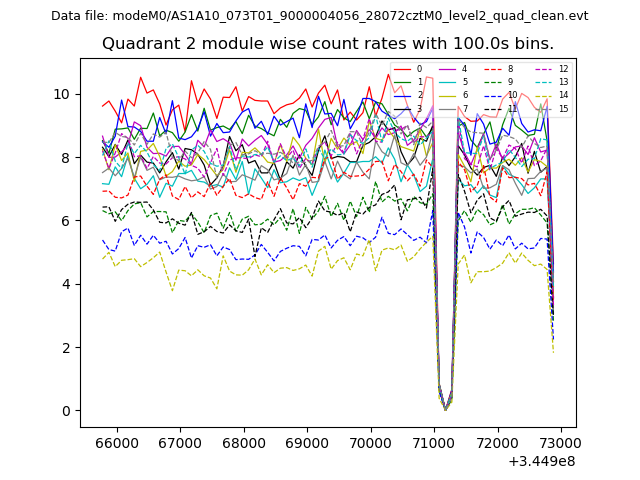
| Module-wise count rates for Quadrant B Data is divided into 100 sec bins |
 |
 |
| Module-wise count rates for Quadrant C Data is divided into 100 sec bins |
 |
 |
| Module-wise count rates for Quadrant D Data is divided into 100 sec bins |
 |
 |
| Parameter | Plot |
|---|---|
| CZT HV Monitor |  |
| D_VDD | 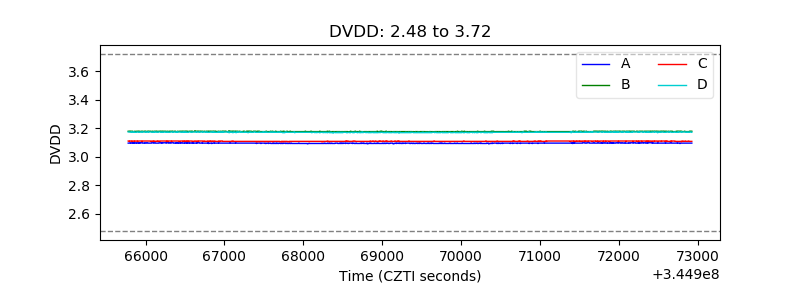 |
| Temperature 1 | 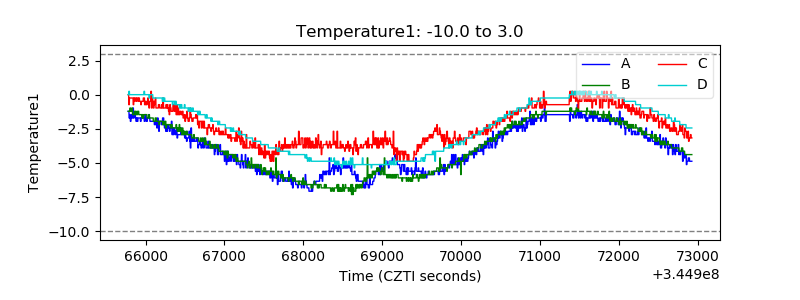 |
| Veto HV Monitor | 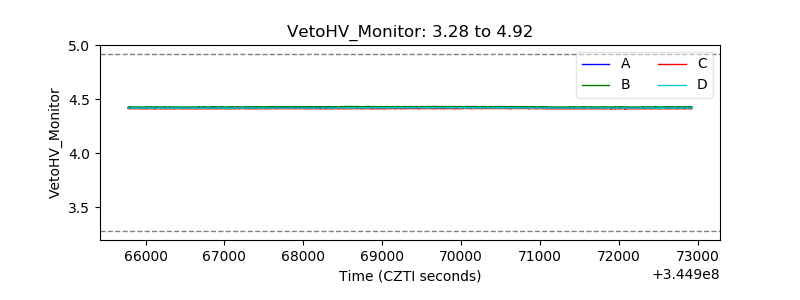 |
| Veto LLD | 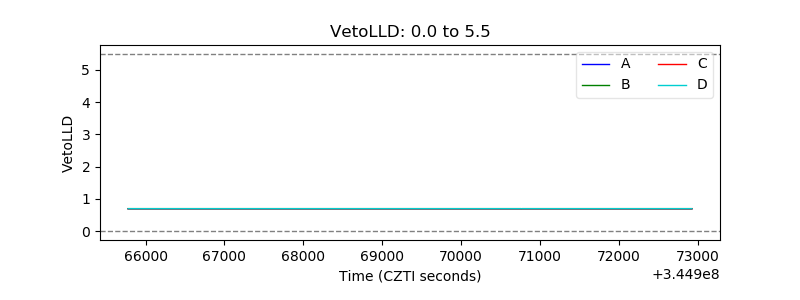 |
| Alpha Counter |  |
| _CPM_Rate | 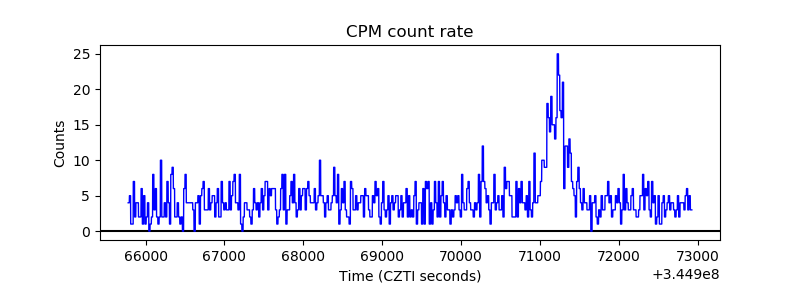 |
| CZT Counter | 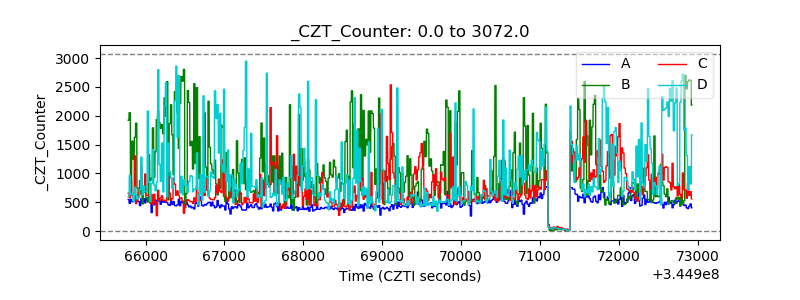 |
| +2.5 Volts monitor |  |
| +5 Volts monitor |  |
| _ROLL_ROT | 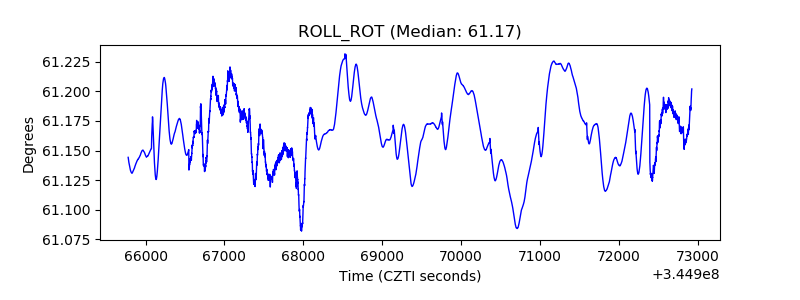 |
| _Roll_DEC | 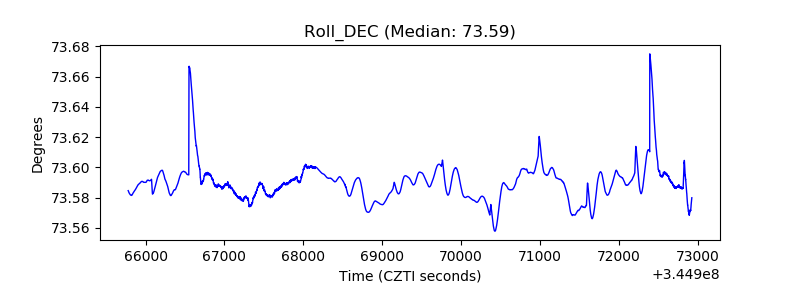 |
| _Roll_RA |  |
| Veto Counter | 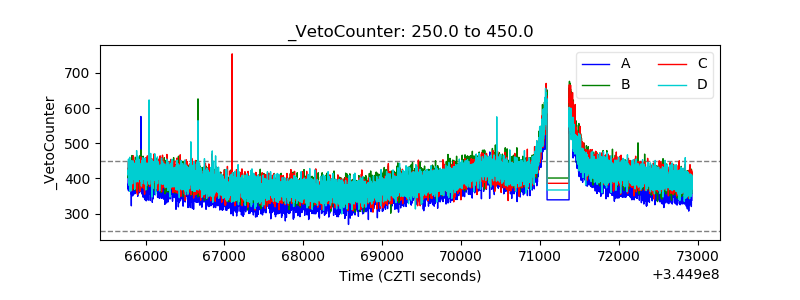 |