| Param | Original file | Final file |
|---|---|---|
| Filename | modeM0/AS1A10_073T01_9000004056_28075cztM0_level2.evt | modeM0/AS1A10_073T01_9000004056_28075cztM0_level2_quad_clean.evt |
| Size (bytes) | 2,214,158,400 | 328,095,360 |
| Size | 2.1 GB | 312.9 MB |
| Events in quadrant A | 8,639,402 | 2,359,342 |
| Events in quadrant B | 22,342,910 | 2,062,212 |
| Events in quadrant C | 16,277,856 | 2,165,305 |
| Events in quadrant D | 18,577,524 | 2,095,358 |
| Mode M9 | |||
|---|---|---|---|
| Quadrant | BADHDUFLAG | Total packets | Discarded packets |
| A | 0 | 18 | 0 |
| B | 0 | 18 | 0 |
| C | 0 | 18 | 0 |
| D | 0 | 18 | 0 |
| Mode M0 | |||
|---|---|---|---|
| Quadrant | BADHDUFLAG | Total packets | Discarded packets |
| A | 0 | 37823 | 0 |
| B | 0 | 79075 | 0 |
| C | 0 | 60974 | 0 |
| D | 0 | 68039 | 0 |
| Quadrant | Total seconds | Saturated seconds | Saturation percentage |
|---|---|---|---|
| A | 18173 | 67 | 0.368679% |
| B | 18174 | 4584 | 25.222846% |
| C | 18174 | 1438 | 7.912402% |
| D | 18174 | 2205 | 12.132717% |
Noise dominated data is calculated using 1-second bins in cleaned event files. If a bin has >2000 counts, and if more than 50% of those come from <1% of pixels, then it is considered to be noise-dominated and hence unusable.
| Quadrant | # 1 sec bins | Bins with >0 counts | Bins with >2000 counts | High rate bins dominated by noise | Noise dominated (total time) | Noise dominated (detector-on time) | Marked lightcurve |
|---|---|---|---|---|---|---|---|
| A | 19963 | 18176 | 9 | 9 | 0.05% | 0.05% | 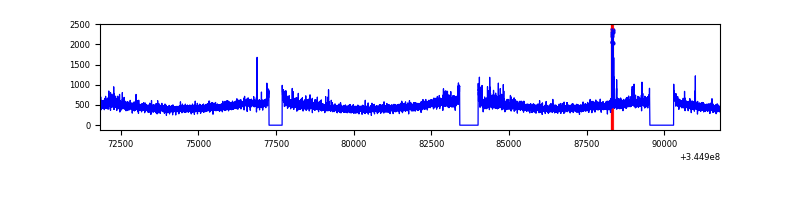 |
| B | 19964 | 18175 | 3439 | 3439 | 17.23% | 18.92% | 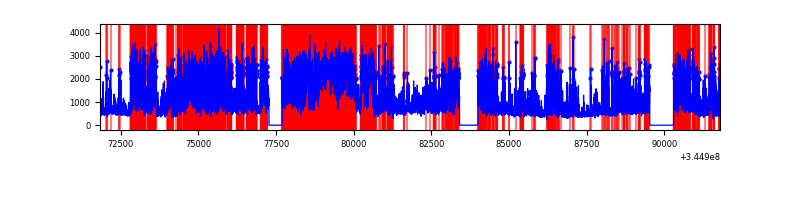 |
| C | 19964 | 18177 | 487 | 487 | 2.44% | 2.68% | 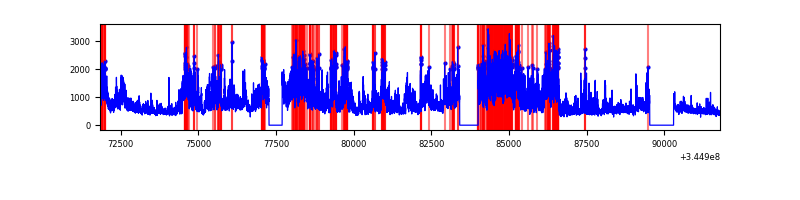 |
| D | 19964 | 18177 | 1777 | 1777 | 8.90% | 9.78% | 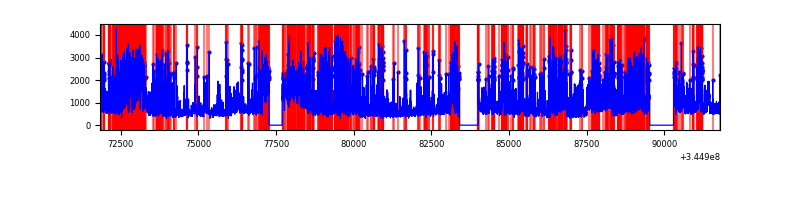 |
Top three noisy pixels from each quadrant. If the there are fewer than three noisy pixels in the level2.evt file, extra rows are filled as -1
| Pixel properties | Quadrant properties | ||||||
|---|---|---|---|---|---|---|---|
| Quadrant | DetID | PixID | Counts | Sigma | Mean | Median | Sigma |
| A | 0 | 13 | 283188 | 658.44 | 2144 | 2103 | 426.9 |
| A | 15 | 174 | 54137 | 121.89 | 2144 | 2103 | 426.9 |
| A | 13 | 254 | 31274 | 68.33 | 2144 | 2103 | 426.9 |
| B | 10 | 245 | 14515404 | 39767.94 | 1943 | 1893 | 365.0 |
| B | 0 | 190 | 79304 | 212.11 | 1943 | 1893 | 365.0 |
| B | 12 | 111 | 44864 | 117.74 | 1943 | 1893 | 365.0 |
| C | 3 | 233 | 8078329 | 17328.41 | 2013 | 2021 | 466.1 |
| C | 14 | 238 | 318697 | 679.46 | 2013 | 2021 | 466.1 |
| C | 2 | 16 | 36573 | 74.13 | 2013 | 2021 | 466.1 |
| D | 1 | 52 | 6482366 | 13704.8 | 1991 | 1937 | 472.9 |
| D | 8 | 195 | 2756534 | 5825.42 | 1991 | 1937 | 472.9 |
| D | 2 | 250 | 807137 | 1702.84 | 1991 | 1937 | 472.9 |
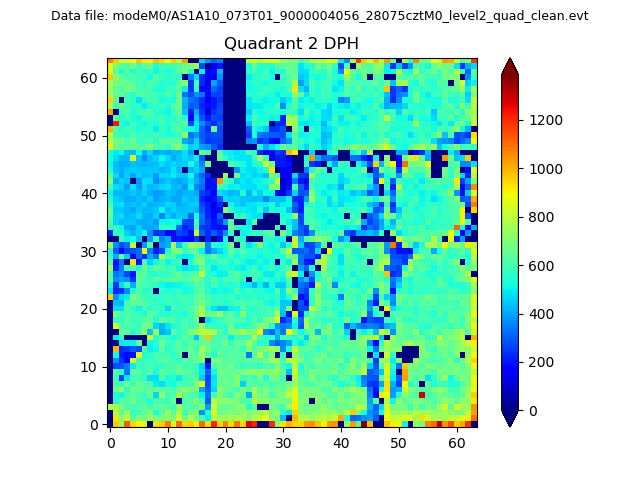
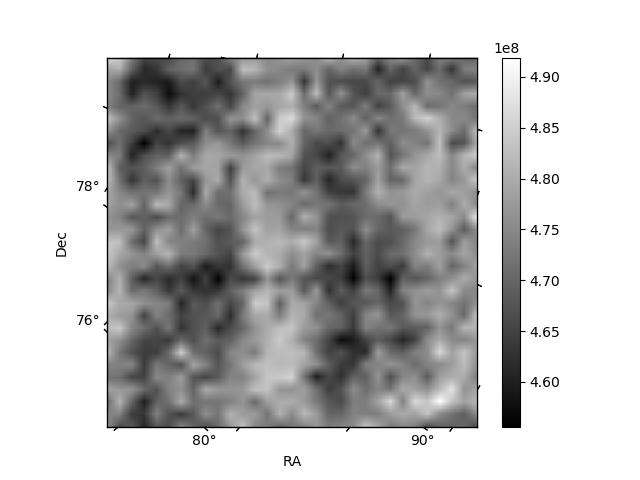
Histogram calculated using DETX and DETY for each event in the final _common_clean file
| Quadrant A | 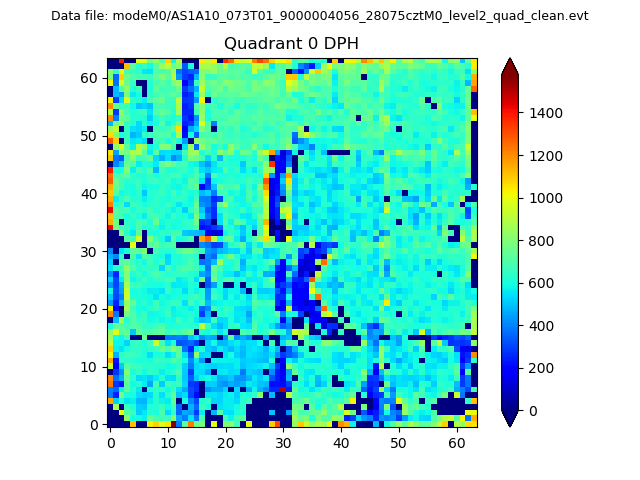 |
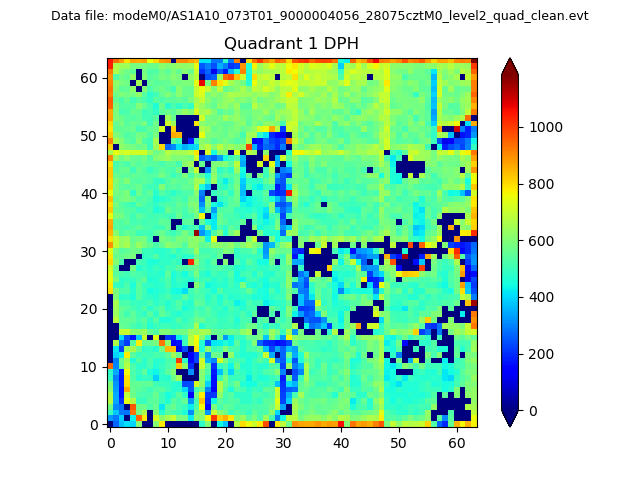 |
Quadrant B |
|---|---|---|---|
| Quadrant D | 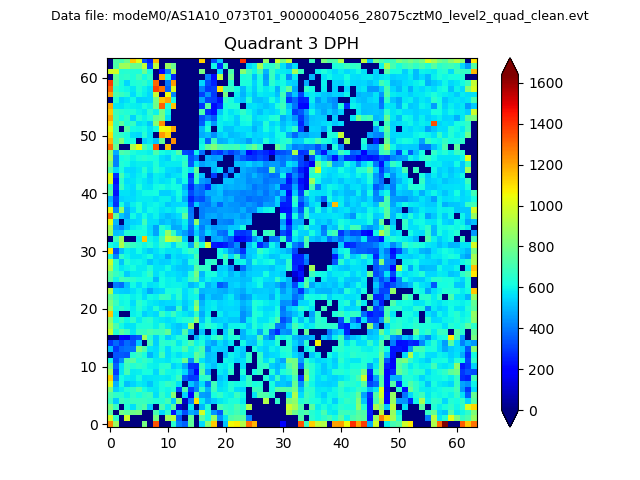 |
 |
Quadrant C |
| Plot type | Count rate plots | Images |
|---|---|---|
| Comparison with Poisson distribution Blue bars denote a histogram of data divided into 1 sec bins. Red curve is a Poisson curve with rate = median count rate of data. |
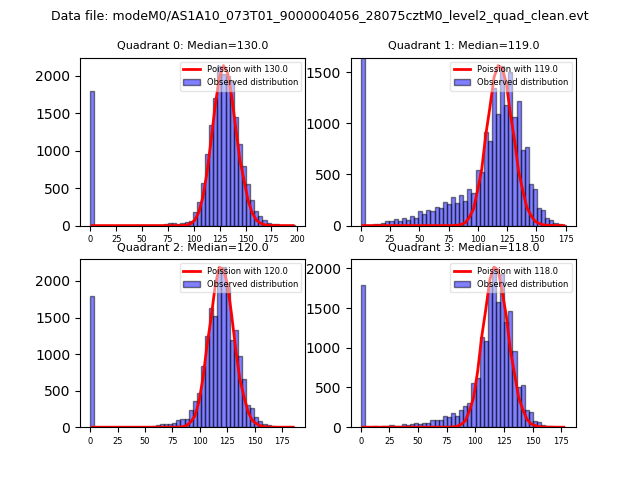 |
 |
| Quadrant-wise count rates Data is divided into 100 sec bins |
 |
|
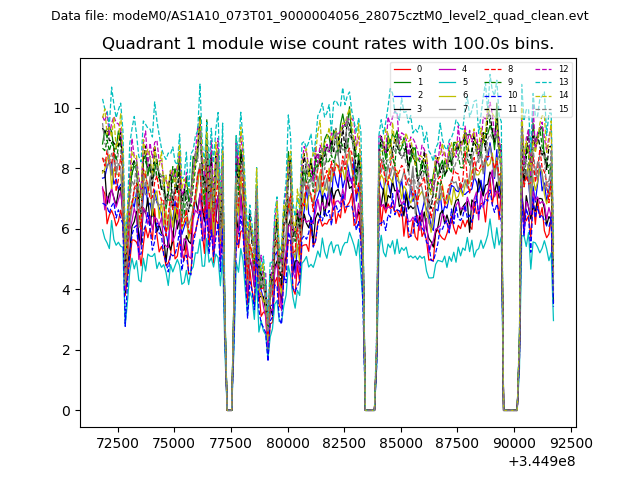
| Module-wise count rates for Quadrant A Data is divided into 100 sec bins |
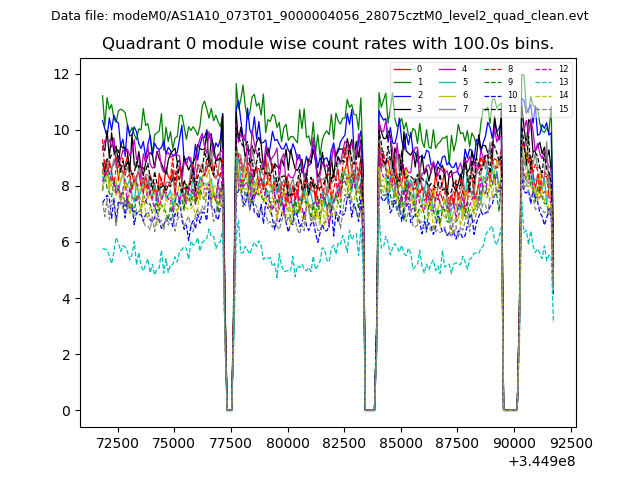 |
 |
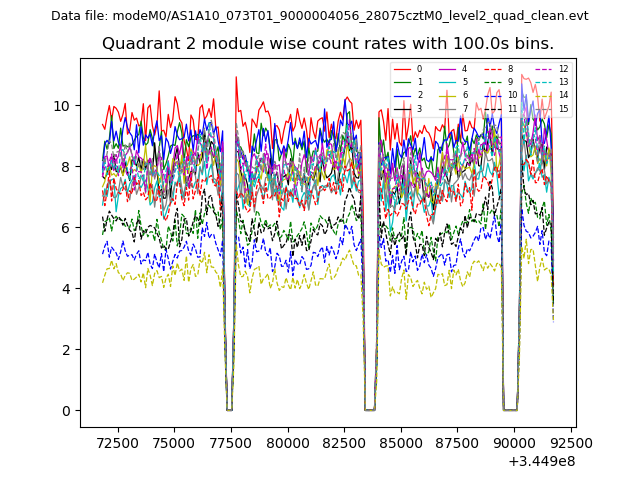
| Module-wise count rates for Quadrant B Data is divided into 100 sec bins |
 |
 |
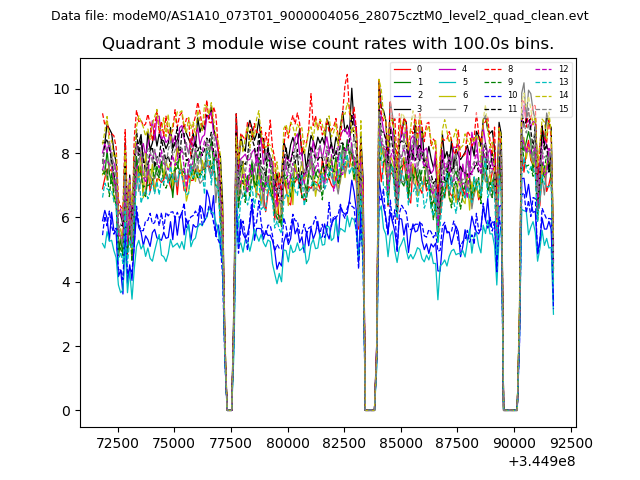
| Module-wise count rates for Quadrant C Data is divided into 100 sec bins |
 |
 |
| Module-wise count rates for Quadrant D Data is divided into 100 sec bins |
 |
 |
| Parameter | Plot |
|---|---|
| CZT HV Monitor | 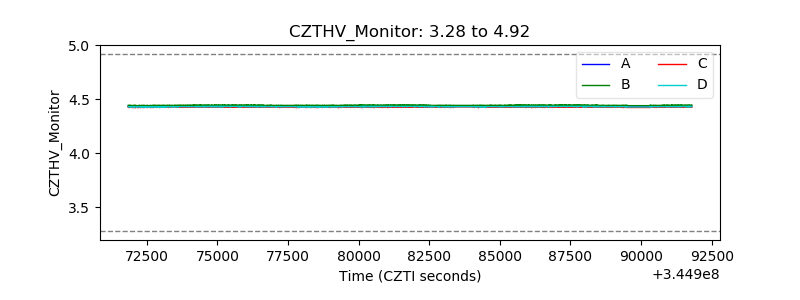 |
| D_VDD | 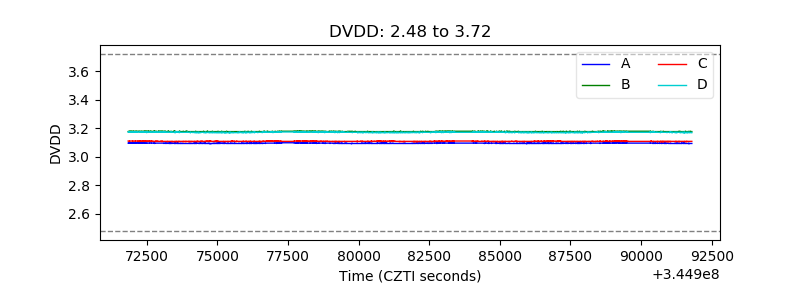 |
| Temperature 1 | 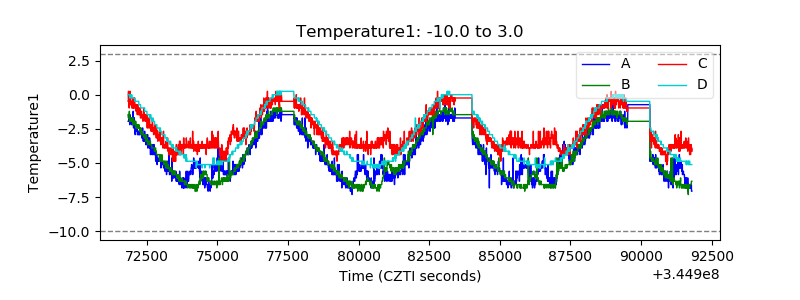 |
| Veto HV Monitor | 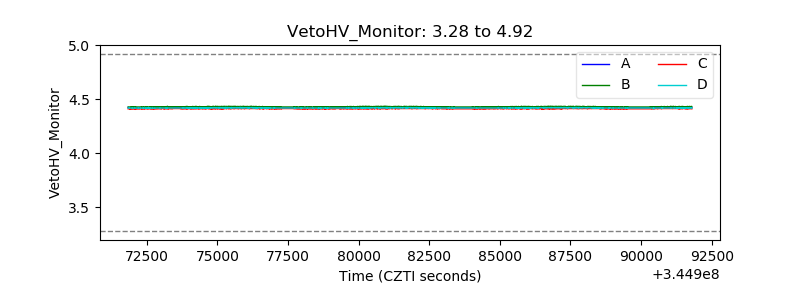 |
| Veto LLD | 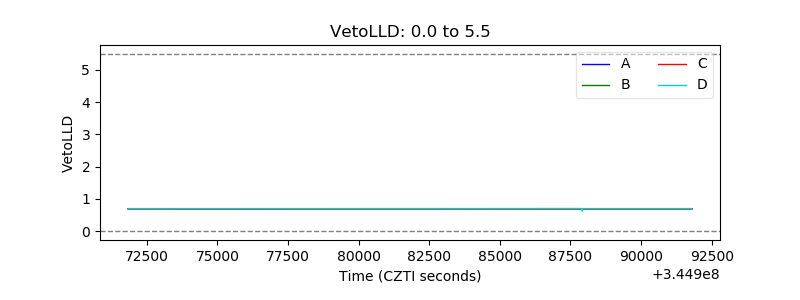 |
| Alpha Counter | 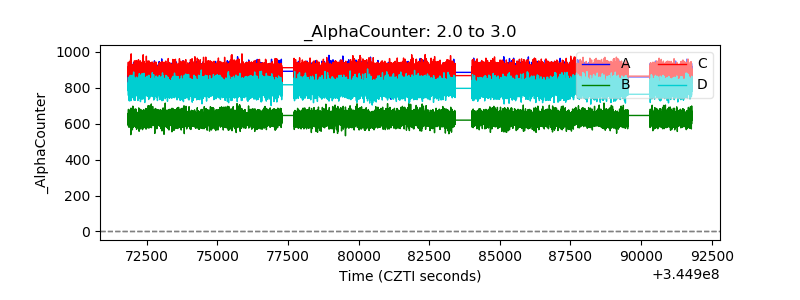 |
| _CPM_Rate | 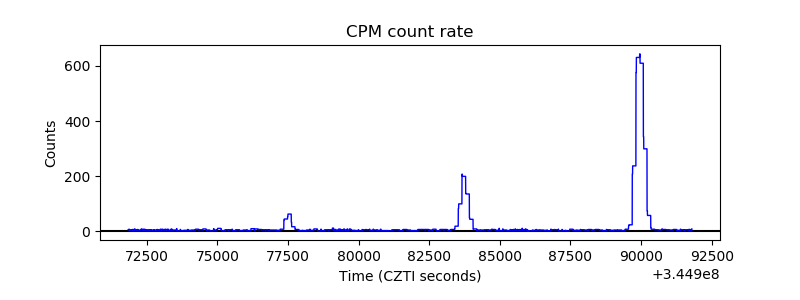 |
| CZT Counter | 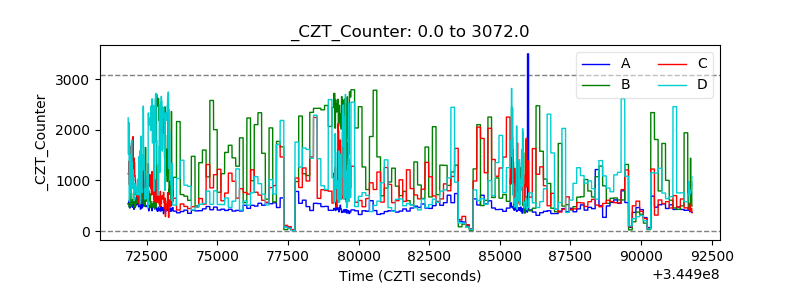 |
| +2.5 Volts monitor |  |
| +5 Volts monitor |  |
| _ROLL_ROT | 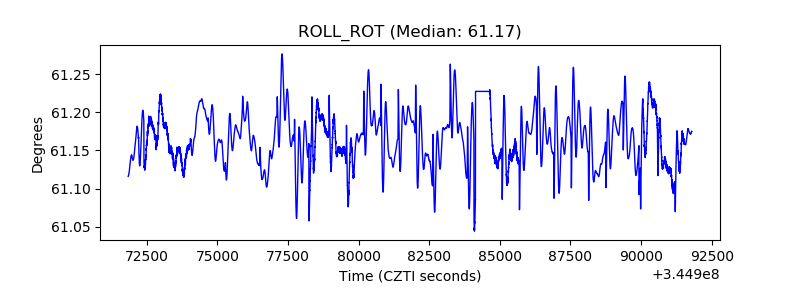 |
| _Roll_DEC | 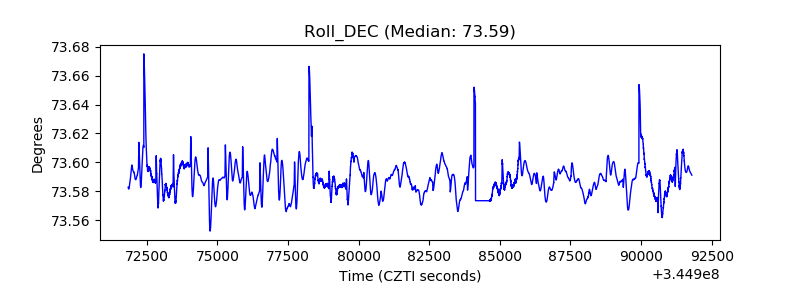 |
| _Roll_RA | 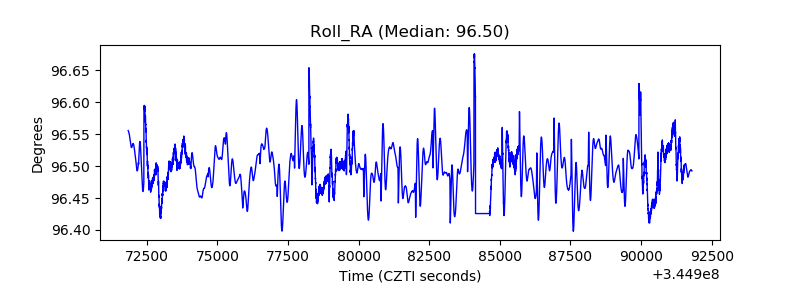 |
| Veto Counter | 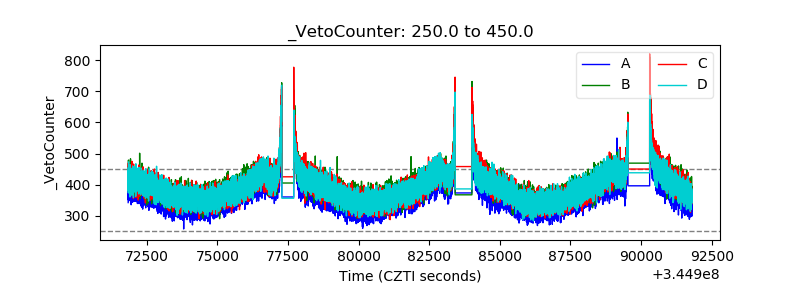 |