| Param | Original file | Final file |
|---|---|---|
| Filename | modeM0/AS1A10_073T01_9000004056_28076cztM0_level2.evt | modeM0/AS1A10_073T01_9000004056_28076cztM0_level2_quad_clean.evt |
| Size (bytes) | 722,738,880 | 127,437,120 |
| Size | 689.3 MB | 121.5 MB |
| Events in quadrant A | 3,187,215 | 901,979 |
| Events in quadrant B | 6,242,904 | 855,843 |
| Events in quadrant C | 5,524,834 | 830,930 |
| Events in quadrant D | 6,473,287 | 795,497 |
| Mode M9 | |||
|---|---|---|---|
| Quadrant | BADHDUFLAG | Total packets | Discarded packets |
| A | 0 | 12 | 0 |
| B | 0 | 13 | 0 |
| C | 0 | 13 | 0 |
| D | 0 | 13 | 0 |
| Mode M0 | |||
|---|---|---|---|
| Quadrant | BADHDUFLAG | Total packets | Discarded packets |
| A | 0 | 13989 | 0 |
| B | 0 | 23215 | 0 |
| C | 0 | 21282 | 0 |
| D | 0 | 24087 | 0 |
| Quadrant | Total seconds | Saturated seconds | Saturation percentage |
|---|---|---|---|
| A | 6818 | 12 | 0.176005% |
| B | 6818 | 731 | 10.721619% |
| C | 6818 | 563 | 8.257554% |
| D | 6818 | 787 | 11.542974% |
Noise dominated data is calculated using 1-second bins in cleaned event files. If a bin has >2000 counts, and if more than 50% of those come from <1% of pixels, then it is considered to be noise-dominated and hence unusable.
| Quadrant | # 1 sec bins | Bins with >0 counts | Bins with >2000 counts | High rate bins dominated by noise | Noise dominated (total time) | Noise dominated (detector-on time) | Marked lightcurve |
|---|---|---|---|---|---|---|---|
| A | 7763 | 6819 | 2 | 2 | 0.03% | 0.03% | 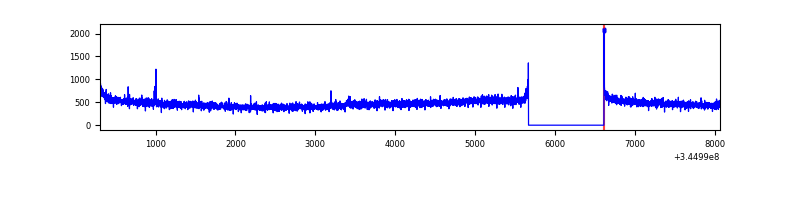 |
| B | 7763 | 6819 | 448 | 448 | 5.77% | 6.57% | 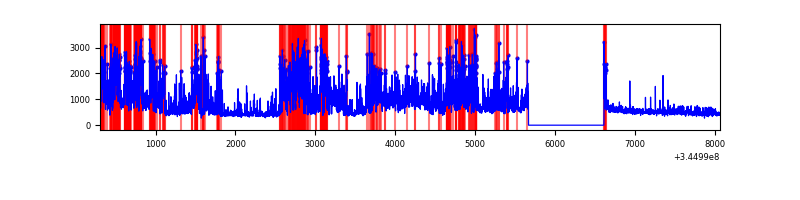 |
| C | 7763 | 6819 | 283 | 283 | 3.65% | 4.15% | 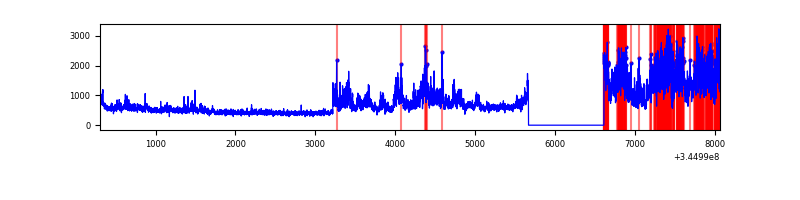 |
| D | 7763 | 6819 | 612 | 612 | 7.88% | 8.97% | 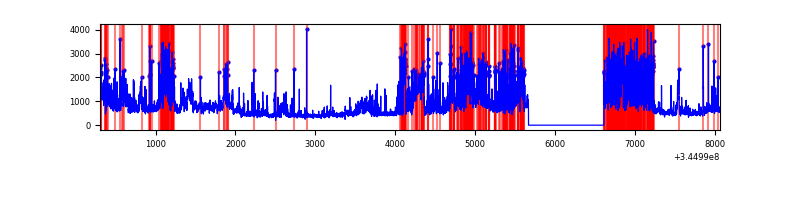 |
Top three noisy pixels from each quadrant. If the there are fewer than three noisy pixels in the level2.evt file, extra rows are filled as -1
| Pixel properties | Quadrant properties | ||||||
|---|---|---|---|---|---|---|---|
| Quadrant | DetID | PixID | Counts | Sigma | Mean | Median | Sigma |
| A | 0 | 13 | 53195 | 322.71 | 808 | 792 | 162.4 |
| A | 13 | 254 | 11428 | 65.5 | 808 | 792 | 162.4 |
| A | 3 | 137 | 7802 | 43.17 | 808 | 792 | 162.4 |
| B | 10 | 245 | 3143105 | 21389.27 | 778 | 759 | 146.9 |
| B | 12 | 111 | 18161 | 118.45 | 778 | 759 | 146.9 |
| B | 11 | 111 | 16072 | 104.23 | 778 | 759 | 146.9 |
| C | 3 | 233 | 2427793 | 13501.48 | 763 | 766 | 179.8 |
| C | 14 | 238 | 122407 | 676.69 | 763 | 766 | 179.8 |
| C | 13 | 61 | 5136 | 24.31 | 763 | 766 | 179.8 |
| D | 1 | 52 | 2290295 | 13029.86 | 740 | 719 | 175.7 |
| D | 8 | 195 | 747359 | 4249.09 | 740 | 719 | 175.7 |
| D | 2 | 250 | 402790 | 2288.17 | 740 | 719 | 175.7 |
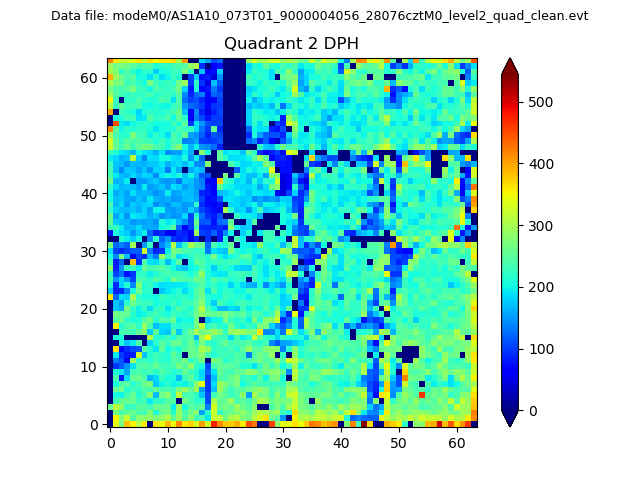
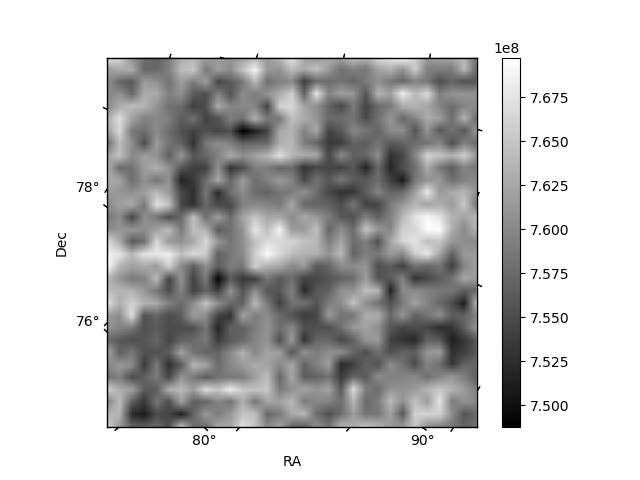
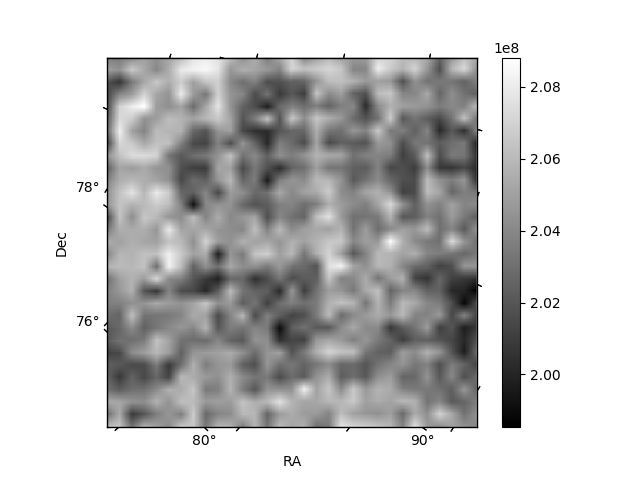
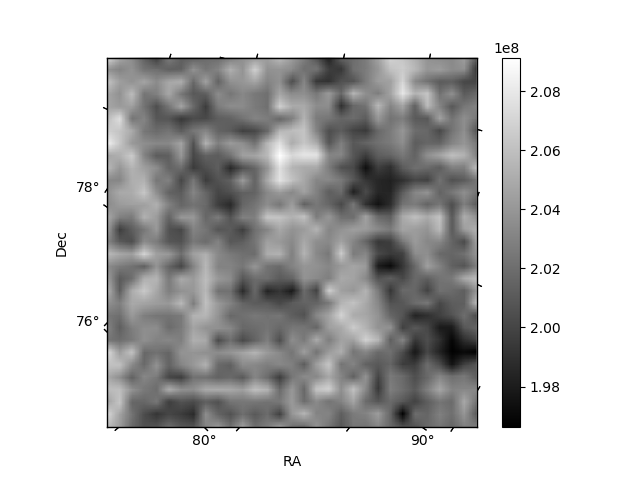
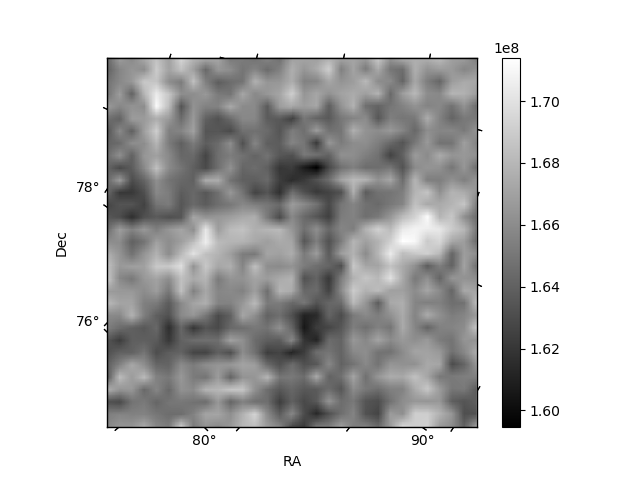
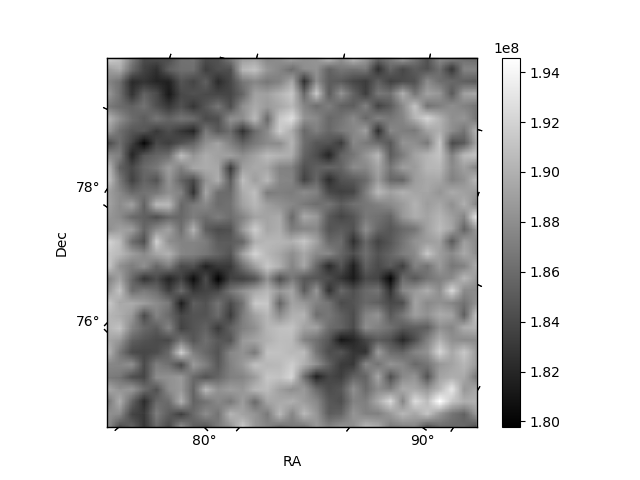
Histogram calculated using DETX and DETY for each event in the final _common_clean file
| Quadrant A | 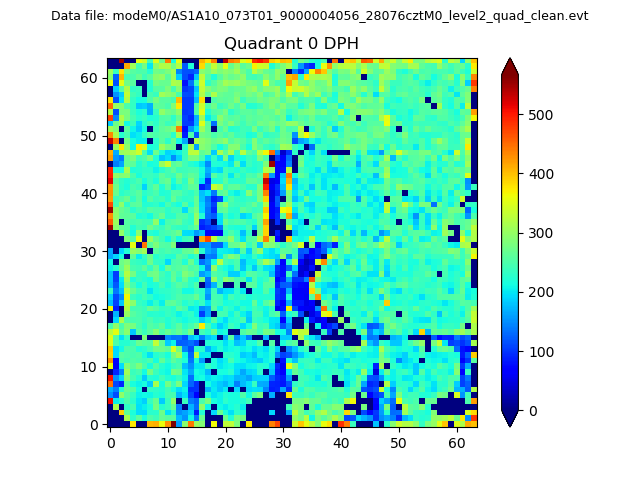 |
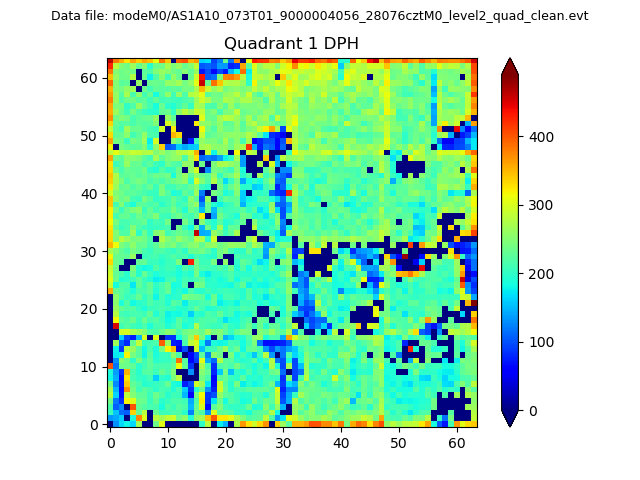 |
Quadrant B |
|---|---|---|---|
| Quadrant D | 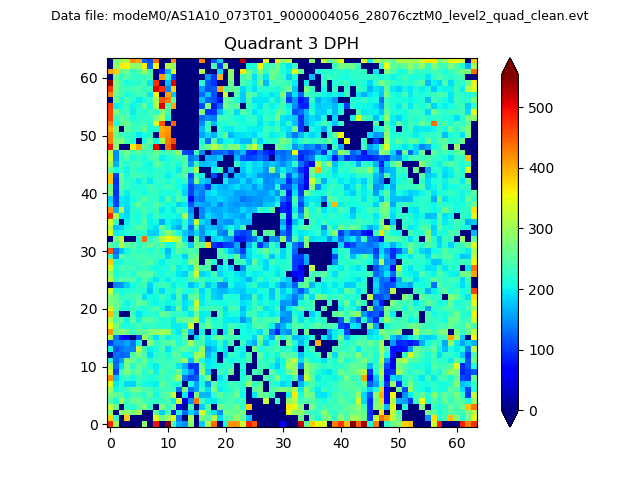 |
 |
Quadrant C |
| Plot type | Count rate plots | Images |
|---|---|---|
| Comparison with Poisson distribution Blue bars denote a histogram of data divided into 1 sec bins. Red curve is a Poisson curve with rate = median count rate of data. |
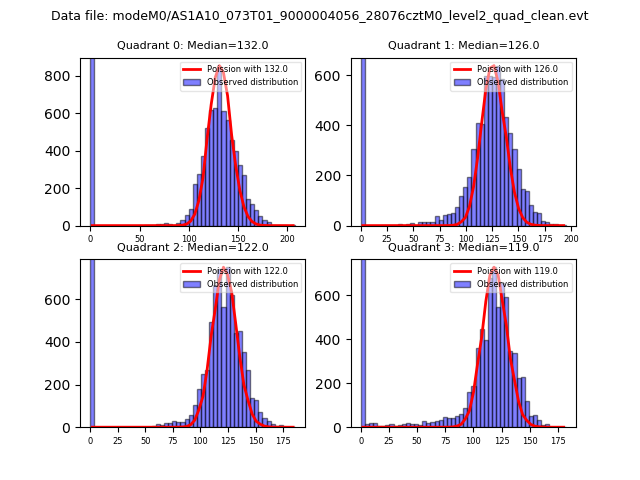 |
 |
| Quadrant-wise count rates Data is divided into 100 sec bins |
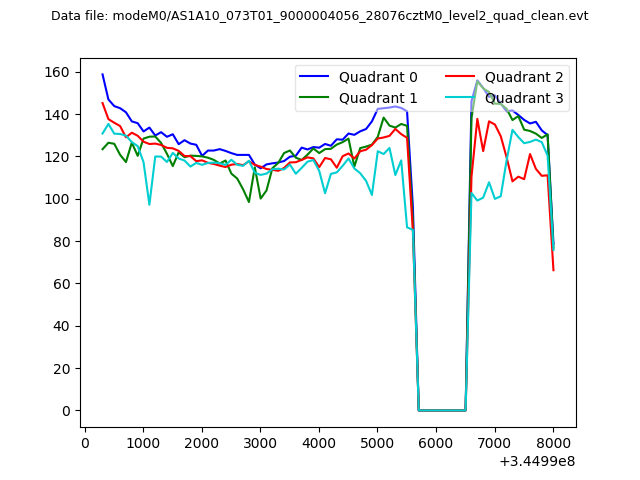 |
|
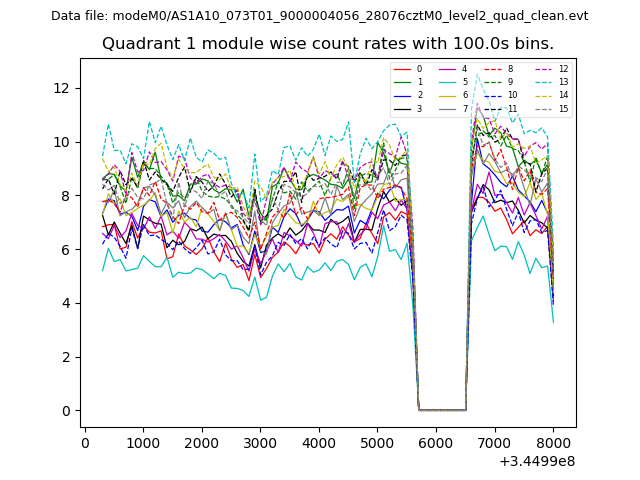
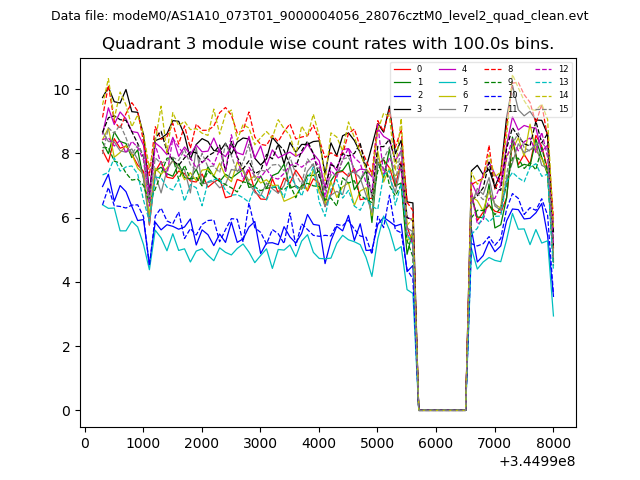
| Module-wise count rates for Quadrant A Data is divided into 100 sec bins |
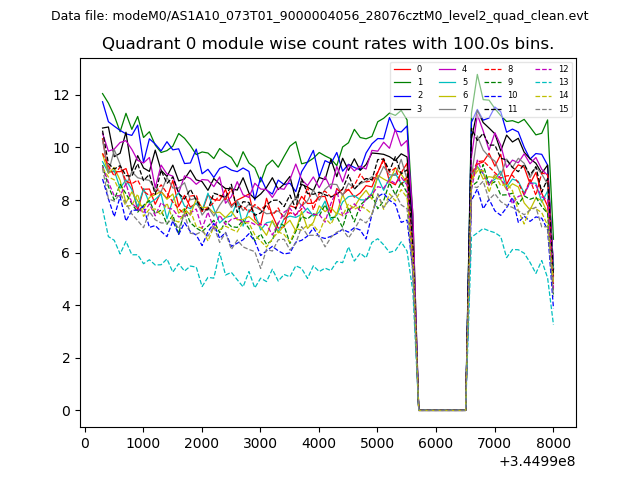 |
 |
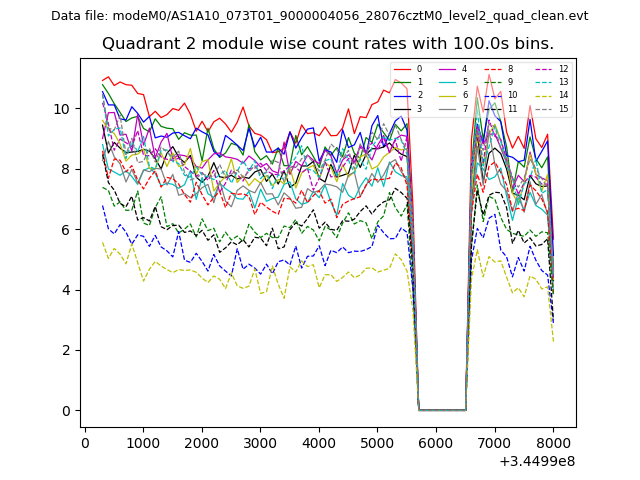
| Module-wise count rates for Quadrant B Data is divided into 100 sec bins |
 |
 |
| Module-wise count rates for Quadrant C Data is divided into 100 sec bins |
 |
 |
| Module-wise count rates for Quadrant D Data is divided into 100 sec bins |
 |
 |
| Parameter | Plot |
|---|---|
| CZT HV Monitor | 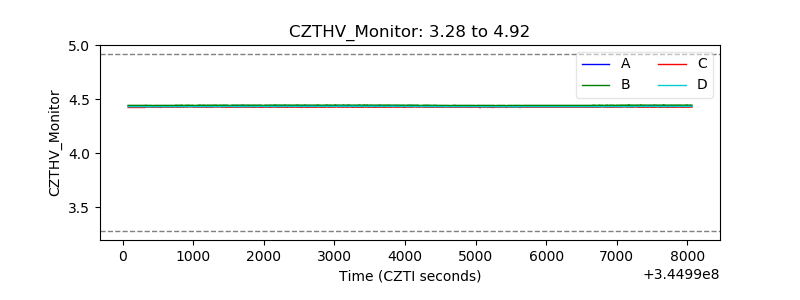 |
| D_VDD | 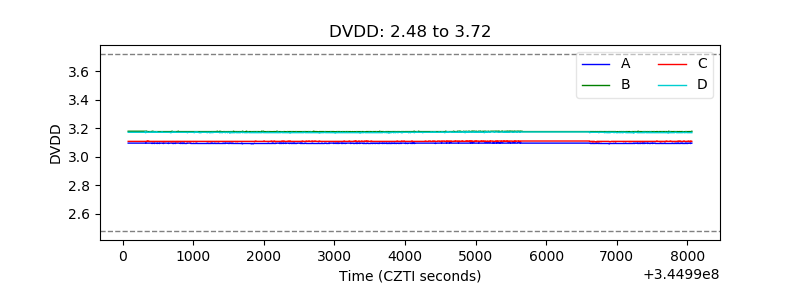 |
| Temperature 1 | 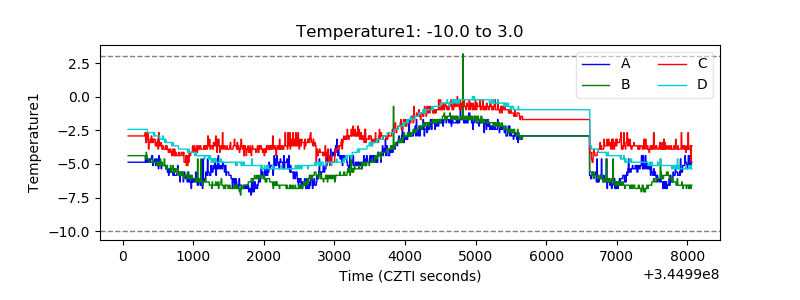 |
| Veto HV Monitor |  |
| Veto LLD | 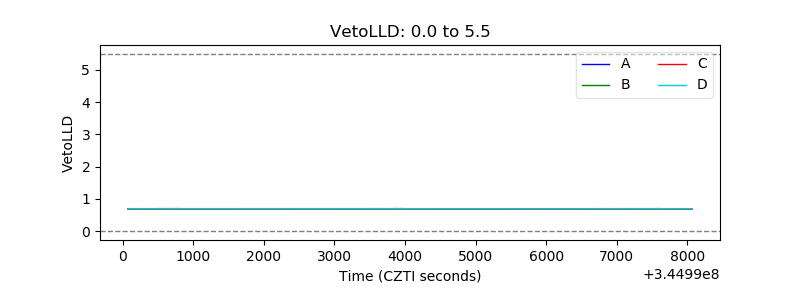 |
| Alpha Counter | 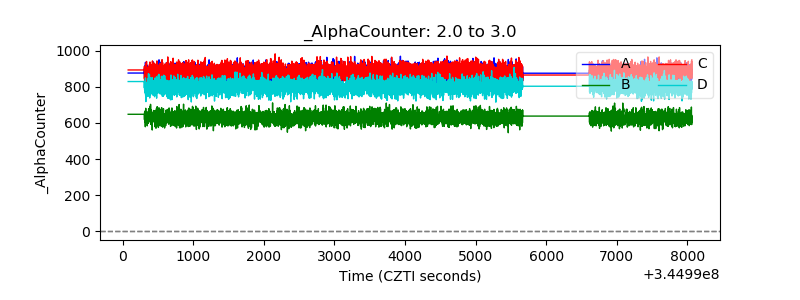 |
| _CPM_Rate |  |
| CZT Counter | 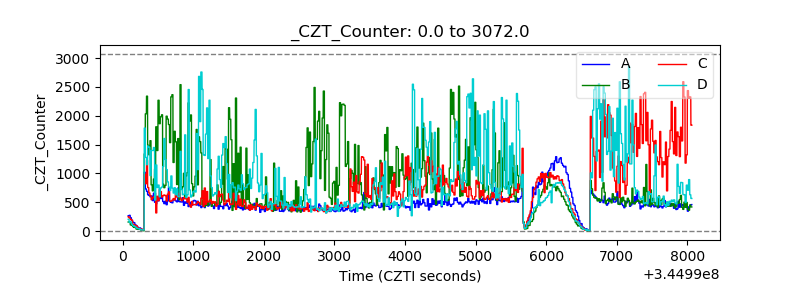 |
| +2.5 Volts monitor | 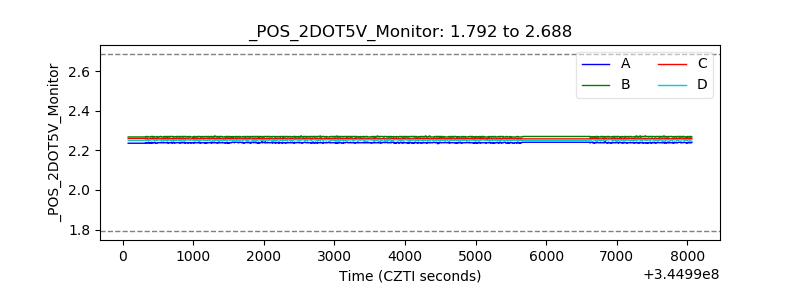 |
| +5 Volts monitor |  |
| _ROLL_ROT | 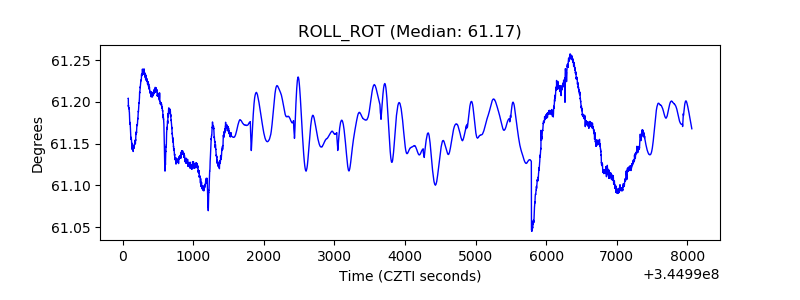 |
| _Roll_DEC | 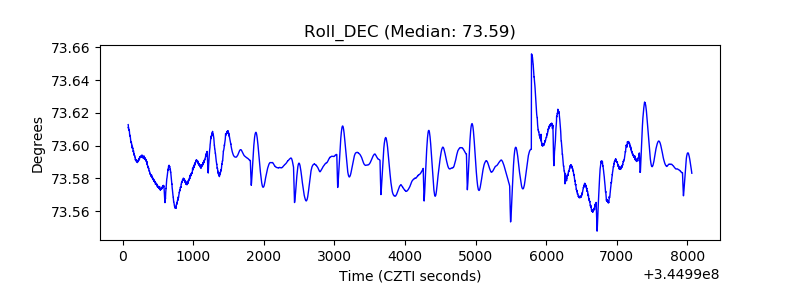 |
| _Roll_RA | 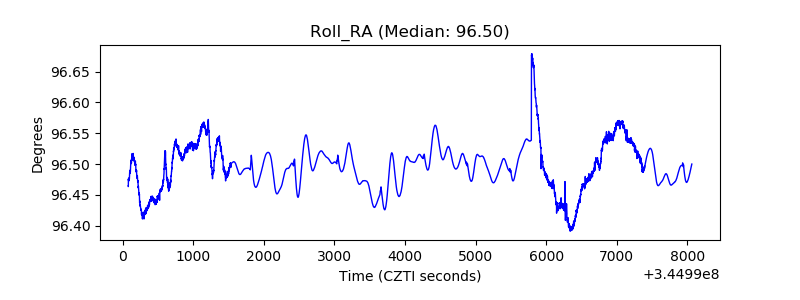 |
| Veto Counter | 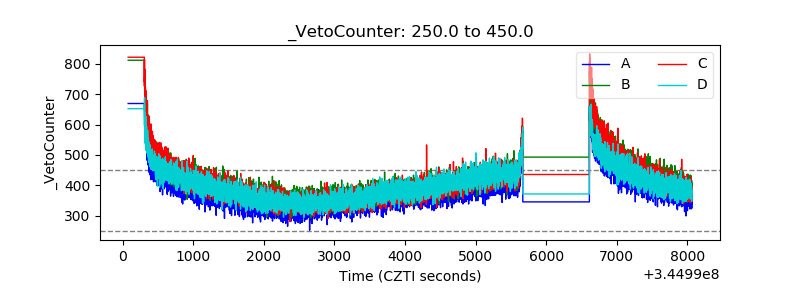 |