| Param | Original file | Final file |
|---|---|---|
| Filename | modeM0/AS1A10_073T01_9000004056_28078cztM0_level2.evt | modeM0/AS1A10_073T01_9000004056_28078cztM0_level2_quad_clean.evt |
| Size (bytes) | 753,981,120 | 129,366,720 |
| Size | 719.1 MB | 123.4 MB |
| Events in quadrant A | 3,168,127 | 924,056 |
| Events in quadrant B | 6,059,556 | 875,739 |
| Events in quadrant C | 7,964,694 | 817,406 |
| Events in quadrant D | 5,188,028 | 831,078 |
| Mode M9 | |||
|---|---|---|---|
| Quadrant | BADHDUFLAG | Total packets | Discarded packets |
| A | 0 | 14 | 0 |
| B | 0 | 15 | 0 |
| C | 0 | 15 | 0 |
| D | 0 | 15 | 0 |
| Mode M0 | |||
|---|---|---|---|
| Quadrant | BADHDUFLAG | Total packets | Discarded packets |
| A | 0 | 13818 | 0 |
| B | 0 | 22582 | 0 |
| C | 0 | 28384 | 0 |
| D | 0 | 20044 | 0 |
| Quadrant | Total seconds | Saturated seconds | Saturation percentage |
|---|---|---|---|
| A | 6732 | 16 | 0.237671% |
| B | 6732 | 778 | 11.556744% |
| C | 6732 | 1032 | 15.329768% |
| D | 6731 | 446 | 6.626059% |
Noise dominated data is calculated using 1-second bins in cleaned event files. If a bin has >2000 counts, and if more than 50% of those come from <1% of pixels, then it is considered to be noise-dominated and hence unusable.
| Quadrant | # 1 sec bins | Bins with >0 counts | Bins with >2000 counts | High rate bins dominated by noise | Noise dominated (total time) | Noise dominated (detector-on time) | Marked lightcurve |
|---|---|---|---|---|---|---|---|
| A | 7817 | 6733 | 2 | 2 | 0.03% | 0.03% | 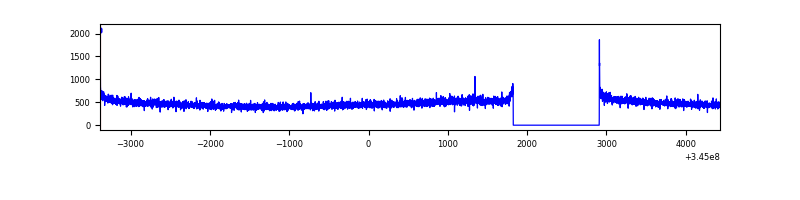 |
| B | 7816 | 6731 | 475 | 475 | 6.08% | 7.06% | 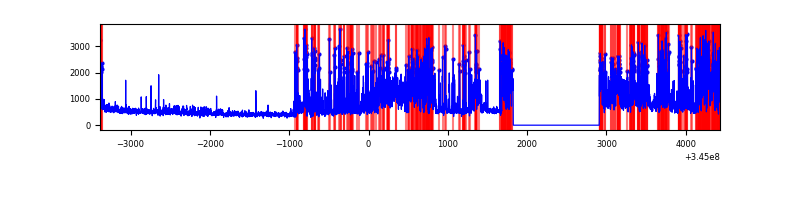 |
| C | 7817 | 6733 | 616 | 616 | 7.88% | 9.15% | 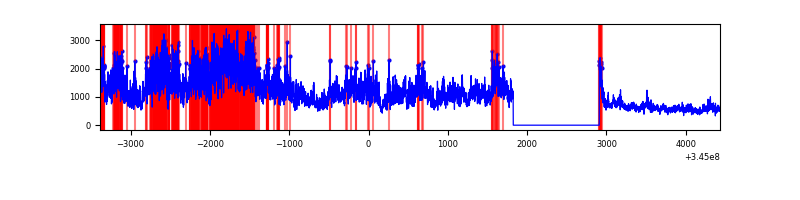 |
| D | 7816 | 6731 | 399 | 399 | 5.10% | 5.93% | 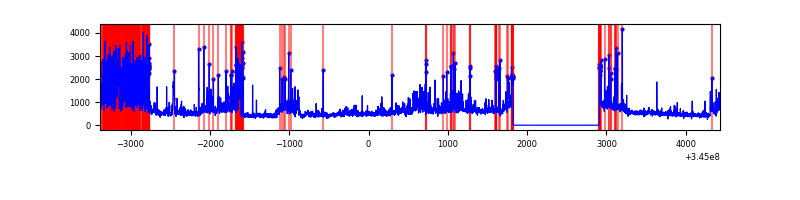 |
Top three noisy pixels from each quadrant. If the there are fewer than three noisy pixels in the level2.evt file, extra rows are filled as -1
| Pixel properties | Quadrant properties | ||||||
|---|---|---|---|---|---|---|---|
| Quadrant | DetID | PixID | Counts | Sigma | Mean | Median | Sigma |
| A | 0 | 13 | 33280 | 201.68 | 809 | 795 | 161.1 |
| A | 13 | 254 | 11660 | 67.45 | 809 | 795 | 161.1 |
| A | 8 | 192 | 10447 | 59.92 | 809 | 795 | 161.1 |
| B | 10 | 245 | 2955255 | 20268.69 | 777 | 756 | 145.8 |
| B | 0 | 190 | 18994 | 125.12 | 777 | 756 | 145.8 |
| B | 12 | 111 | 17946 | 117.93 | 777 | 756 | 145.8 |
| C | 3 | 233 | 4940410 | 28281.76 | 745 | 748 | 174.7 |
| C | 14 | 238 | 119334 | 678.96 | 745 | 748 | 174.7 |
| C | 13 | 61 | 5111 | 24.98 | 745 | 748 | 174.7 |
| D | 1 | 52 | 923226 | 5218.9 | 750 | 731 | 176.8 |
| D | 8 | 195 | 785550 | 4440.01 | 750 | 731 | 176.8 |
| D | 7 | 80 | 463942 | 2620.56 | 750 | 731 | 176.8 |
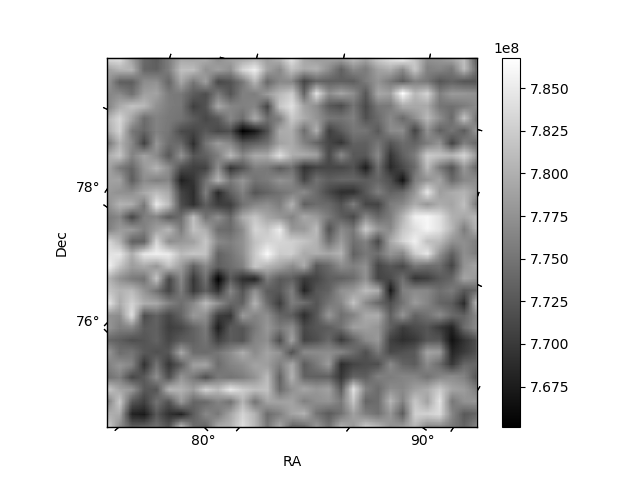
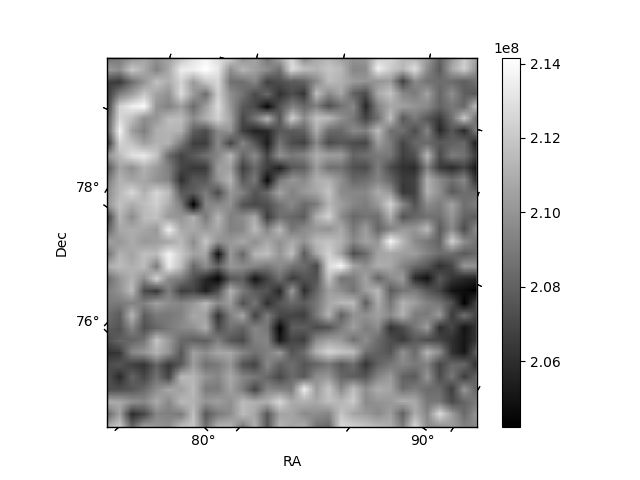
Histogram calculated using DETX and DETY for each event in the final _common_clean file
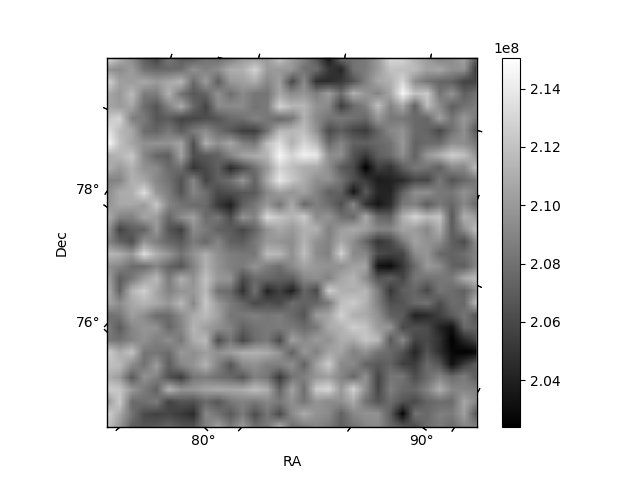
| Quadrant A | 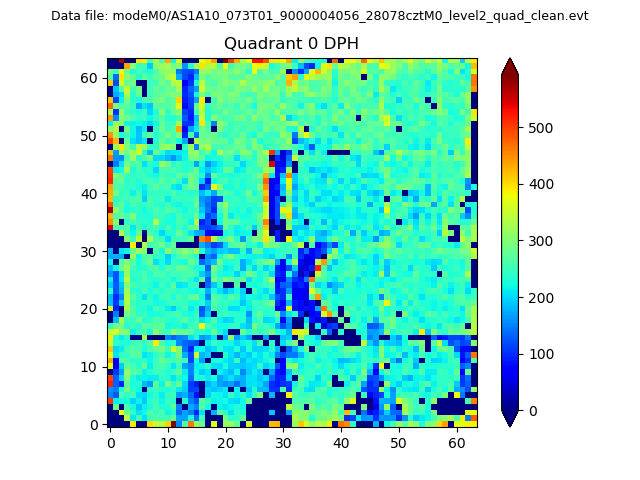 |
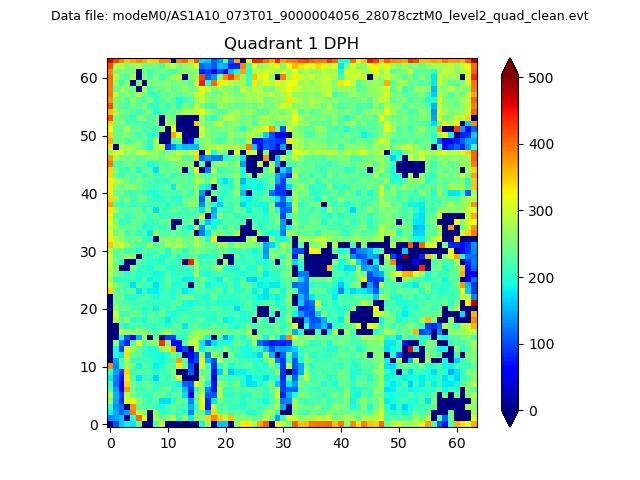 |
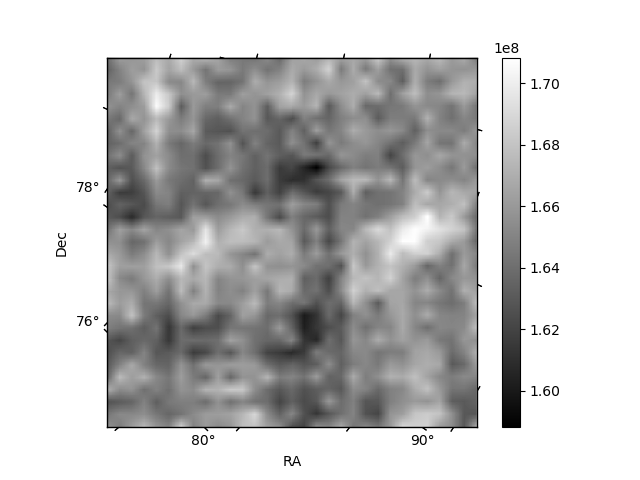
Quadrant B |
|---|---|---|---|
| Quadrant D |  |
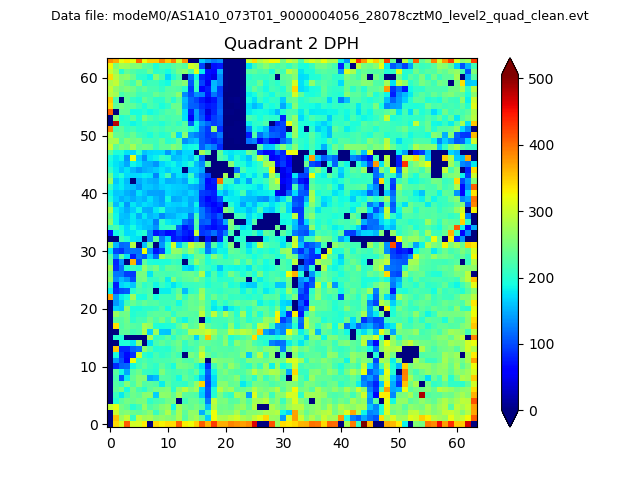 |
Quadrant C |
| Plot type | Count rate plots | Images |
|---|---|---|
| Comparison with Poisson distribution Blue bars denote a histogram of data divided into 1 sec bins. Red curve is a Poisson curve with rate = median count rate of data. |
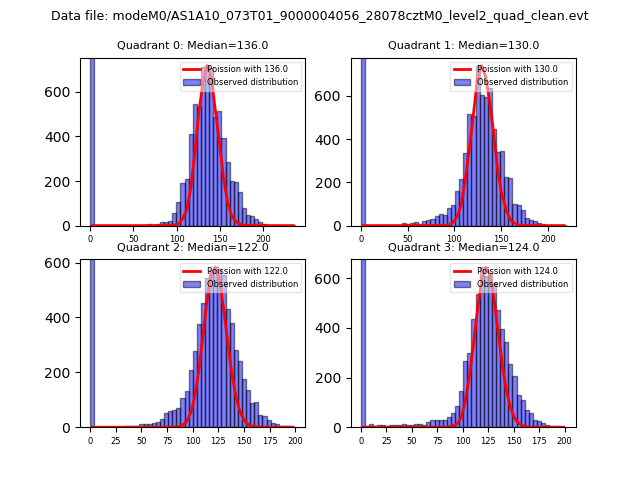 |
 |
| Quadrant-wise count rates Data is divided into 100 sec bins |
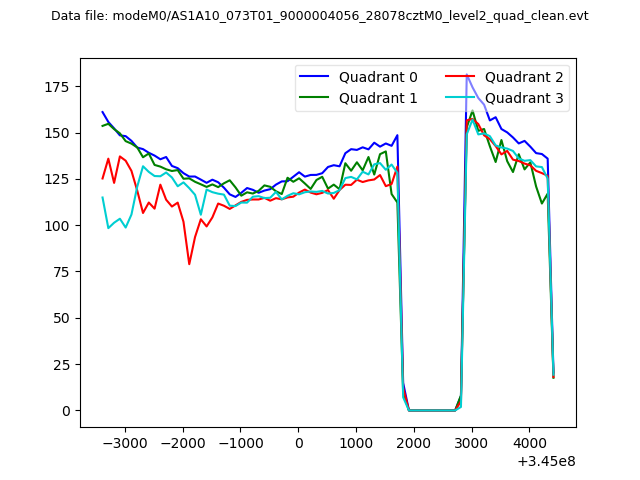 |
|
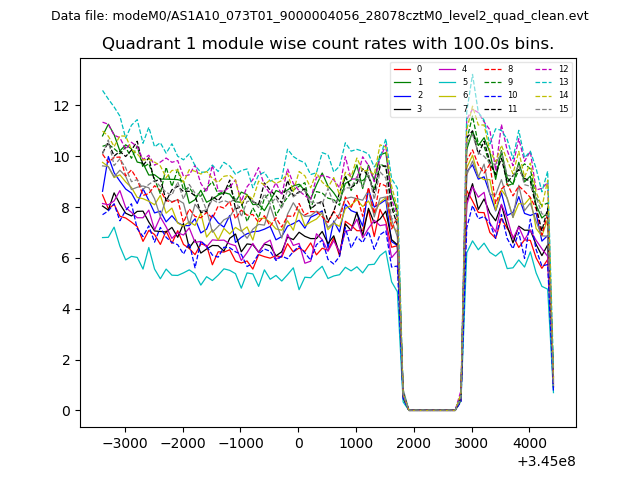
| Module-wise count rates for Quadrant A Data is divided into 100 sec bins |
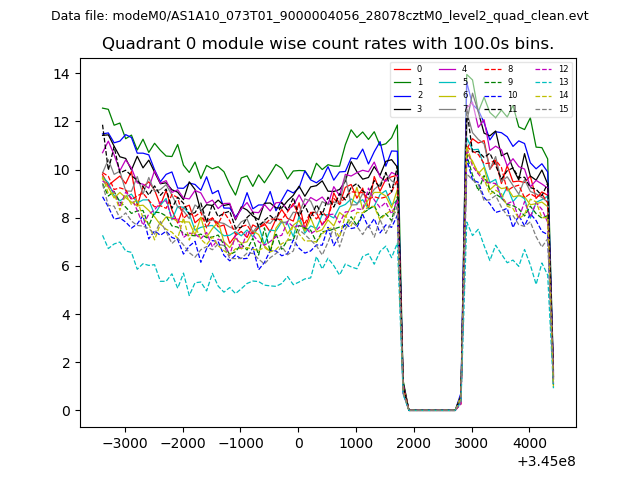 |
 |
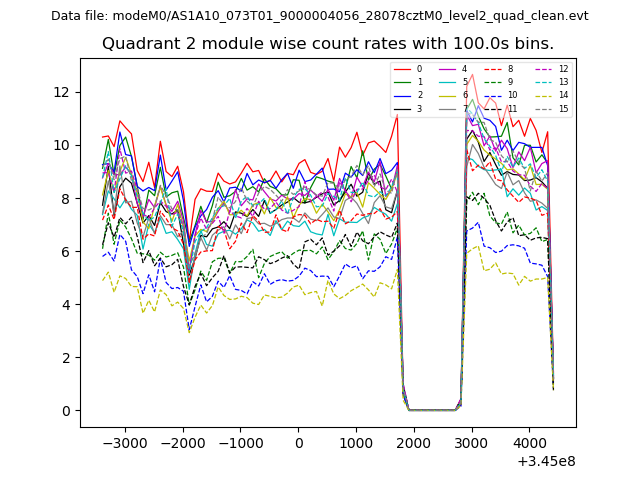
| Module-wise count rates for Quadrant B Data is divided into 100 sec bins |
 |
 |
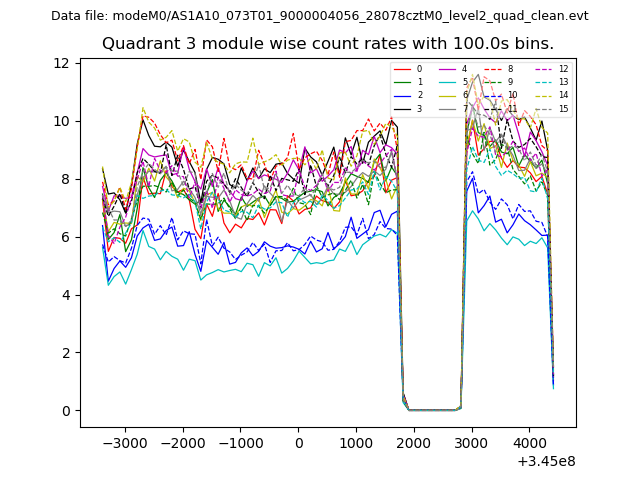
| Module-wise count rates for Quadrant C Data is divided into 100 sec bins |
 |
 |
| Module-wise count rates for Quadrant D Data is divided into 100 sec bins |
 |
 |
| Parameter | Plot |
|---|---|
| CZT HV Monitor | 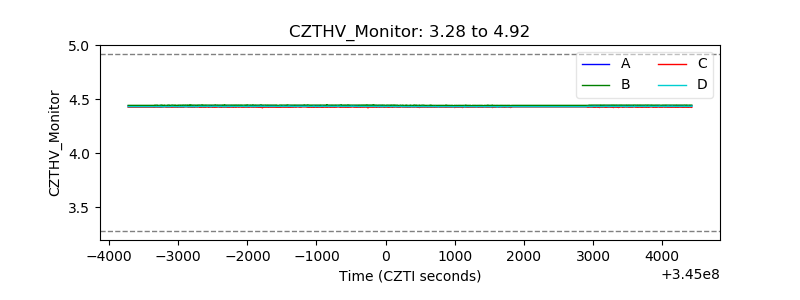 |
| D_VDD | 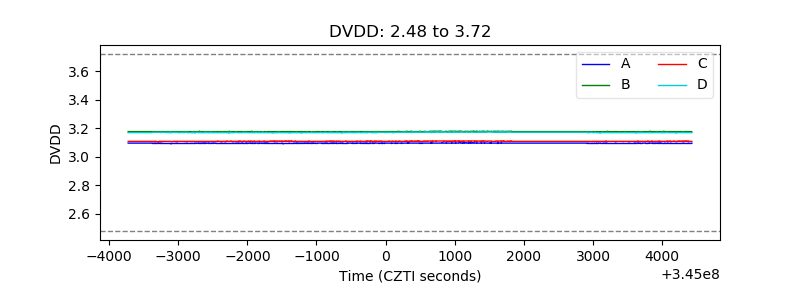 |
| Temperature 1 | 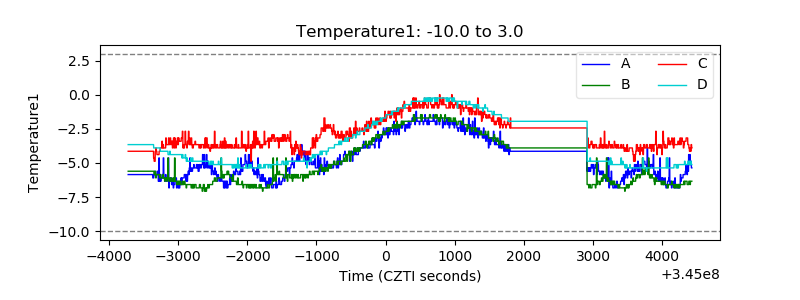 |
| Veto HV Monitor | 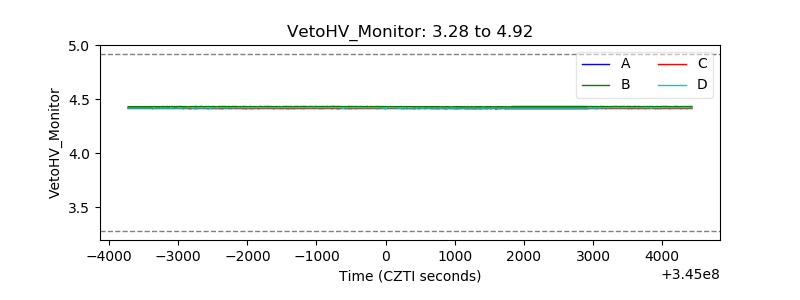 |
| Veto LLD | 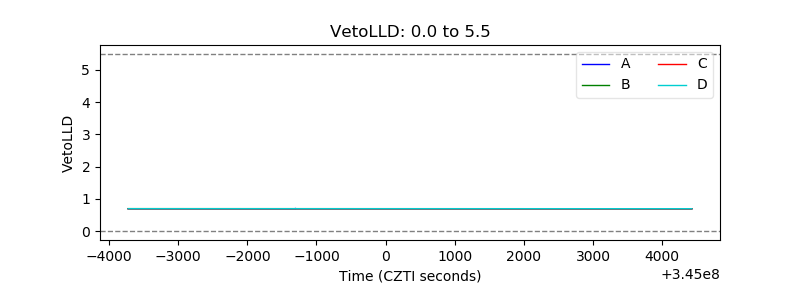 |
| Alpha Counter | 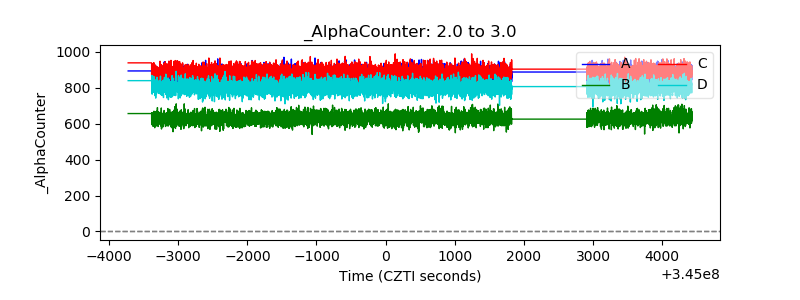 |
| _CPM_Rate |  |
| CZT Counter | 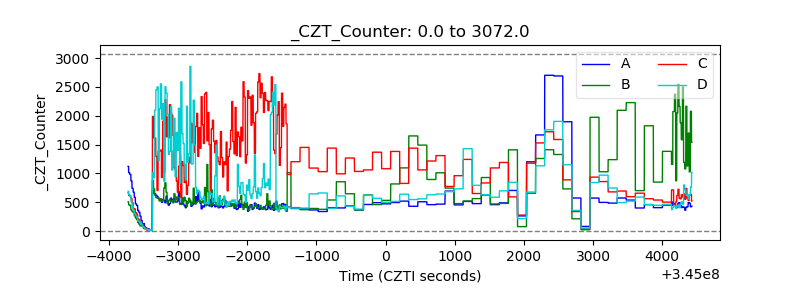 |
| +2.5 Volts monitor | 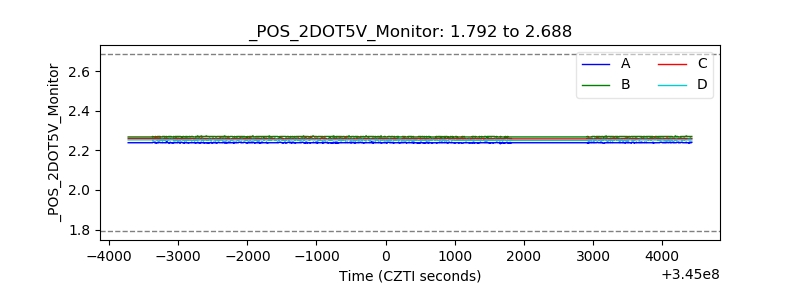 |
| +5 Volts monitor |  |
| _ROLL_ROT | 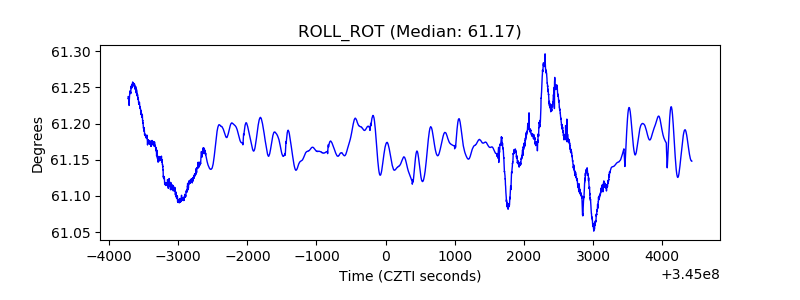 |
| _Roll_DEC | 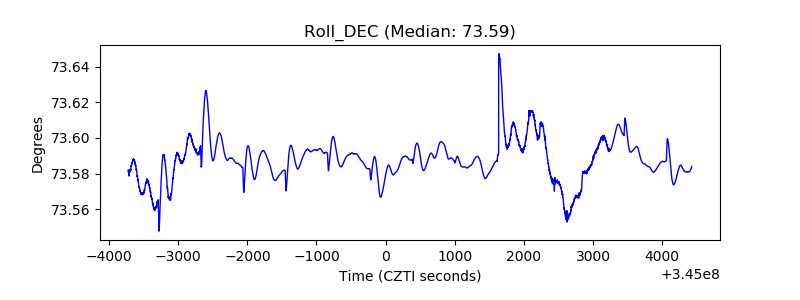 |
| _Roll_RA | 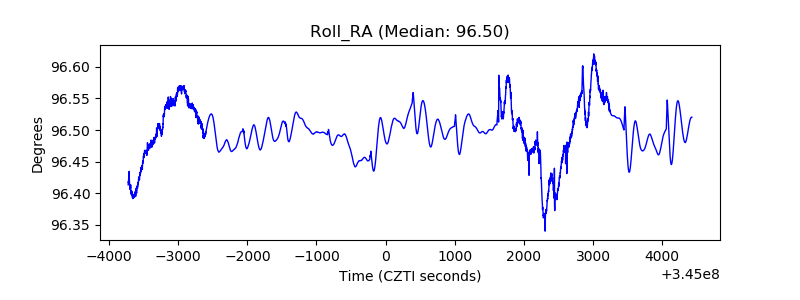 |
| Veto Counter | 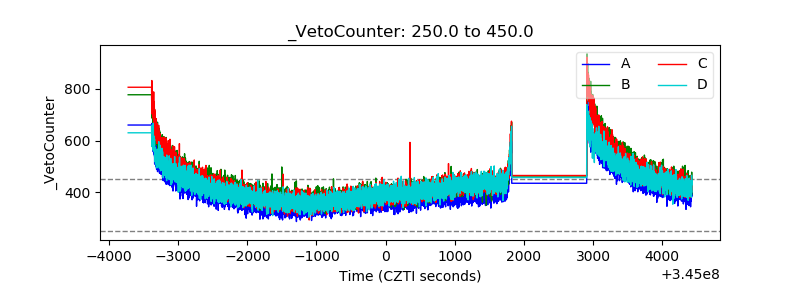 |