| Param | Original file | Final file |
|---|---|---|
| Filename | modeM0/AS1A10_073T01_9000004056_28079cztM0_level2.evt | modeM0/AS1A10_073T01_9000004056_28079cztM0_level2_quad_clean.evt |
| Size (bytes) | 726,045,120 | 122,385,600 |
| Size | 692.4 MB | 116.7 MB |
| Events in quadrant A | 3,001,036 | 892,593 |
| Events in quadrant B | 8,007,948 | 784,359 |
| Events in quadrant C | 5,623,019 | 808,114 |
| Events in quadrant D | 4,938,263 | 788,133 |
| Mode M9 | |||
|---|---|---|---|
| Quadrant | BADHDUFLAG | Total packets | Discarded packets |
| A | 0 | 12 | 0 |
| B | 0 | 12 | 0 |
| C | 0 | 12 | 0 |
| D | 0 | 12 | 0 |
| Mode M0 | |||
|---|---|---|---|
| Quadrant | BADHDUFLAG | Total packets | Discarded packets |
| A | 0 | 12783 | 0 |
| B | 0 | 28038 | 0 |
| C | 0 | 21107 | 0 |
| D | 0 | 18980 | 0 |
| Quadrant | Total seconds | Saturated seconds | Saturation percentage |
|---|---|---|---|
| A | 6197 | 13 | 0.209779% |
| B | 6198 | 1659 | 26.766699% |
| C | 6198 | 368 | 5.937399% |
| D | 6198 | 481 | 7.760568% |
Noise dominated data is calculated using 1-second bins in cleaned event files. If a bin has >2000 counts, and if more than 50% of those come from <1% of pixels, then it is considered to be noise-dominated and hence unusable.
| Quadrant | # 1 sec bins | Bins with >0 counts | Bins with >2000 counts | High rate bins dominated by noise | Noise dominated (total time) | Noise dominated (detector-on time) | Marked lightcurve |
|---|---|---|---|---|---|---|---|
| A | 7412 | 6198 | 0 | 0 | 0.00% | 0.00% | 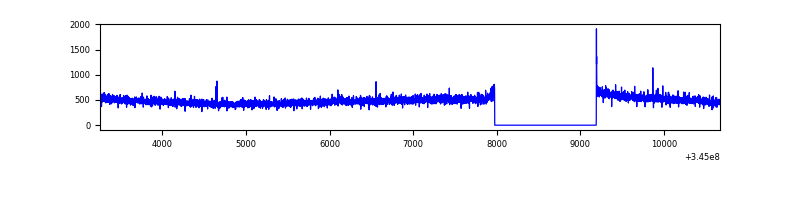 |
| B | 7413 | 6199 | 1224 | 1224 | 16.51% | 19.75% | 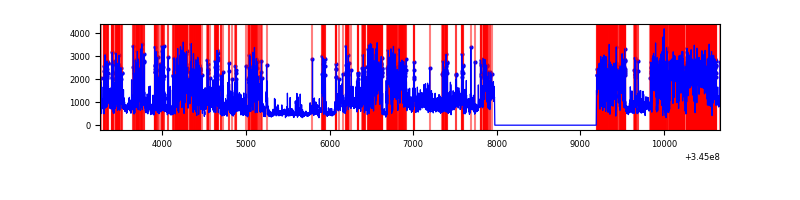 |
| C | 7413 | 6199 | 106 | 106 | 1.43% | 1.71% | 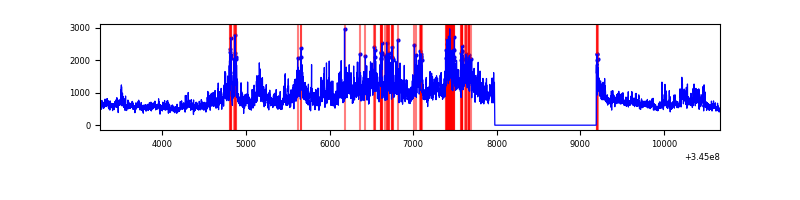 |
| D | 7413 | 6199 | 378 | 378 | 5.10% | 6.10% | 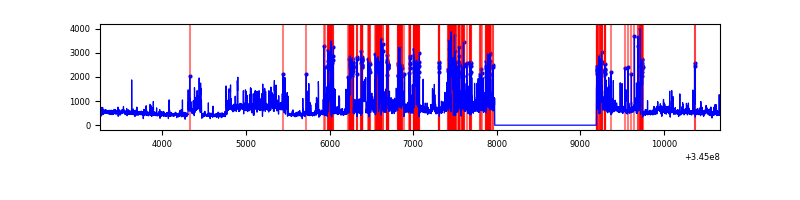 |
Top three noisy pixels from each quadrant. If the there are fewer than three noisy pixels in the level2.evt file, extra rows are filled as -1
| Pixel properties | Quadrant properties | ||||||
|---|---|---|---|---|---|---|---|
| Quadrant | DetID | PixID | Counts | Sigma | Mean | Median | Sigma |
| A | 0 | 13 | 35096 | 223.94 | 767 | 754 | 153.4 |
| A | 13 | 254 | 10685 | 64.76 | 767 | 754 | 153.4 |
| A | 3 | 137 | 6951 | 40.41 | 767 | 754 | 153.4 |
| B | 10 | 245 | 5266037 | 40977.32 | 690 | 674 | 128.5 |
| B | 12 | 111 | 15260 | 113.51 | 690 | 674 | 128.5 |
| B | 0 | 190 | 14893 | 110.66 | 690 | 674 | 128.5 |
| C | 3 | 233 | 2748502 | 16853.31 | 707 | 713 | 163.0 |
| C | 14 | 238 | 116530 | 710.35 | 707 | 713 | 163.0 |
| C | 13 | 61 | 4875 | 25.53 | 707 | 713 | 163.0 |
| D | 1 | 52 | 1552465 | 9411.15 | 694 | 674 | 164.9 |
| D | 8 | 195 | 622129 | 3768.94 | 694 | 674 | 164.9 |
| D | 2 | 250 | 74376 | 446.98 | 694 | 674 | 164.9 |
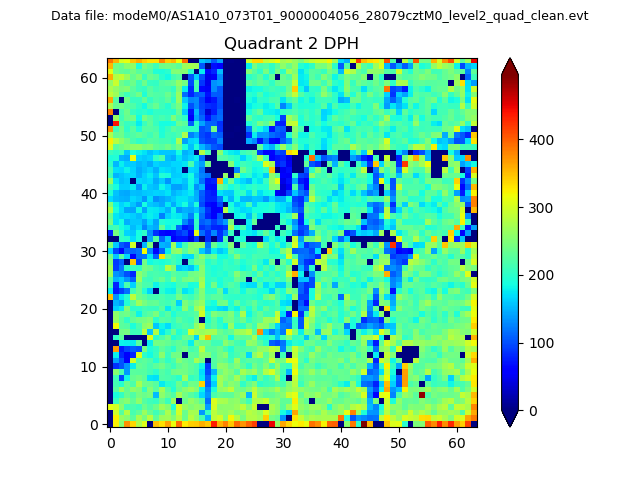
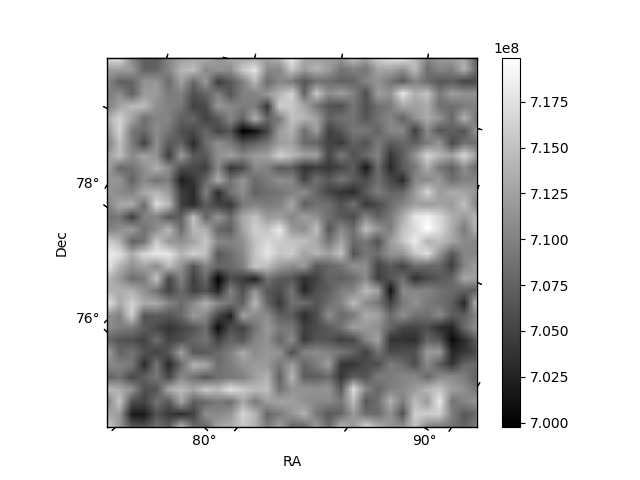
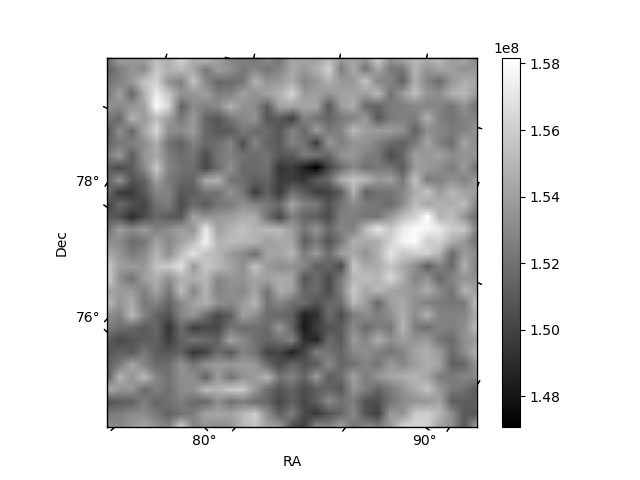
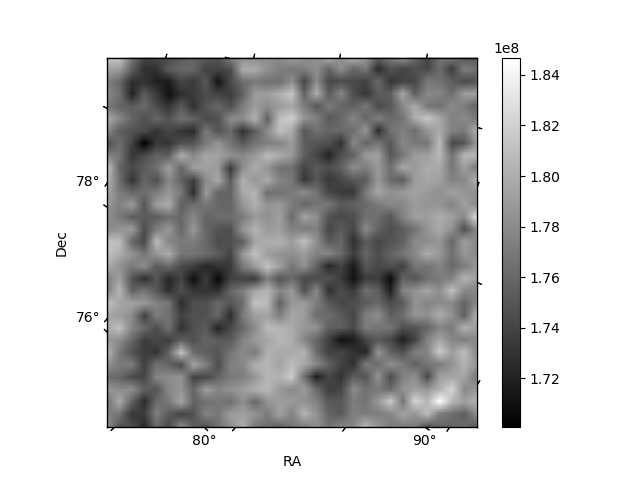
Histogram calculated using DETX and DETY for each event in the final _common_clean file
| Quadrant A | 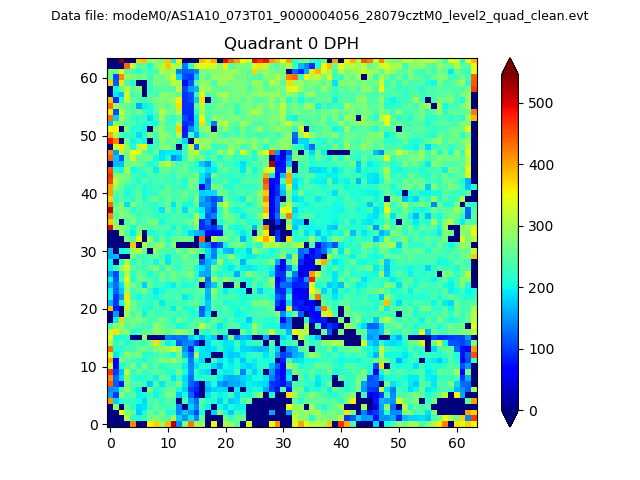 |
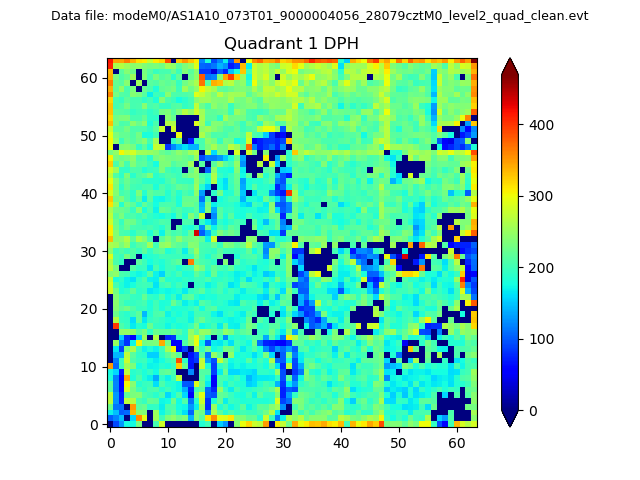 |
Quadrant B |
|---|---|---|---|
| Quadrant D | 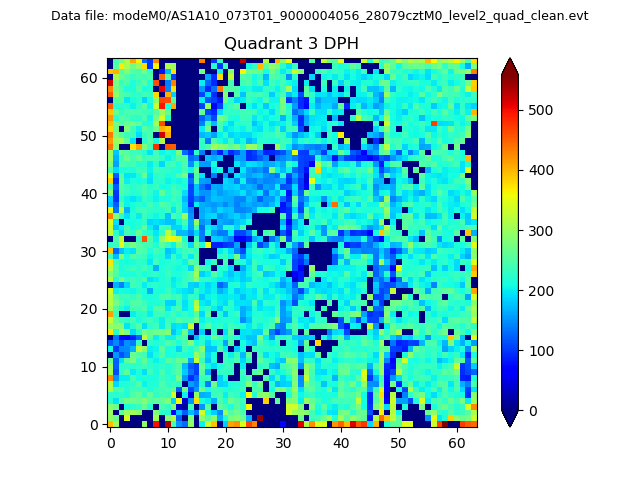 |
 |
Quadrant C |
| Plot type | Count rate plots | Images |
|---|---|---|
| Comparison with Poisson distribution Blue bars denote a histogram of data divided into 1 sec bins. Red curve is a Poisson curve with rate = median count rate of data. |
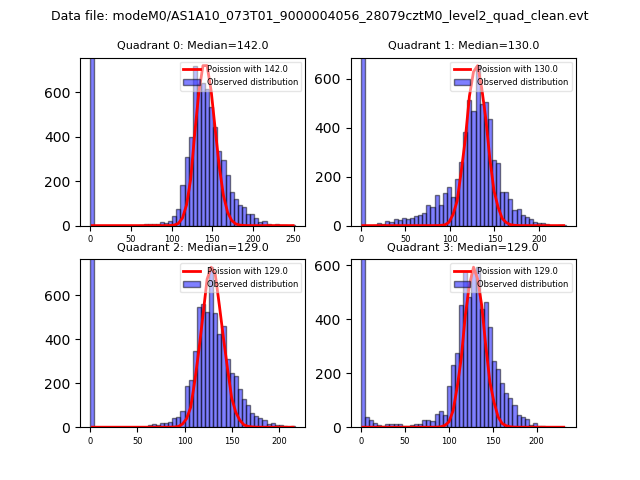 |
 |
| Quadrant-wise count rates Data is divided into 100 sec bins |
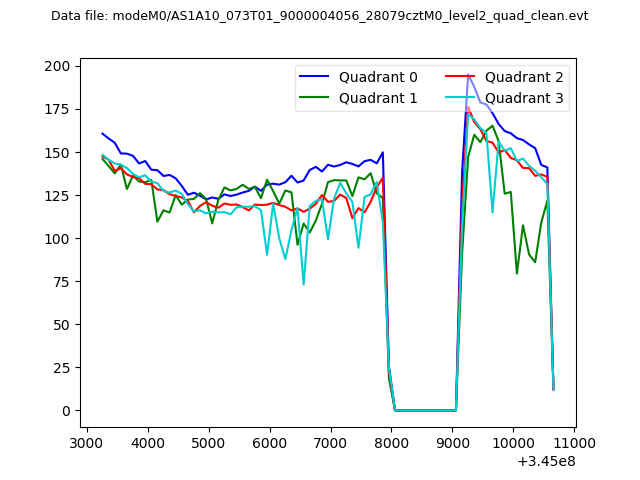 |
|
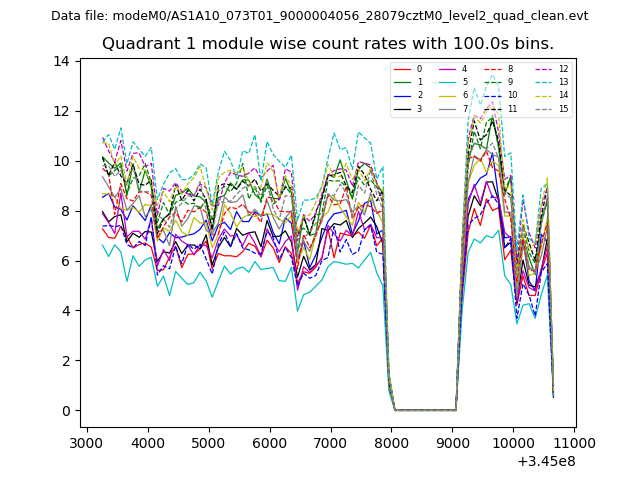
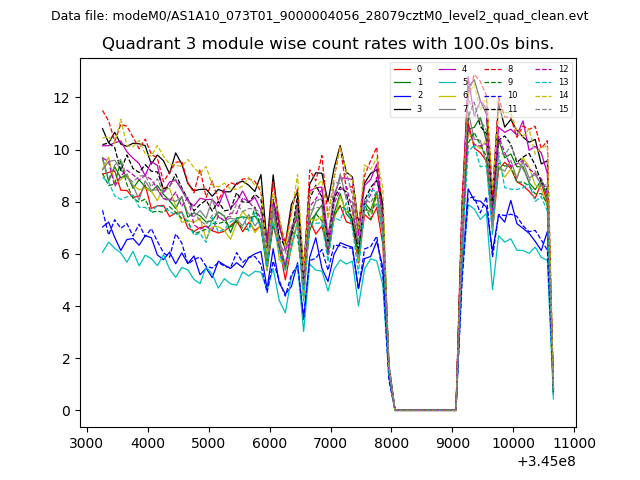
| Module-wise count rates for Quadrant A Data is divided into 100 sec bins |
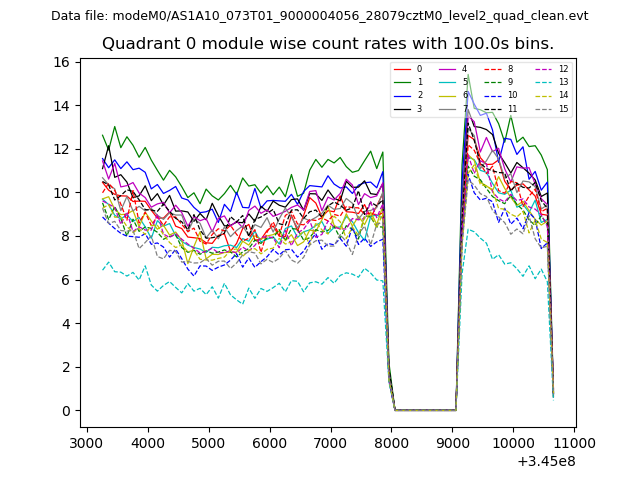 |
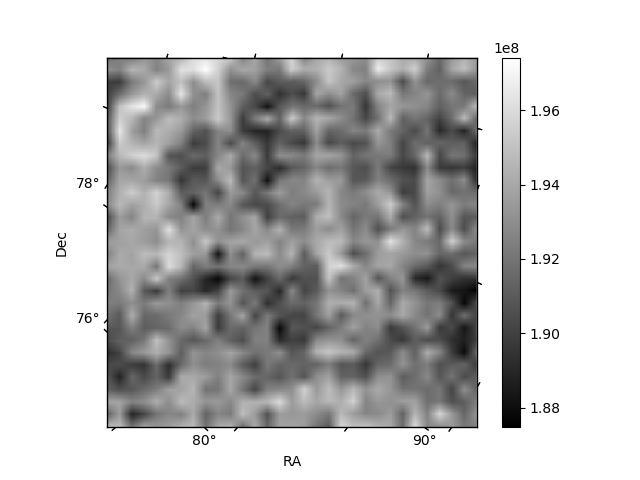 |
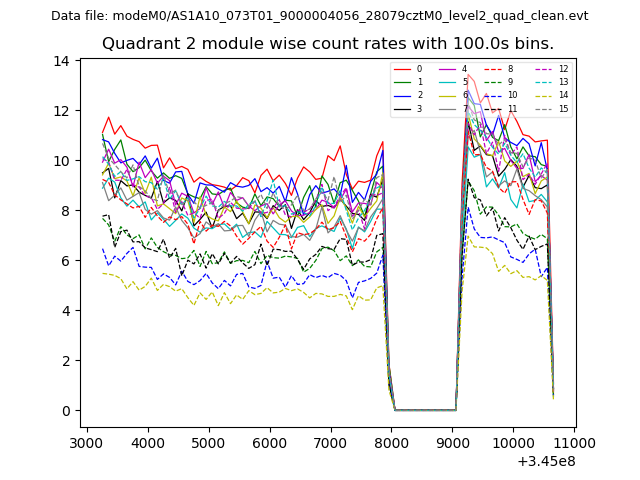
| Module-wise count rates for Quadrant B Data is divided into 100 sec bins |
 |
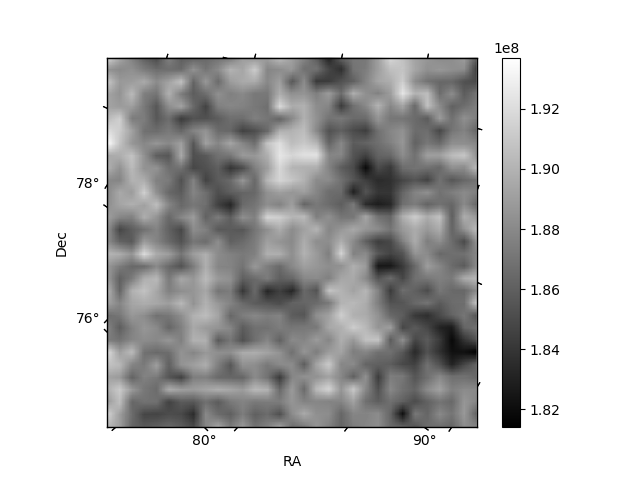 |
| Module-wise count rates for Quadrant C Data is divided into 100 sec bins |
 |
 |
| Module-wise count rates for Quadrant D Data is divided into 100 sec bins |
 |
 |
| Parameter | Plot |
|---|---|
| CZT HV Monitor | 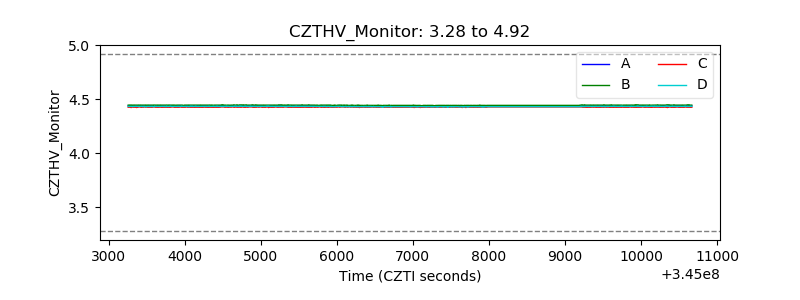 |
| D_VDD | 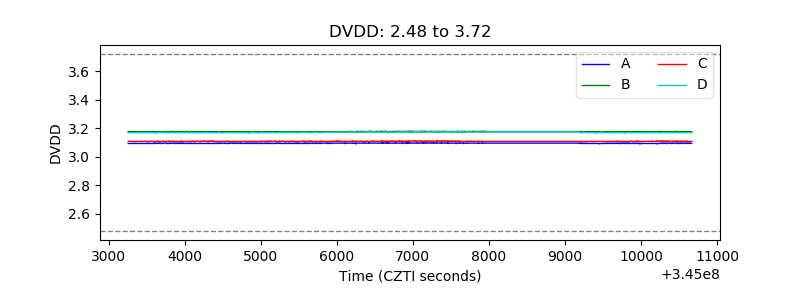 |
| Temperature 1 | 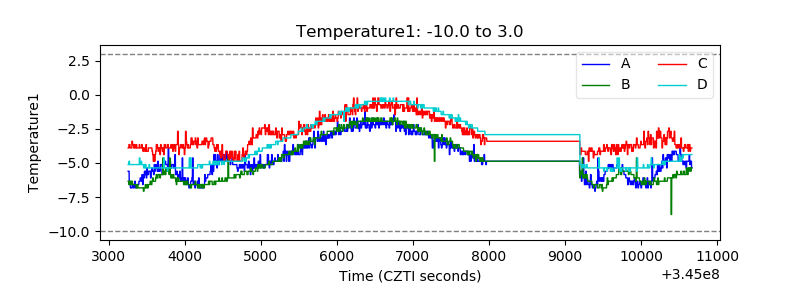 |
| Veto HV Monitor | 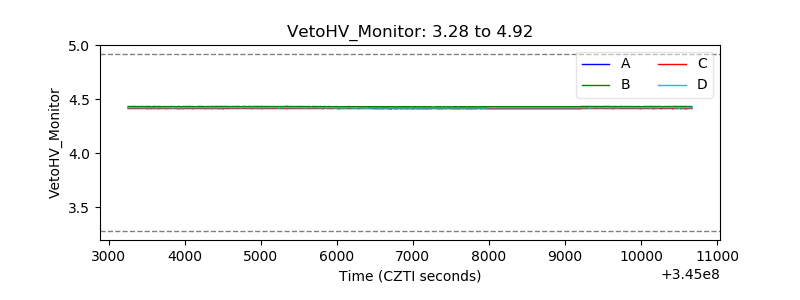 |
| Veto LLD |  |
| Alpha Counter | 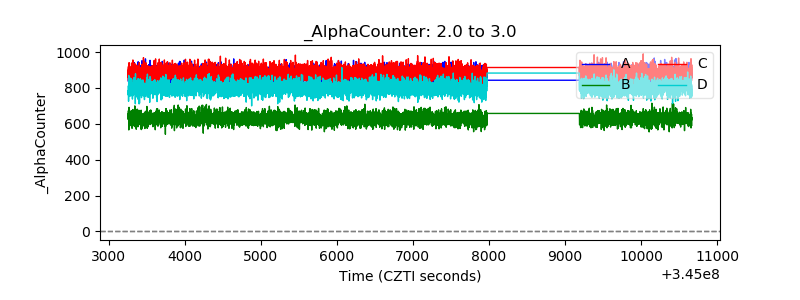 |
| _CPM_Rate | 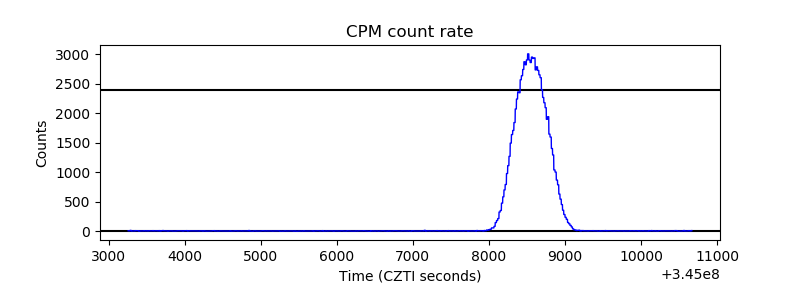 |
| CZT Counter | 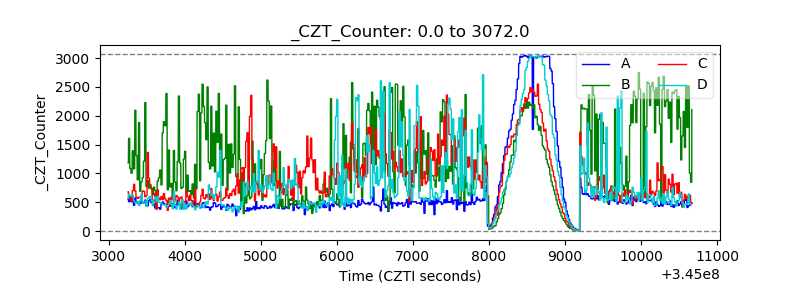 |
| +2.5 Volts monitor | 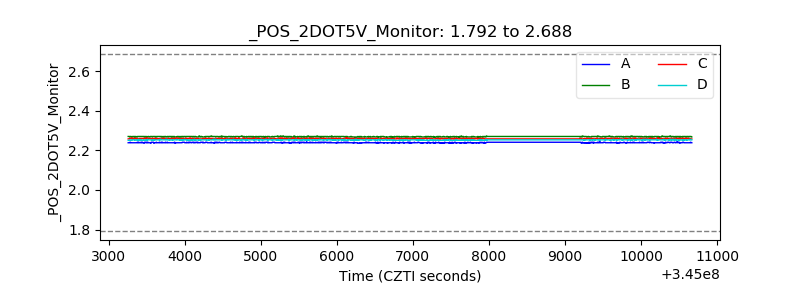 |
| +5 Volts monitor |  |
| _ROLL_ROT | 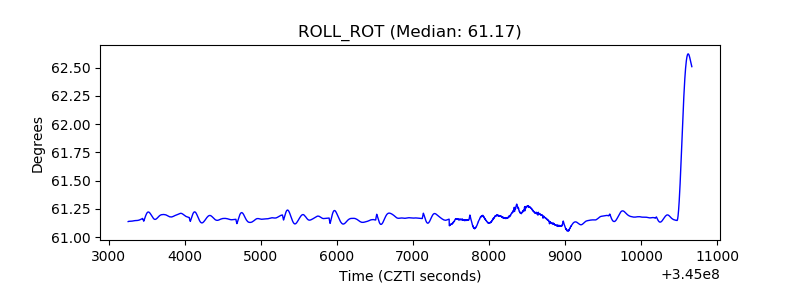 |
| _Roll_DEC | 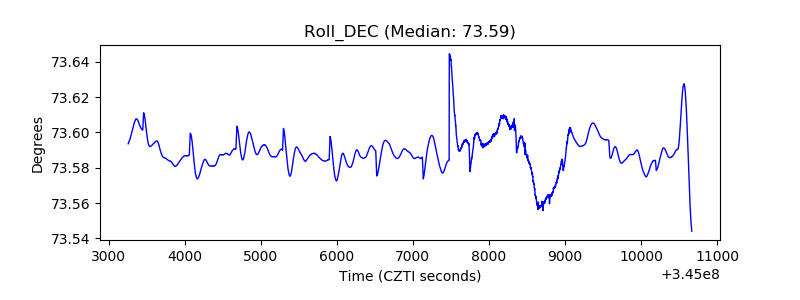 |
| _Roll_RA | 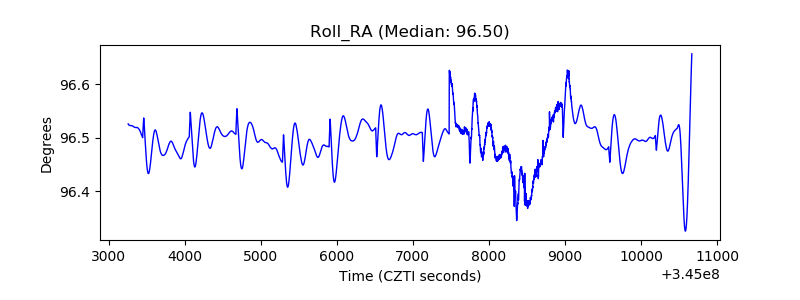 |
| Veto Counter | 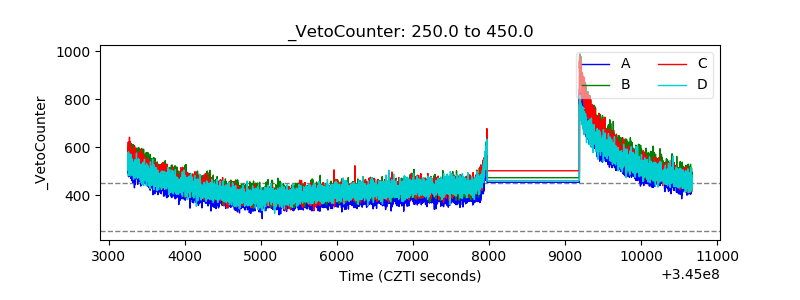 |