| Param | Original file | Final file |
|---|---|---|
| Filename | modeM0/AS1A10_073T01_9000004056_28080cztM0_level2.evt | modeM0/AS1A10_073T01_9000004056_28080cztM0_level2_quad_clean.evt |
| Size (bytes) | 633,087,360 | 111,107,520 |
| Size | 603.8 MB | 106.0 MB |
| Events in quadrant A | 2,717,625 | 821,663 |
| Events in quadrant B | 7,930,276 | 682,930 |
| Events in quadrant C | 3,526,525 | 750,769 |
| Events in quadrant D | 4,631,590 | 728,896 |
| Mode M9 | |||
|---|---|---|---|
| Quadrant | BADHDUFLAG | Total packets | Discarded packets |
| A | 0 | 13 | 0 |
| B | 0 | 13 | 0 |
| C | 0 | 13 | 0 |
| D | 0 | 13 | 0 |
| Mode M0 | |||
|---|---|---|---|
| Quadrant | BADHDUFLAG | Total packets | Discarded packets |
| A | 0 | 11346 | 0 |
| B | 0 | 27289 | 0 |
| C | 0 | 14151 | 0 |
| D | 0 | 17445 | 0 |
| Quadrant | Total seconds | Saturated seconds | Saturation percentage |
|---|---|---|---|
| A | 5429 | 26 | 0.478910% |
| B | 5429 | 2037 | 37.520722% |
| C | 5429 | 122 | 2.247191% |
| D | 5429 | 395 | 7.275741% |
Noise dominated data is calculated using 1-second bins in cleaned event files. If a bin has >2000 counts, and if more than 50% of those come from <1% of pixels, then it is considered to be noise-dominated and hence unusable.
| Quadrant | # 1 sec bins | Bins with >0 counts | Bins with >2000 counts | High rate bins dominated by noise | Noise dominated (total time) | Noise dominated (detector-on time) | Marked lightcurve |
|---|---|---|---|---|---|---|---|
| A | 6719 | 5430 | 0 | 0 | 0.00% | 0.00% |  |
| B | 6719 | 5429 | 1549 | 1549 | 23.05% | 28.53% |  |
| C | 6719 | 5430 | 9 | 9 | 0.13% | 0.17% |  |
| D | 6719 | 5430 | 296 | 296 | 4.41% | 5.45% |  |
Top three noisy pixels from each quadrant. If the there are fewer than three noisy pixels in the level2.evt file, extra rows are filled as -1
| Pixel properties | Quadrant properties | ||||||
|---|---|---|---|---|---|---|---|
| Quadrant | DetID | PixID | Counts | Sigma | Mean | Median | Sigma |
| A | 0 | 13 | 21752 | 153.37 | 697 | 687 | 137.3 |
| A | 13 | 254 | 9297 | 62.69 | 697 | 687 | 137.3 |
| A | 1 | 113 | 8092 | 53.92 | 697 | 687 | 137.3 |
| B | 10 | 245 | 5549167 | 51068.95 | 595 | 581 | 108.6 |
| B | 0 | 190 | 17962 | 159.97 | 595 | 581 | 108.6 |
| B | 12 | 111 | 12511 | 109.8 | 595 | 581 | 108.6 |
| C | 3 | 233 | 911420 | 6168.03 | 642 | 647 | 147.7 |
| C | 14 | 238 | 107726 | 725.17 | 642 | 647 | 147.7 |
| C | 13 | 61 | 4500 | 26.09 | 642 | 647 | 147.7 |
| D | 1 | 52 | 1100918 | 7246.43 | 645 | 628 | 151.8 |
| D | 8 | 195 | 438084 | 2881.05 | 645 | 628 | 151.8 |
| D | 7 | 80 | 342566 | 2251.98 | 645 | 628 | 151.8 |
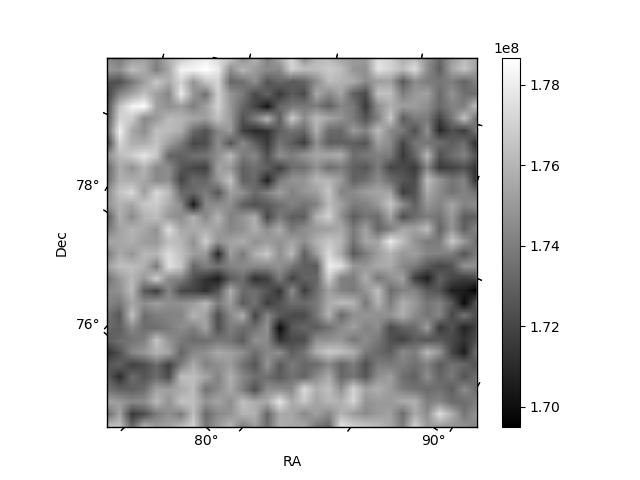
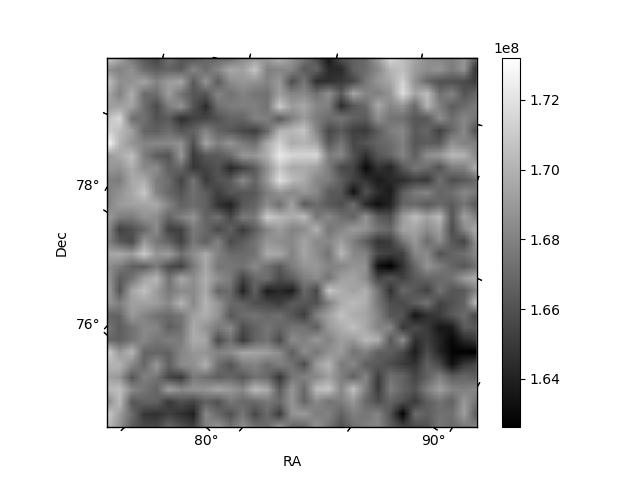
Histogram calculated using DETX and DETY for each event in the final _common_clean file
| Quadrant A | 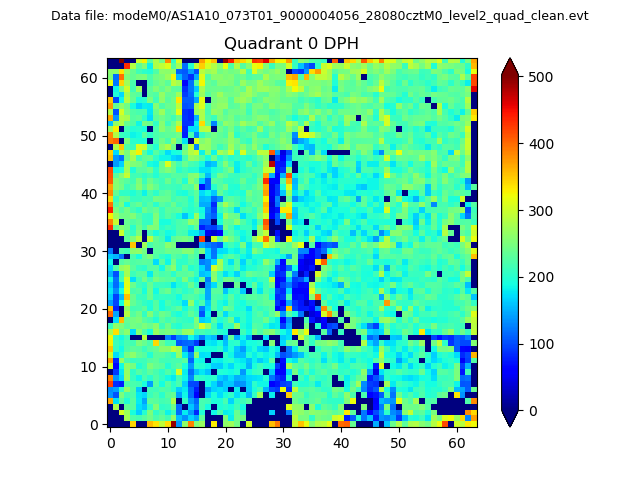 |
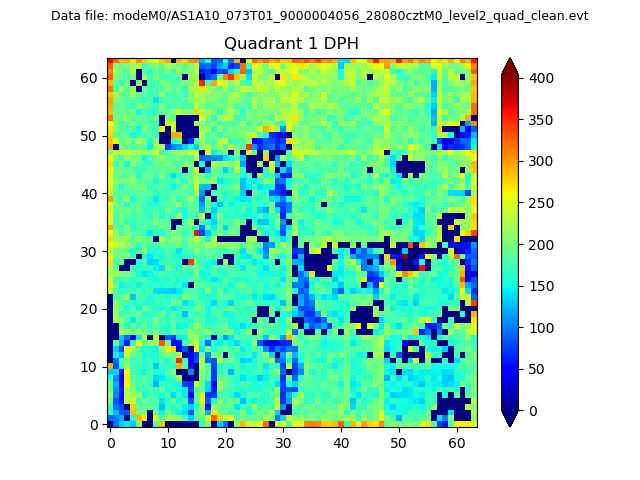 |
Quadrant B |
|---|---|---|---|
| Quadrant D | 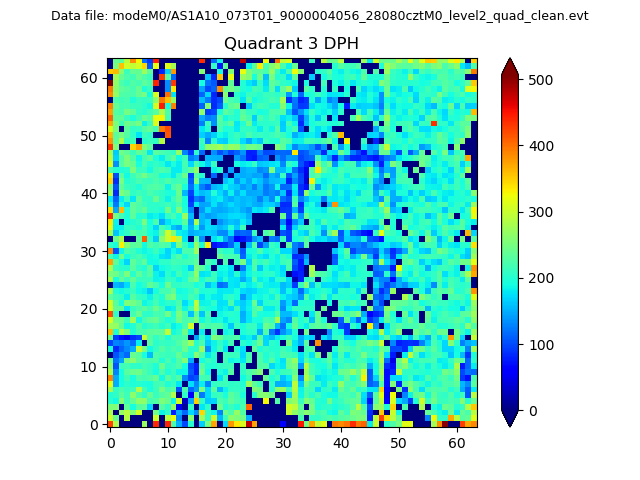 |
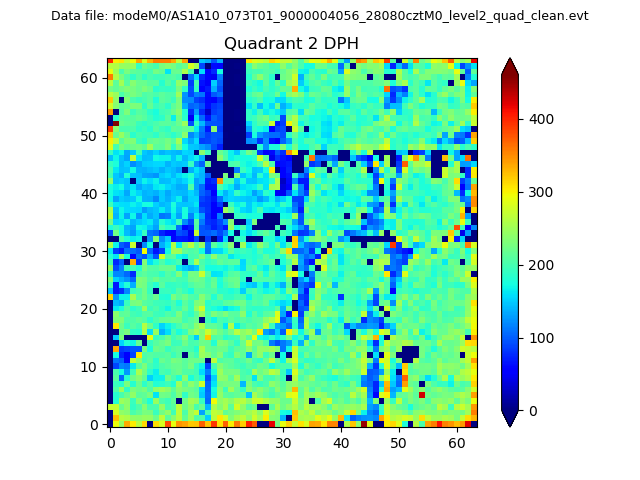 |
Quadrant C |
| Plot type | Count rate plots | Images |
|---|---|---|
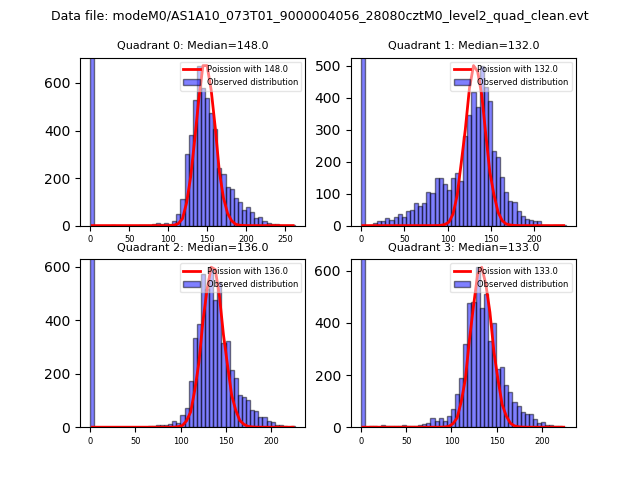
| Comparison with Poisson distribution Blue bars denote a histogram of data divided into 1 sec bins. Red curve is a Poisson curve with rate = median count rate of data. |
 |
 |
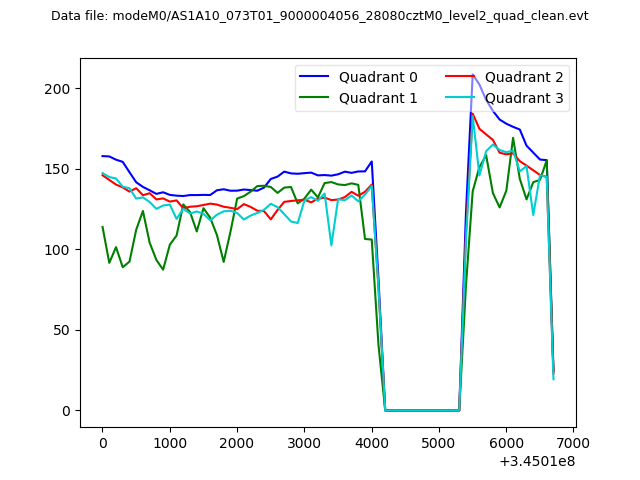
| Quadrant-wise count rates Data is divided into 100 sec bins |
 |
|
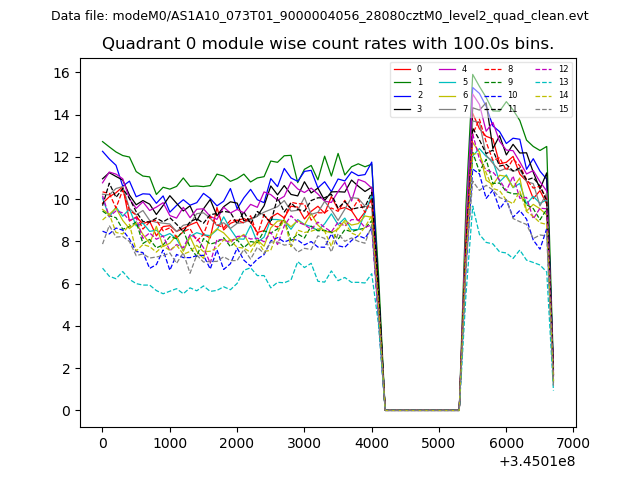
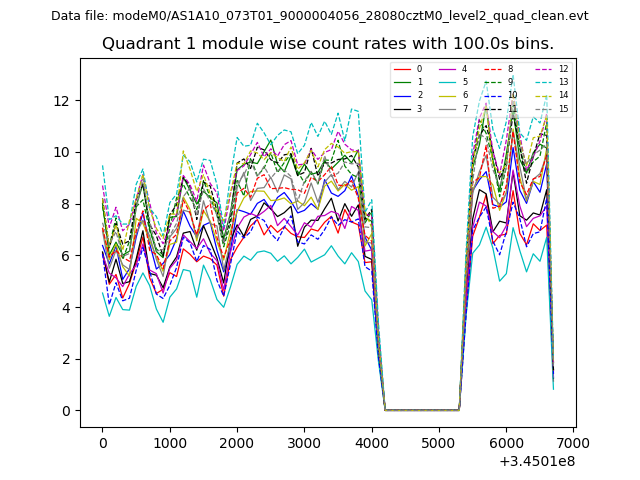
| Module-wise count rates for Quadrant A Data is divided into 100 sec bins |
 |
 |
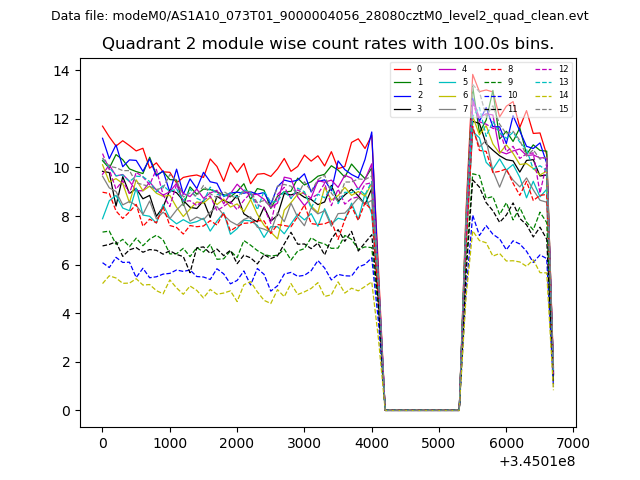
| Module-wise count rates for Quadrant B Data is divided into 100 sec bins |
 |
 |
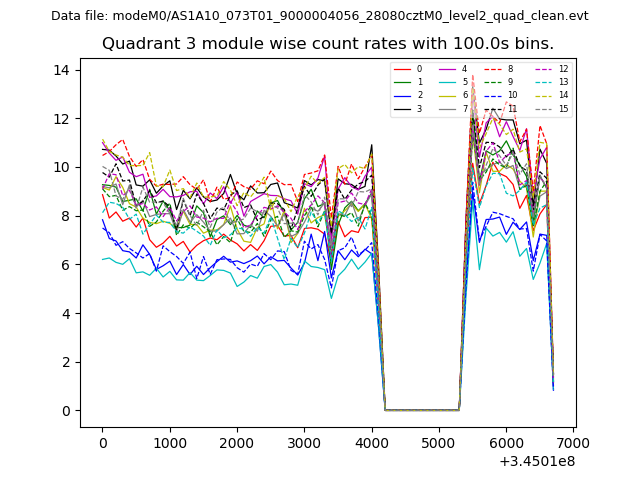
| Module-wise count rates for Quadrant C Data is divided into 100 sec bins |
 |
 |
| Module-wise count rates for Quadrant D Data is divided into 100 sec bins |
 |
 |
| Parameter | Plot |
|---|---|
| CZT HV Monitor | 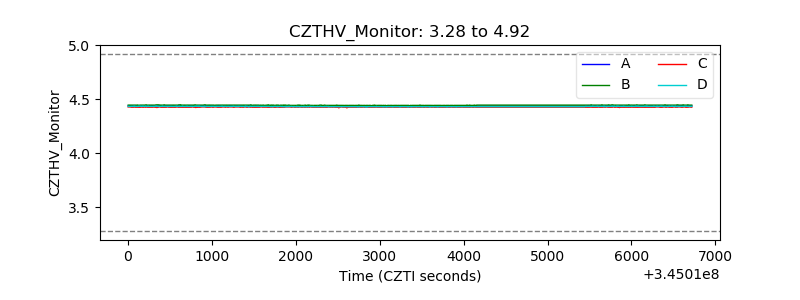 |
| D_VDD | 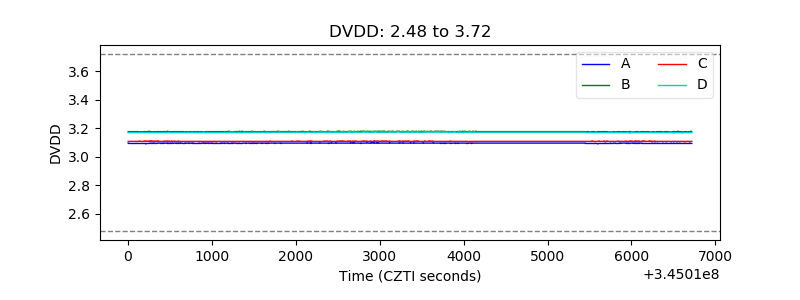 |
| Temperature 1 | 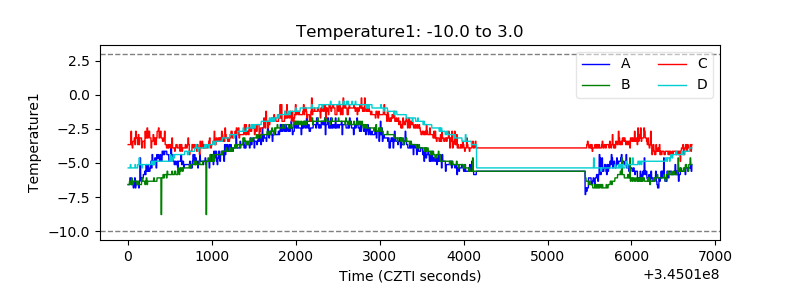 |
| Veto HV Monitor | 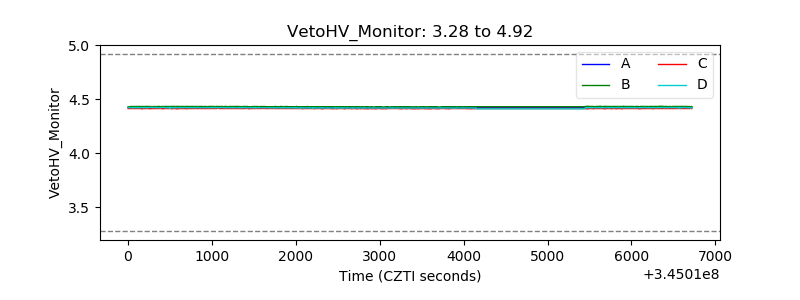 |
| Veto LLD | 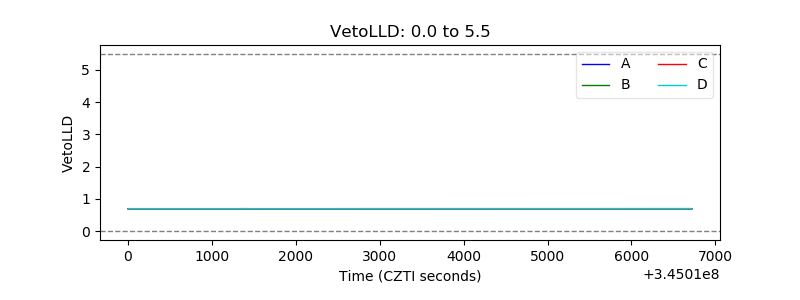 |
| Alpha Counter | 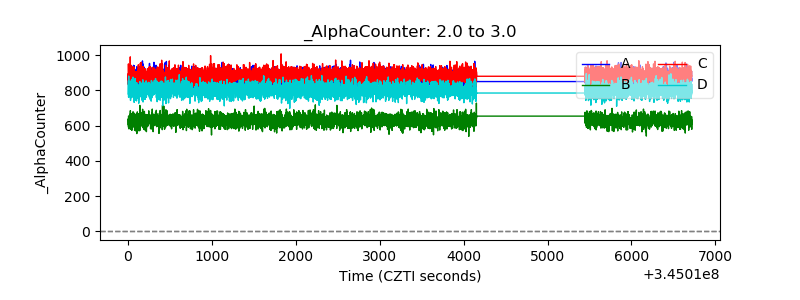 |
| _CPM_Rate | 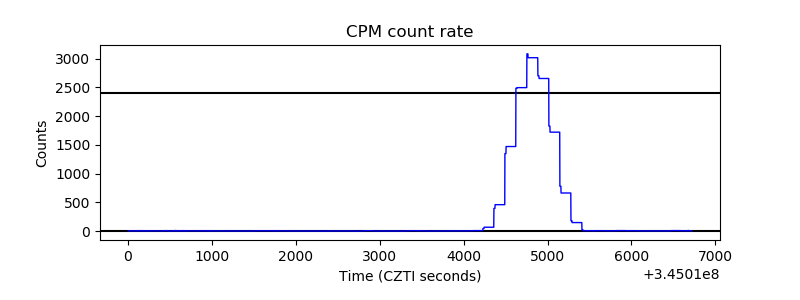 |
| CZT Counter | 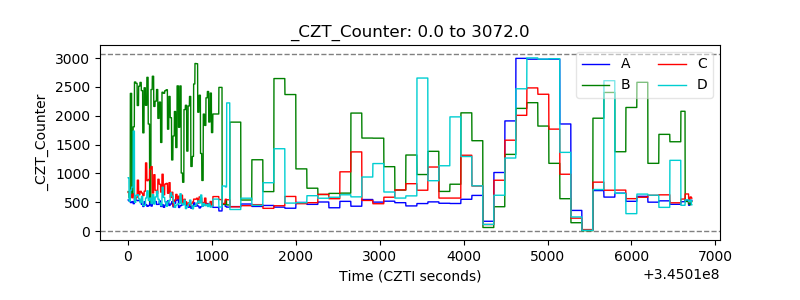 |
| +2.5 Volts monitor |  |
| +5 Volts monitor |  |
| _ROLL_ROT | 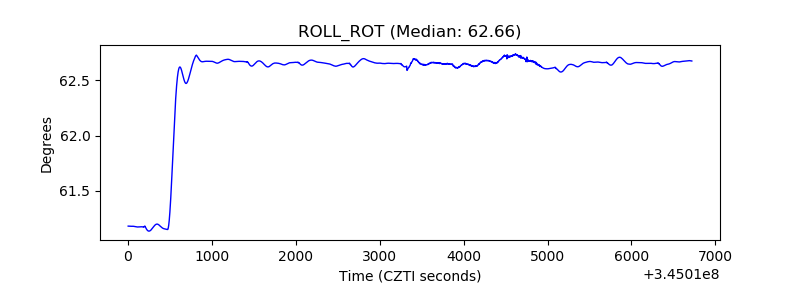 |
| _Roll_DEC |  |
| _Roll_RA | 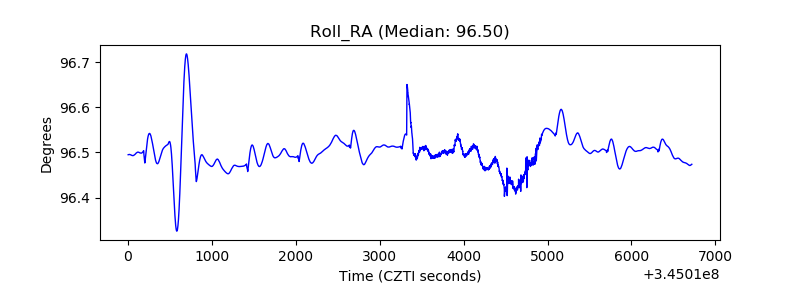 |
| Veto Counter | 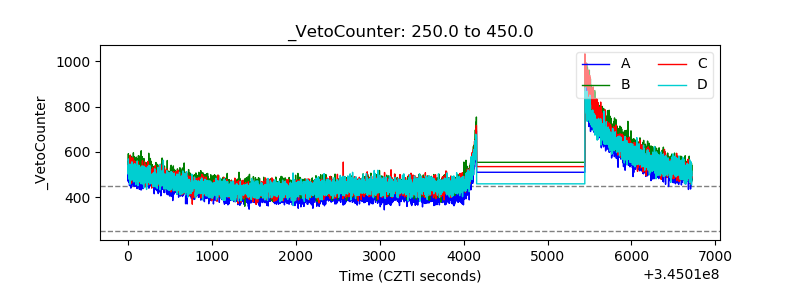 |