| Param | Original file | Final file |
|---|---|---|
| Filename | modeM0/AS1A10_073T01_9000004056_28082cztM0_level2.evt | modeM0/AS1A10_073T01_9000004056_28082cztM0_level2_quad_clean.evt |
| Size (bytes) | 471,096,000 | 130,541,760 |
| Size | 449.3 MB | 124.5 MB |
| Events in quadrant A | 3,030,055 | 928,171 |
| Events in quadrant B | 3,021,151 | 917,984 |
| Events in quadrant C | 3,612,845 | 846,116 |
| Events in quadrant D | 4,199,240 | 845,907 |
| Mode M9 | |||
|---|---|---|---|
| Quadrant | BADHDUFLAG | Total packets | Discarded packets |
| A | 0 | 13 | 0 |
| B | 0 | 13 | 0 |
| C | 0 | 13 | 0 |
| D | 0 | 13 | 0 |
| Mode M0 | |||
|---|---|---|---|
| Quadrant | BADHDUFLAG | Total packets | Discarded packets |
| A | 0 | 12365 | 0 |
| B | 0 | 12342 | 0 |
| C | 0 | 14532 | 0 |
| D | 0 | 16410 | 0 |
| Quadrant | Total seconds | Saturated seconds | Saturation percentage |
|---|---|---|---|
| A | 5948 | 48 | 0.806994% |
| B | 5949 | 61 | 1.025382% |
| C | 5949 | 86 | 1.445621% |
| D | 5949 | 144 | 2.420575% |
Noise dominated data is calculated using 1-second bins in cleaned event files. If a bin has >2000 counts, and if more than 50% of those come from <1% of pixels, then it is considered to be noise-dominated and hence unusable.
| Quadrant | # 1 sec bins | Bins with >0 counts | Bins with >2000 counts | High rate bins dominated by noise | Noise dominated (total time) | Noise dominated (detector-on time) | Marked lightcurve |
|---|---|---|---|---|---|---|---|
| A | 7288 | 5949 | 0 | 0 | 0.00% | 0.00% | 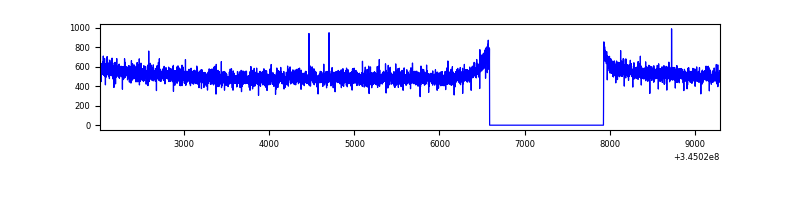 |
| B | 7289 | 5950 | 0 | 0 | 0.00% | 0.00% | 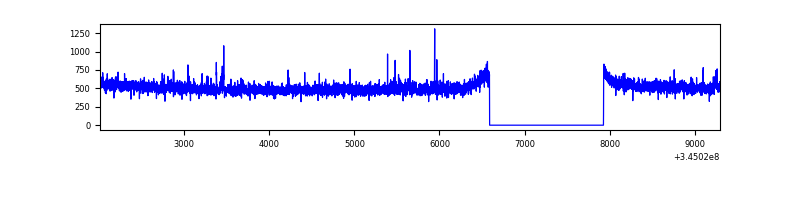 |
| C | 7289 | 5950 | 2 | 2 | 0.03% | 0.03% | 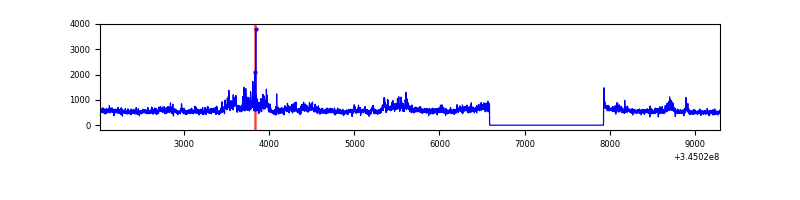 |
| D | 7289 | 5950 | 98 | 98 | 1.34% | 1.65% | 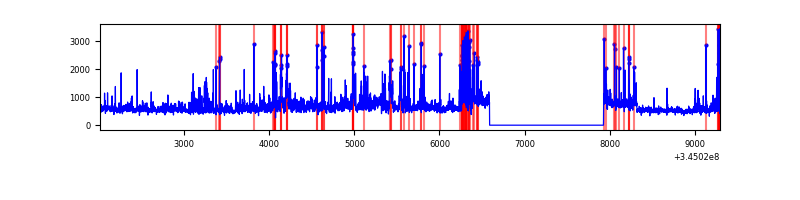 |
Top three noisy pixels from each quadrant. If the there are fewer than three noisy pixels in the level2.evt file, extra rows are filled as -1
| Pixel properties | Quadrant properties | ||||||
|---|---|---|---|---|---|---|---|
| Quadrant | DetID | PixID | Counts | Sigma | Mean | Median | Sigma |
| A | 0 | 13 | 14591 | 90.43 | 782 | 769 | 152.8 |
| A | 13 | 254 | 9622 | 57.92 | 782 | 769 | 152.8 |
| A | 0 | 226 | 6874 | 39.94 | 782 | 769 | 152.8 |
| B | 12 | 111 | 16367 | 110.92 | 762 | 745 | 140.8 |
| B | 11 | 111 | 14735 | 99.33 | 762 | 745 | 140.8 |
| B | 0 | 190 | 13667 | 91.75 | 762 | 745 | 140.8 |
| C | 3 | 233 | 673835 | 4110.22 | 720 | 725 | 163.8 |
| C | 14 | 238 | 119099 | 722.83 | 720 | 725 | 163.8 |
| C | 15 | 208 | 7519 | 41.49 | 720 | 725 | 163.8 |
| D | 8 | 195 | 563995 | 3249.05 | 740 | 723 | 173.4 |
| D | 1 | 52 | 522614 | 3010.35 | 740 | 723 | 173.4 |
| D | 2 | 250 | 241754 | 1390.31 | 740 | 723 | 173.4 |
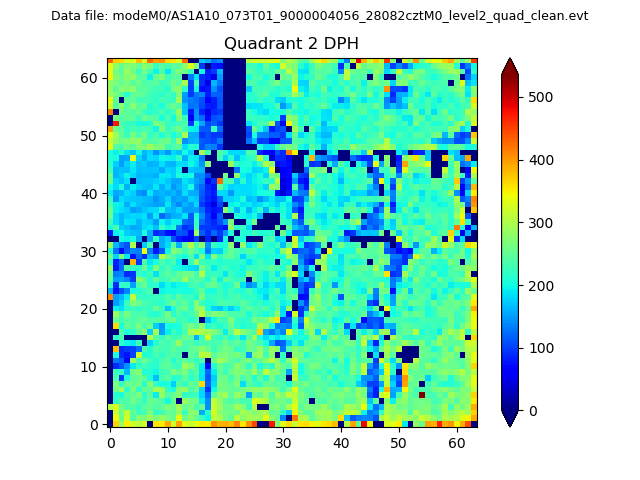
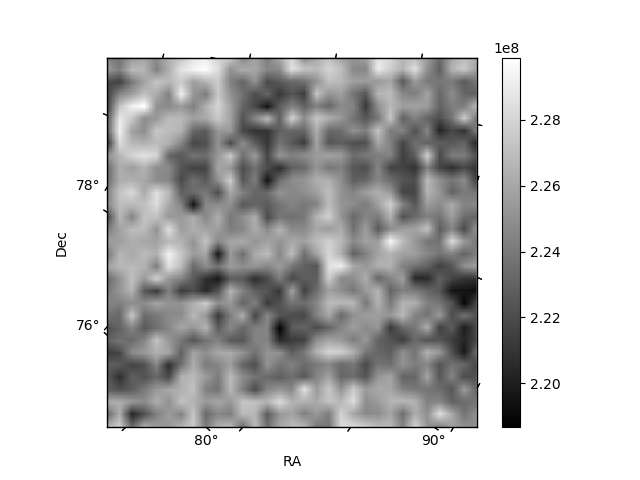
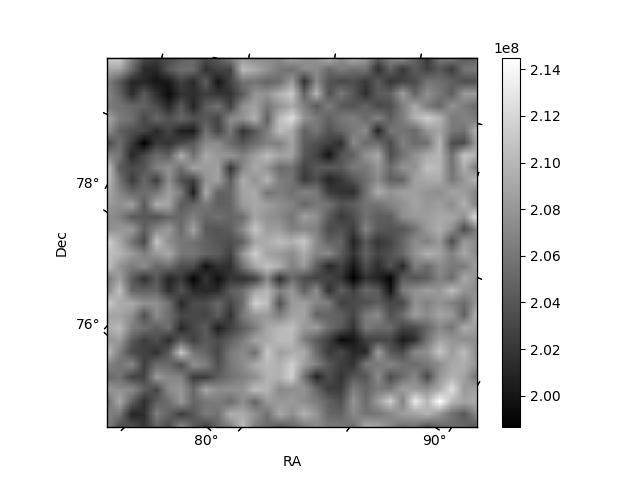
Histogram calculated using DETX and DETY for each event in the final _common_clean file
| Quadrant A | 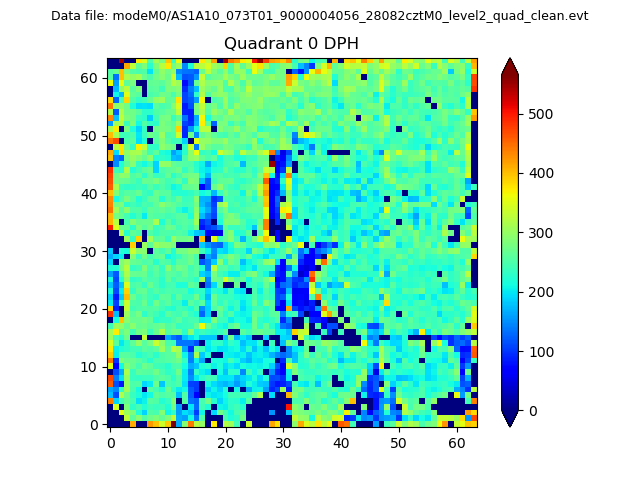 |
 |
Quadrant B |
|---|---|---|---|
| Quadrant D |  |
 |
Quadrant C |
| Plot type | Count rate plots | Images |
|---|---|---|
| Comparison with Poisson distribution Blue bars denote a histogram of data divided into 1 sec bins. Red curve is a Poisson curve with rate = median count rate of data. |
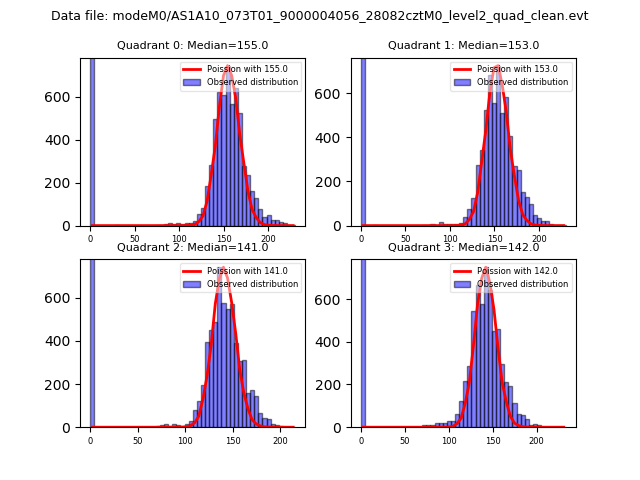 |
 |
| Quadrant-wise count rates Data is divided into 100 sec bins |
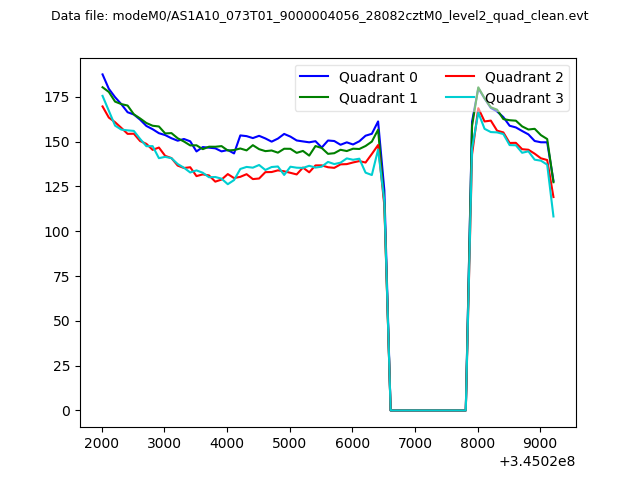 |
|
| Module-wise count rates for Quadrant A Data is divided into 100 sec bins |
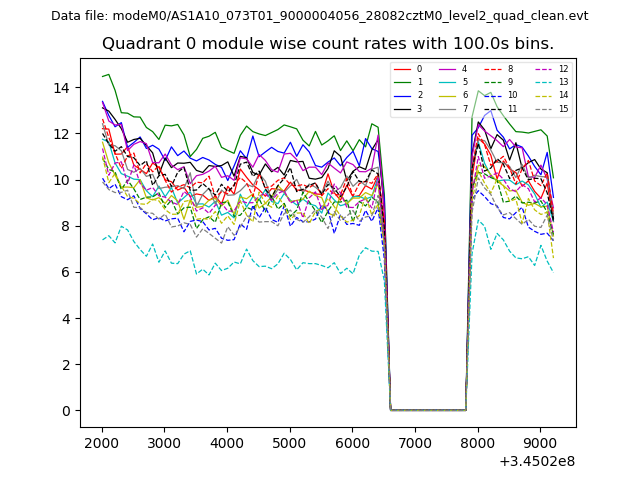 |
 |
| Module-wise count rates for Quadrant B Data is divided into 100 sec bins |
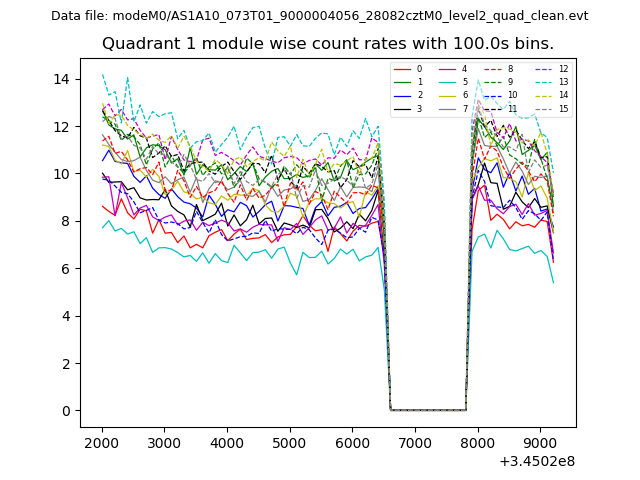 |
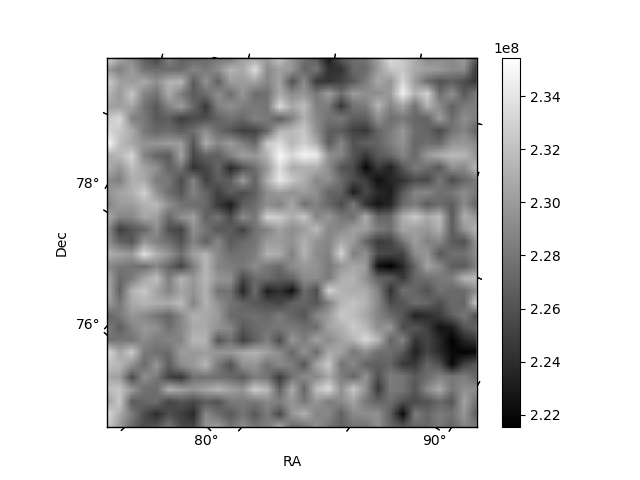 |
| Module-wise count rates for Quadrant C Data is divided into 100 sec bins |
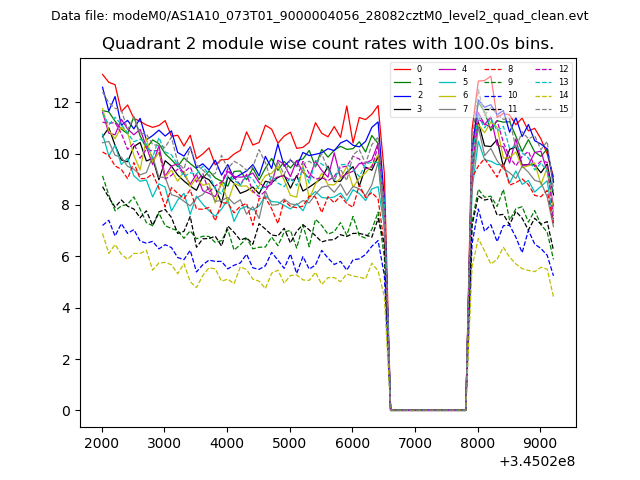 |
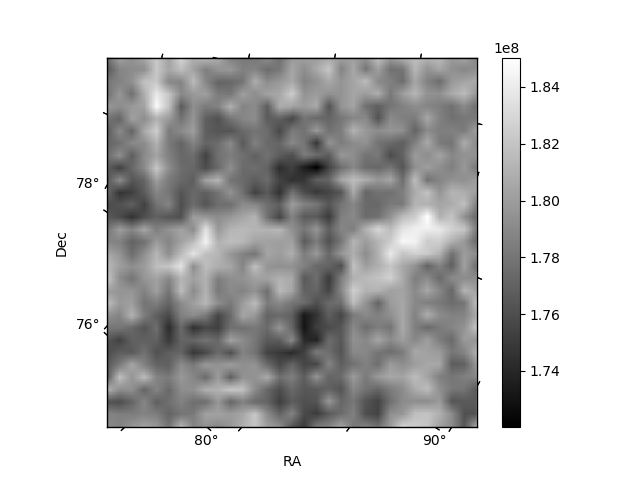 |
| Module-wise count rates for Quadrant D Data is divided into 100 sec bins |
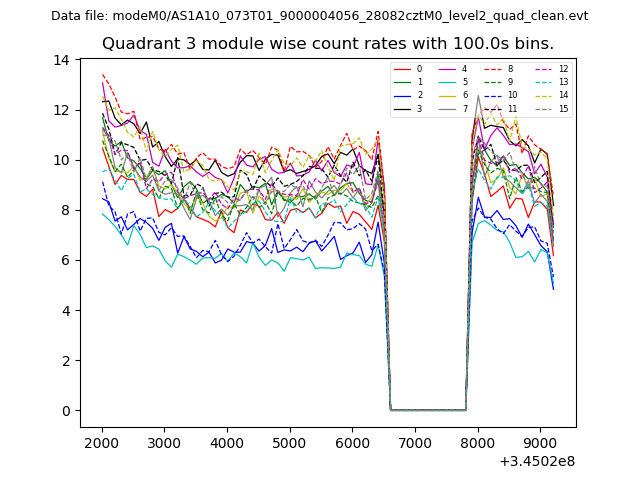 |
 |
| Parameter | Plot |
|---|---|
| CZT HV Monitor | 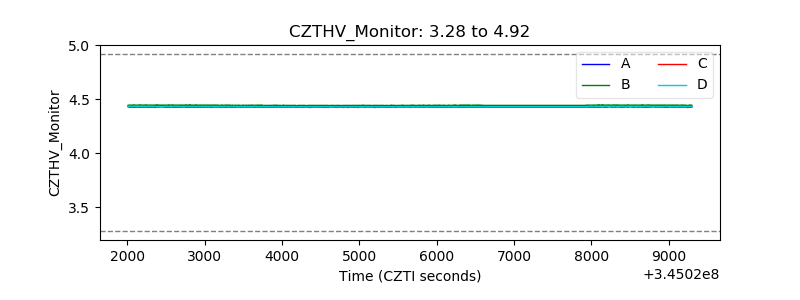 |
| D_VDD | 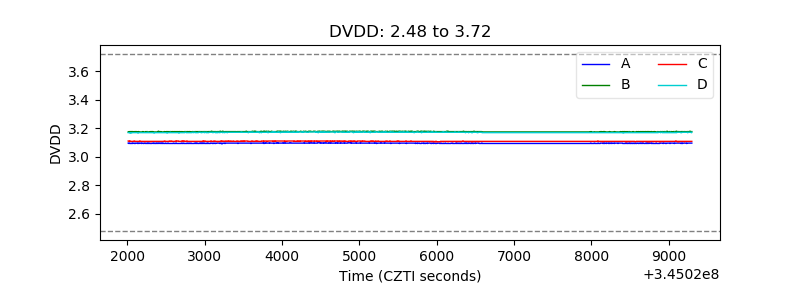 |
| Temperature 1 | 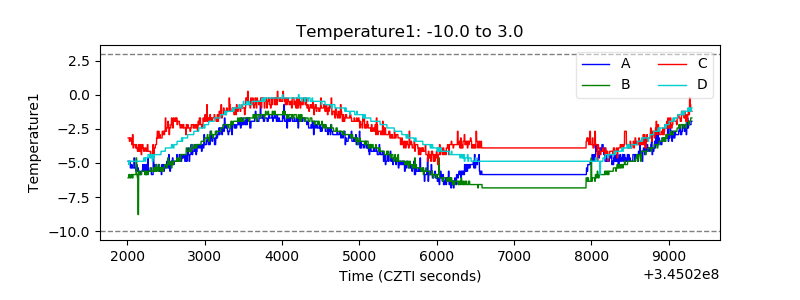 |
| Veto HV Monitor | 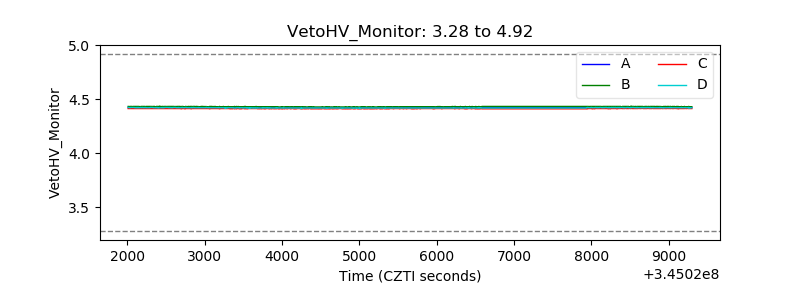 |
| Veto LLD | 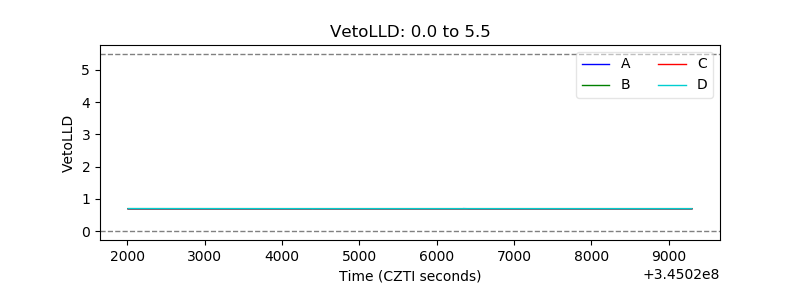 |
| Alpha Counter | 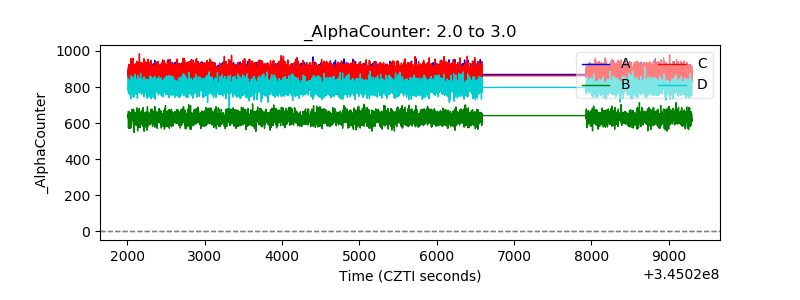 |
| _CPM_Rate |  |
| CZT Counter | 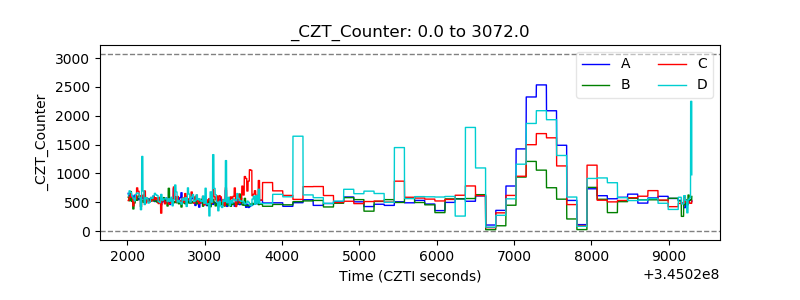 |
| +2.5 Volts monitor | 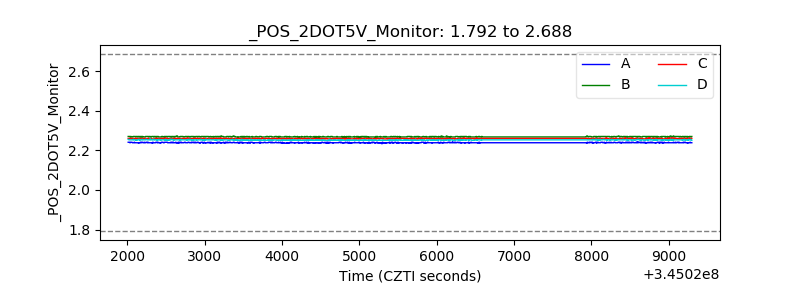 |
| +5 Volts monitor | 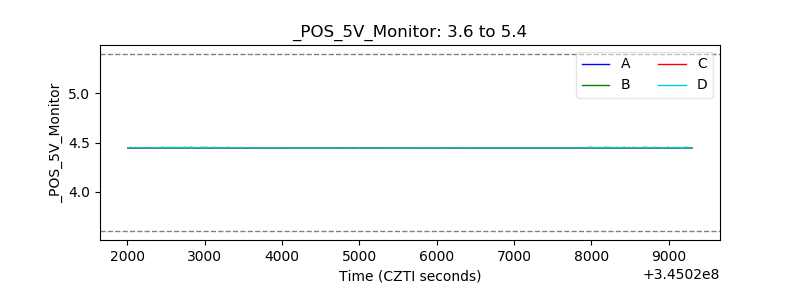 |
| _ROLL_ROT | 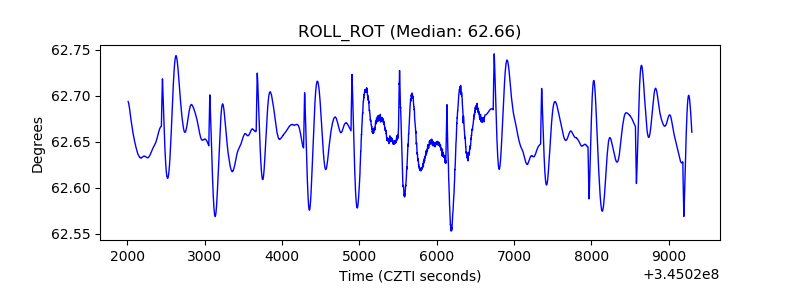 |
| _Roll_DEC | 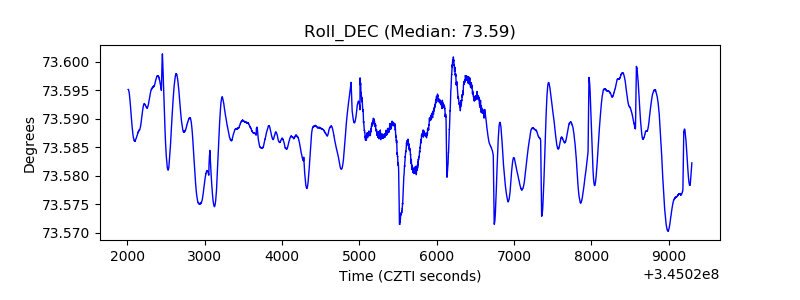 |
| _Roll_RA | 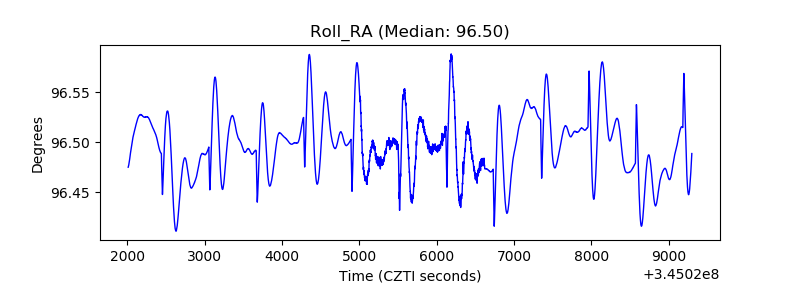 |
| Veto Counter | 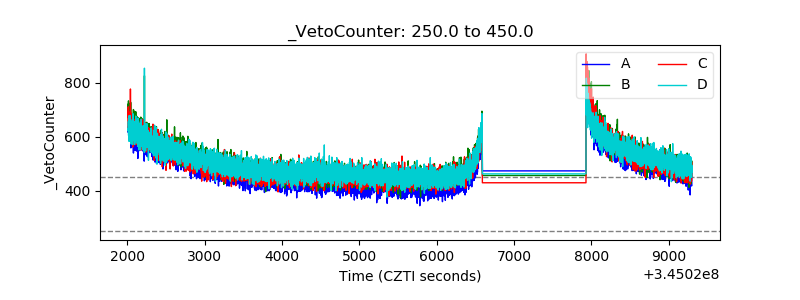 |