| Param | Original file | Final file |
|---|---|---|
| Filename | modeM0/AS1A10_073T01_9000004056_28083cztM0_level2.evt | modeM0/AS1A10_073T01_9000004056_28083cztM0_level2_quad_clean.evt |
| Size (bytes) | 465,768,000 | 125,046,720 |
| Size | 444.2 MB | 119.3 MB |
| Events in quadrant A | 2,992,589 | 882,904 |
| Events in quadrant B | 3,001,442 | 871,909 |
| Events in quadrant C | 3,225,988 | 813,878 |
| Events in quadrant D | 4,478,735 | 799,970 |
| Mode M9 | |||
|---|---|---|---|
| Quadrant | BADHDUFLAG | Total packets | Discarded packets |
| A | 0 | 11 | 0 |
| B | 0 | 11 | 0 |
| C | 0 | 11 | 0 |
| D | 0 | 11 | 0 |
| Mode M0 | |||
|---|---|---|---|
| Quadrant | BADHDUFLAG | Total packets | Discarded packets |
| A | 0 | 12403 | 0 |
| B | 0 | 12458 | 0 |
| C | 0 | 13056 | 0 |
| D | 0 | 17266 | 0 |
| Quadrant | Total seconds | Saturated seconds | Saturation percentage |
|---|---|---|---|
| A | 5990 | 133 | 2.220367% |
| B | 5991 | 134 | 2.236688% |
| C | 5991 | 143 | 2.386914% |
| D | 5991 | 354 | 5.908863% |
Noise dominated data is calculated using 1-second bins in cleaned event files. If a bin has >2000 counts, and if more than 50% of those come from <1% of pixels, then it is considered to be noise-dominated and hence unusable.
| Quadrant | # 1 sec bins | Bins with >0 counts | Bins with >2000 counts | High rate bins dominated by noise | Noise dominated (total time) | Noise dominated (detector-on time) | Marked lightcurve |
|---|---|---|---|---|---|---|---|
| A | 7110 | 5990 | 0 | 0 | 0.00% | 0.00% | 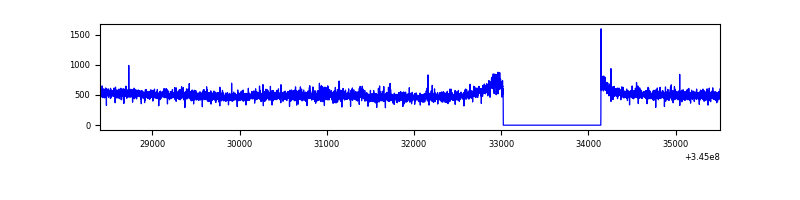 |
| B | 7111 | 5991 | 0 | 0 | 0.00% | 0.00% | 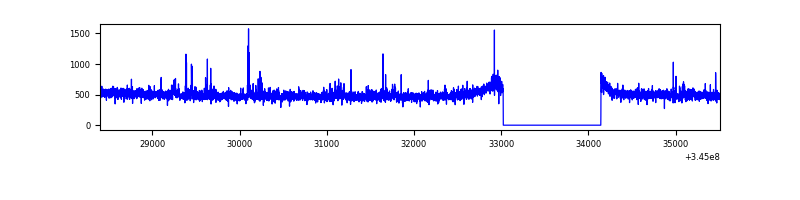 |
| C | 7111 | 5991 | 0 | 0 | 0.00% | 0.00% | 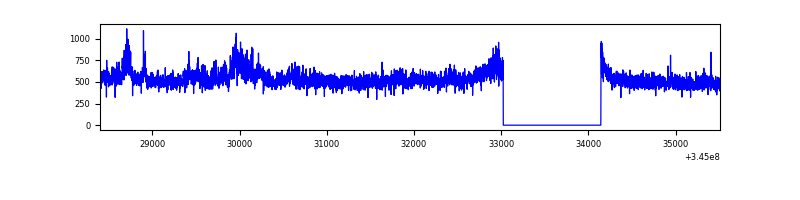 |
| D | 7111 | 5991 | 253 | 253 | 3.56% | 4.22% | 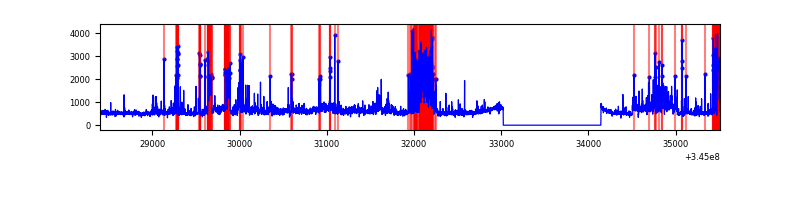 |
Top three noisy pixels from each quadrant. If the there are fewer than three noisy pixels in the level2.evt file, extra rows are filled as -1
| Pixel properties | Quadrant properties | ||||||
|---|---|---|---|---|---|---|---|
| Quadrant | DetID | PixID | Counts | Sigma | Mean | Median | Sigma |
| A | 0 | 13 | 30100 | 193.15 | 765 | 750 | 152.0 |
| A | 13 | 254 | 10295 | 62.81 | 765 | 750 | 152.0 |
| A | 3 | 137 | 6906 | 40.51 | 765 | 750 | 152.0 |
| B | 0 | 190 | 21882 | 152.62 | 746 | 728 | 138.6 |
| B | 4 | 200 | 19286 | 133.89 | 746 | 728 | 138.6 |
| B | 12 | 111 | 16503 | 113.81 | 746 | 728 | 138.6 |
| C | 3 | 233 | 327793 | 2003.31 | 713 | 717 | 163.3 |
| C | 14 | 238 | 116189 | 707.25 | 713 | 717 | 163.3 |
| C | 13 | 61 | 4959 | 25.98 | 713 | 717 | 163.3 |
| D | 8 | 195 | 565673 | 3270.53 | 726 | 705 | 172.7 |
| D | 2 | 250 | 482453 | 2788.78 | 726 | 705 | 172.7 |
| D | 1 | 52 | 300544 | 1735.73 | 726 | 705 | 172.7 |
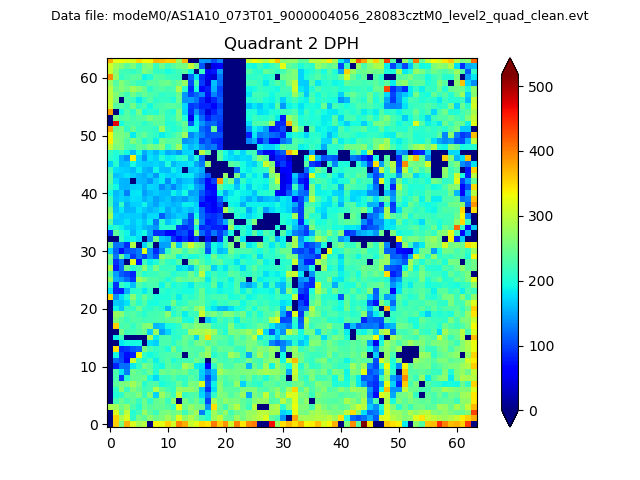
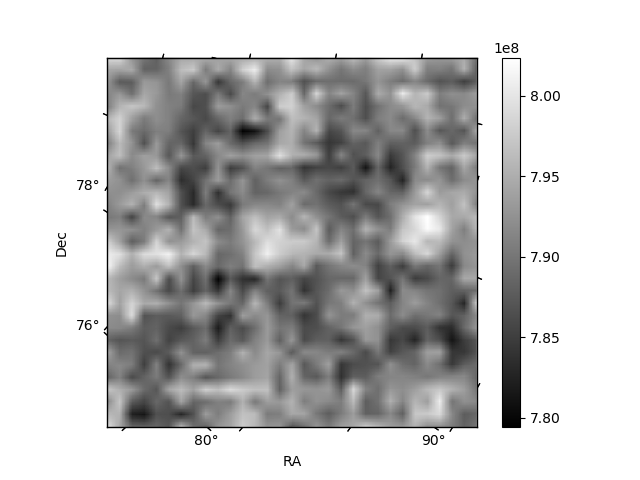
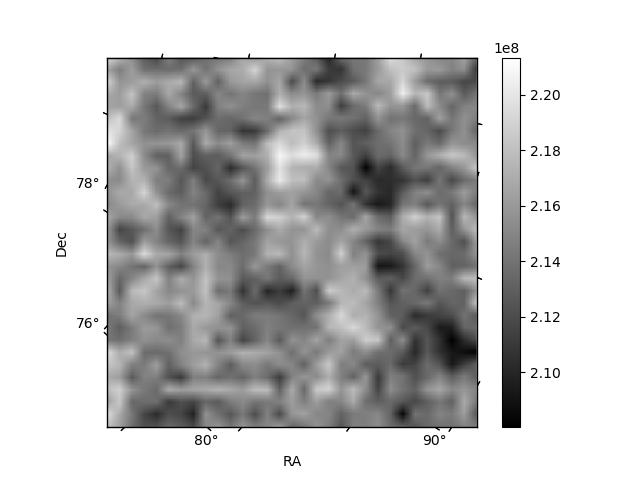
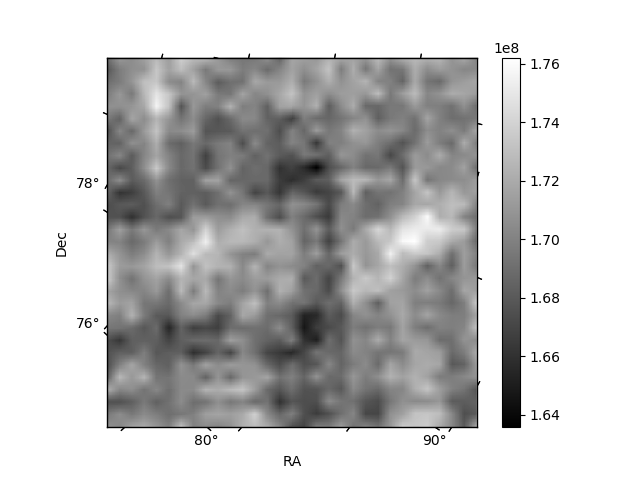
Histogram calculated using DETX and DETY for each event in the final _common_clean file
| Quadrant A | 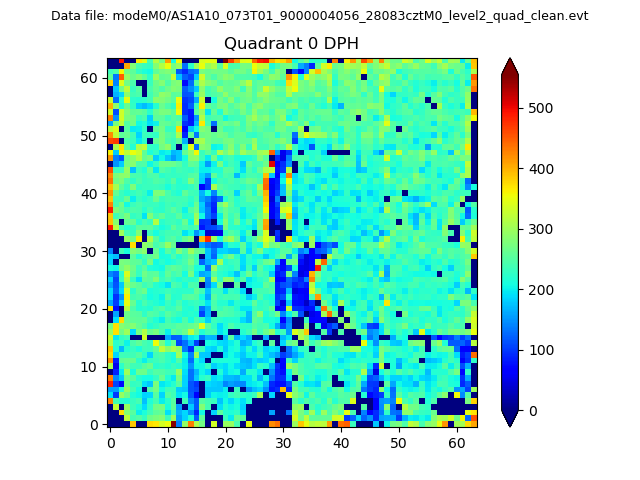 |
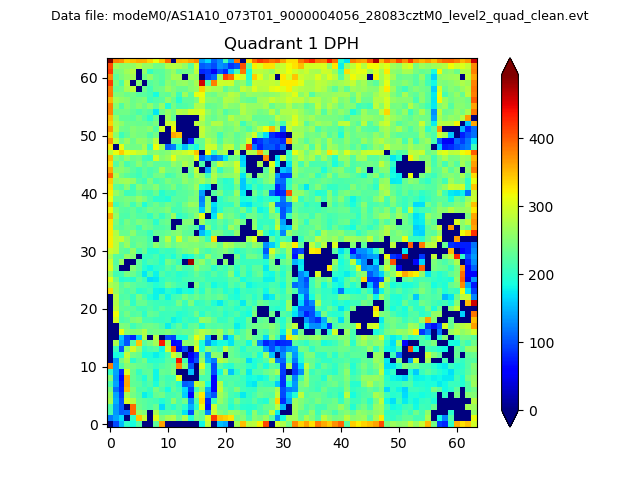 |
Quadrant B |
|---|---|---|---|
| Quadrant D | 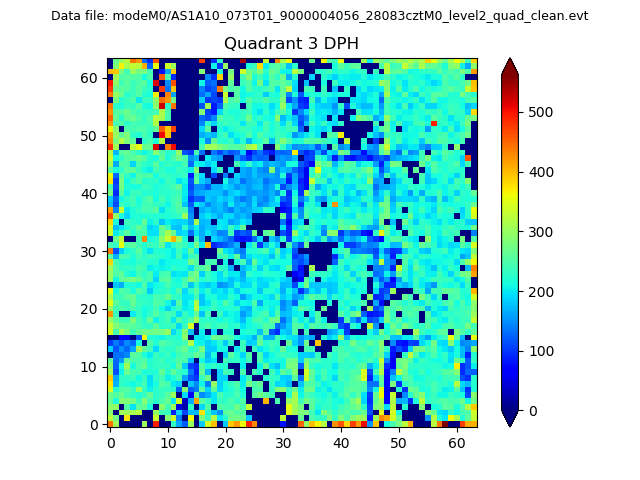 |
 |
Quadrant C |
| Plot type | Count rate plots | Images |
|---|---|---|
| Comparison with Poisson distribution Blue bars denote a histogram of data divided into 1 sec bins. Red curve is a Poisson curve with rate = median count rate of data. |
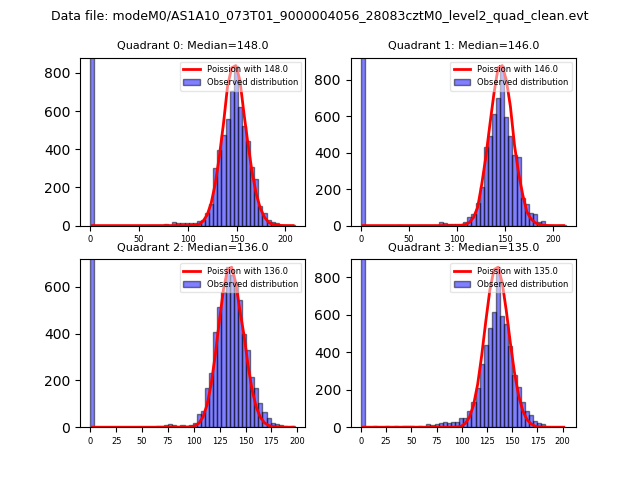 |
 |
| Quadrant-wise count rates Data is divided into 100 sec bins |
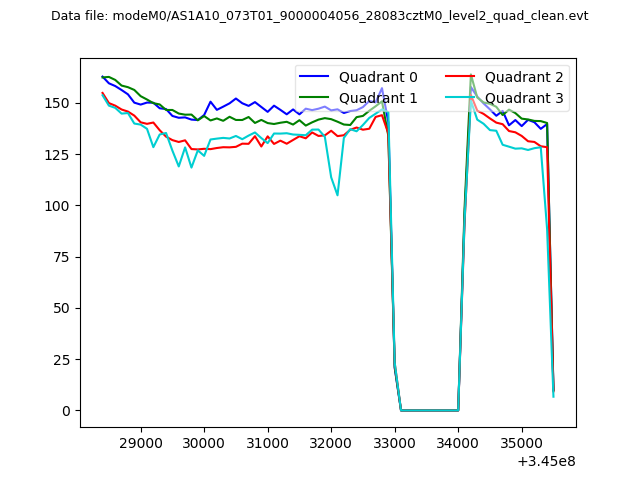 |
|
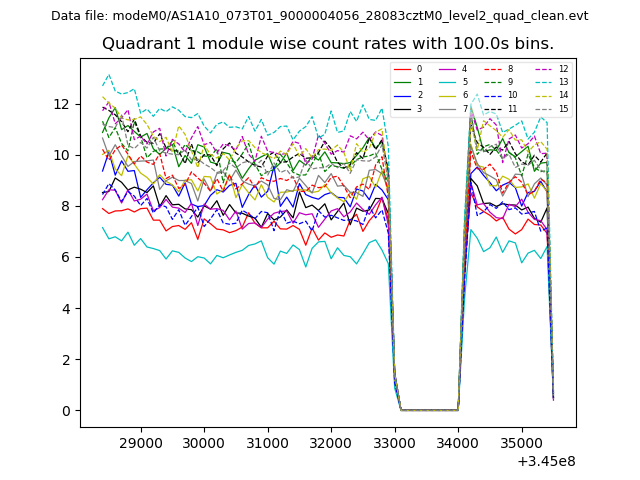
| Module-wise count rates for Quadrant A Data is divided into 100 sec bins |
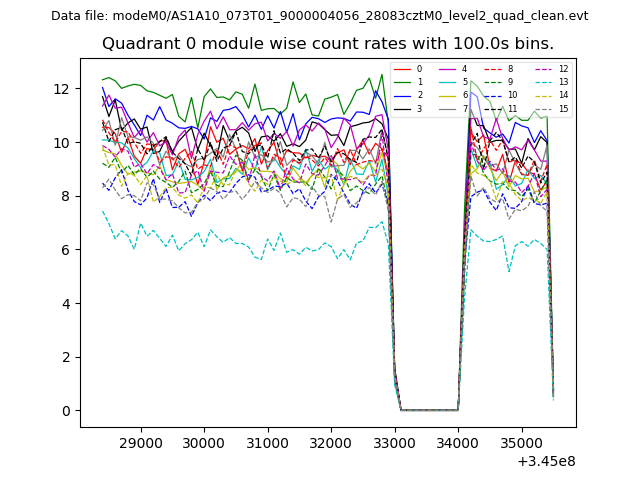 |
 |
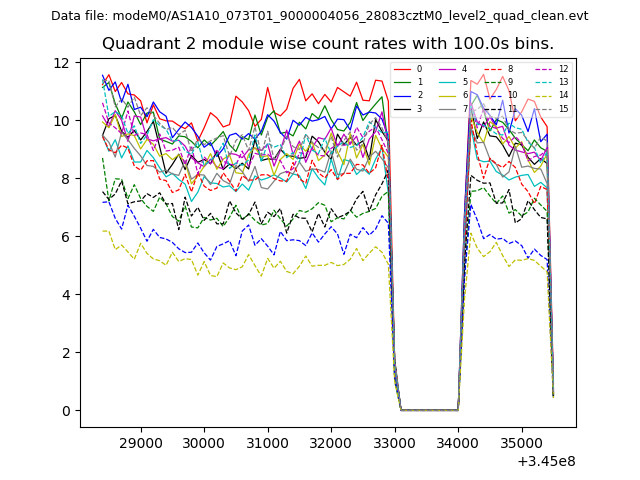
| Module-wise count rates for Quadrant B Data is divided into 100 sec bins |
 |
 |
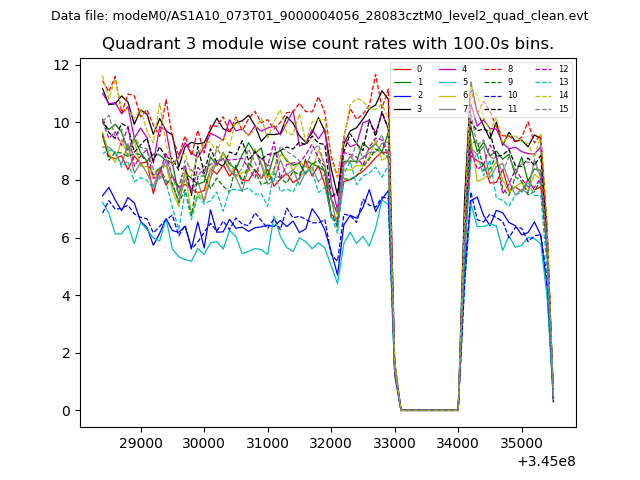
| Module-wise count rates for Quadrant C Data is divided into 100 sec bins |
 |
 |
| Module-wise count rates for Quadrant D Data is divided into 100 sec bins |
 |
 |
| Parameter | Plot |
|---|---|
| CZT HV Monitor | 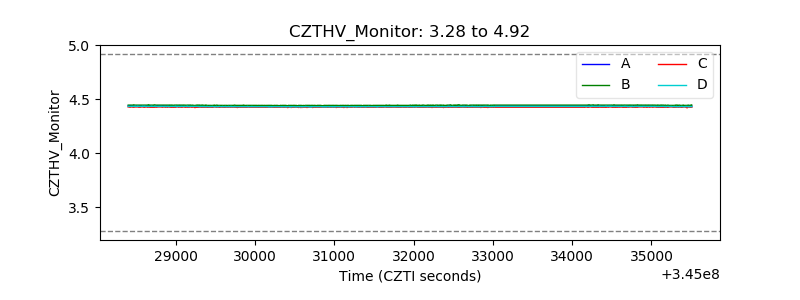 |
| D_VDD | 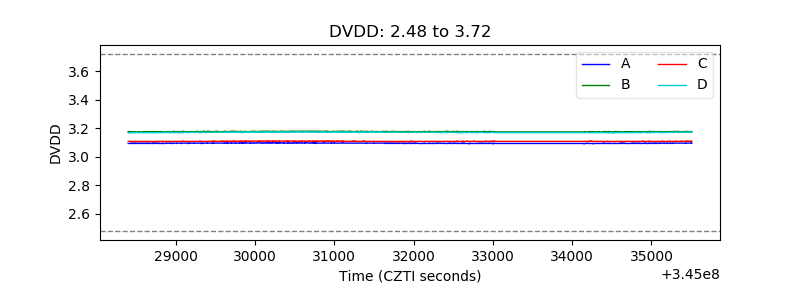 |
| Temperature 1 | 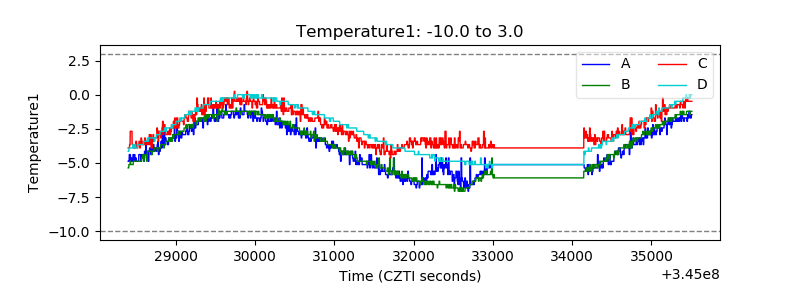 |
| Veto HV Monitor |  |
| Veto LLD |  |
| Alpha Counter |  |
| _CPM_Rate |  |
| CZT Counter | 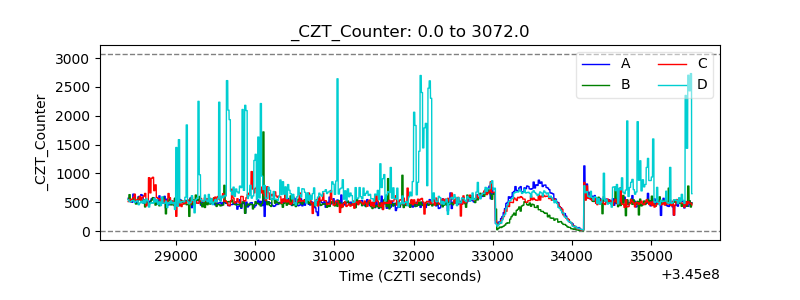 |
| +2.5 Volts monitor |  |
| +5 Volts monitor | 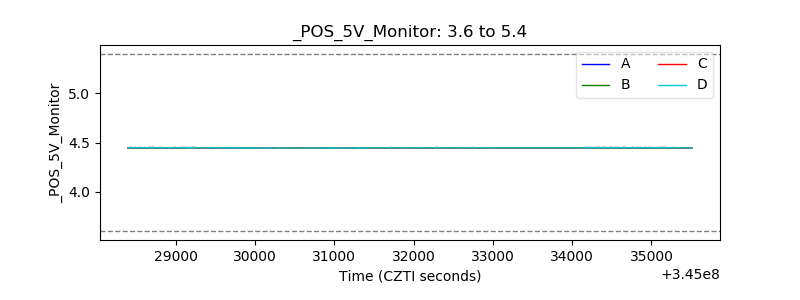 |
| _ROLL_ROT | 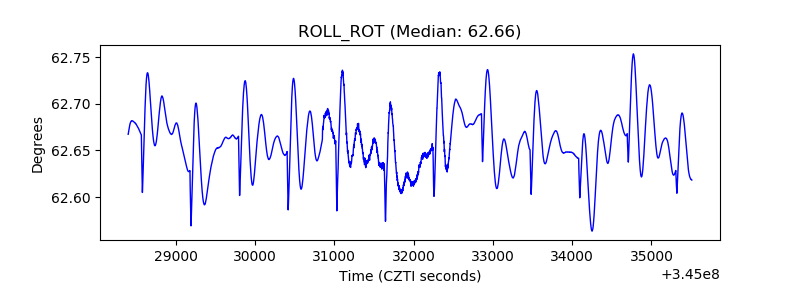 |
| _Roll_DEC | 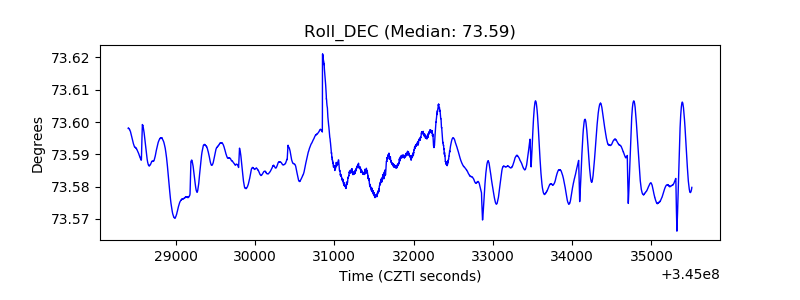 |
| _Roll_RA | 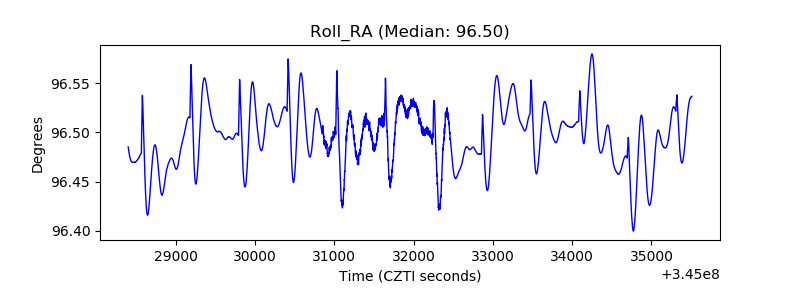 |
| Veto Counter | 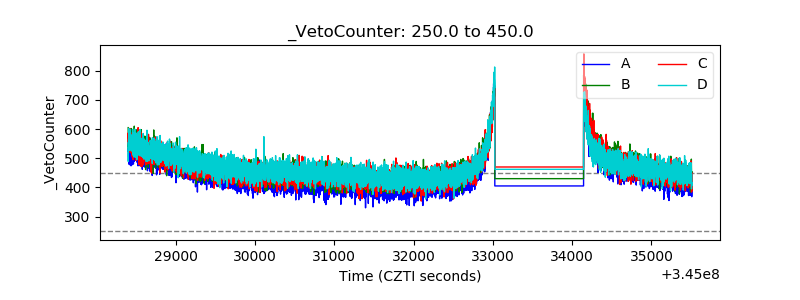 |