| Param | Original file | Final file |
|---|---|---|
| Filename | modeM0/AS1A10_073T01_9000004056_28084cztM0_level2.evt | modeM0/AS1A10_073T01_9000004056_28084cztM0_level2_quad_clean.evt |
| Size (bytes) | 538,341,120 | 139,008,960 |
| Size | 513.4 MB | 132.6 MB |
| Events in quadrant A | 3,358,798 | 975,714 |
| Events in quadrant B | 3,401,581 | 959,516 |
| Events in quadrant C | 3,378,375 | 905,611 |
| Events in quadrant D | 5,690,113 | 881,976 |
| Mode M9 | |||
|---|---|---|---|
| Quadrant | BADHDUFLAG | Total packets | Discarded packets |
| A | 0 | 8 | 0 |
| B | 0 | 8 | 0 |
| C | 0 | 8 | 0 |
| D | 0 | 8 | 0 |
| Mode M0 | |||
|---|---|---|---|
| Quadrant | BADHDUFLAG | Total packets | Discarded packets |
| A | 0 | 14310 | 0 |
| B | 0 | 14456 | 0 |
| C | 0 | 14276 | 0 |
| D | 0 | 21659 | 0 |
| Quadrant | Total seconds | Saturated seconds | Saturation percentage |
|---|---|---|---|
| A | 6998 | 101 | 1.443270% |
| B | 6999 | 128 | 1.828833% |
| C | 6999 | 123 | 1.757394% |
| D | 6998 | 428 | 6.116033% |
Noise dominated data is calculated using 1-second bins in cleaned event files. If a bin has >2000 counts, and if more than 50% of those come from <1% of pixels, then it is considered to be noise-dominated and hence unusable.
| Quadrant | # 1 sec bins | Bins with >0 counts | Bins with >2000 counts | High rate bins dominated by noise | Noise dominated (total time) | Noise dominated (detector-on time) | Marked lightcurve |
|---|---|---|---|---|---|---|---|
| A | 7783 | 6998 | 0 | 0 | 0.00% | 0.00% | 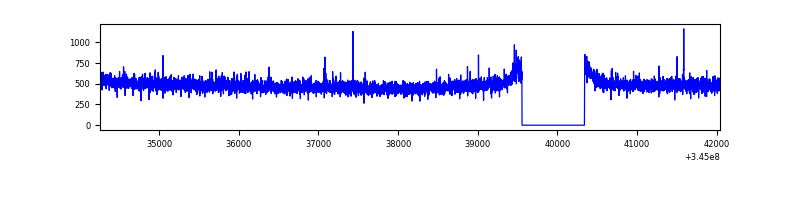 |
| B | 7784 | 6999 | 12 | 12 | 0.15% | 0.17% | 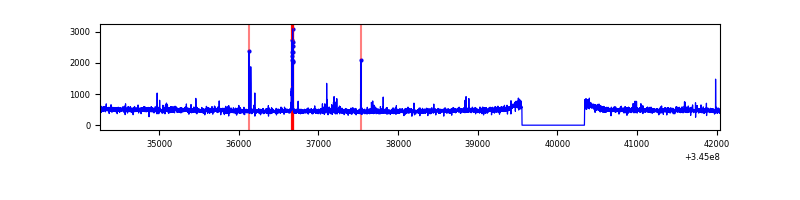 |
| C | 7784 | 7000 | 0 | 0 | 0.00% | 0.00% | 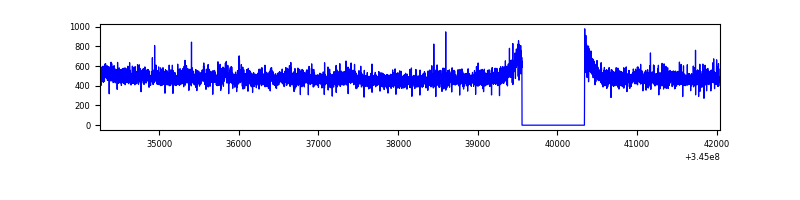 |
| D | 7783 | 6998 | 262 | 262 | 3.37% | 3.74% | 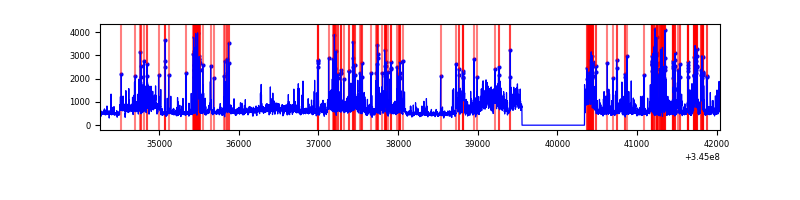 |
Top three noisy pixels from each quadrant. If the there are fewer than three noisy pixels in the level2.evt file, extra rows are filled as -1
| Pixel properties | Quadrant properties | ||||||
|---|---|---|---|---|---|---|---|
| Quadrant | DetID | PixID | Counts | Sigma | Mean | Median | Sigma |
| A | 0 | 13 | 22806 | 128.03 | 863 | 847 | 171.5 |
| A | 13 | 254 | 11703 | 63.29 | 863 | 847 | 171.5 |
| A | 3 | 137 | 7966 | 41.51 | 863 | 847 | 171.5 |
| B | 5 | 172 | 35297 | 219.64 | 842 | 821 | 157.0 |
| B | 12 | 111 | 18955 | 115.53 | 842 | 821 | 157.0 |
| B | 4 | 200 | 17595 | 106.87 | 842 | 821 | 157.0 |
| C | 14 | 238 | 132174 | 699.41 | 808 | 811 | 187.8 |
| C | 3 | 233 | 97062 | 512.47 | 808 | 811 | 187.8 |
| C | 13 | 61 | 5682 | 25.93 | 808 | 811 | 187.8 |
| D | 1 | 52 | 959475 | 4976.61 | 813 | 790 | 192.6 |
| D | 8 | 195 | 770924 | 3997.83 | 813 | 790 | 192.6 |
| D | 2 | 250 | 509961 | 2643.15 | 813 | 790 | 192.6 |
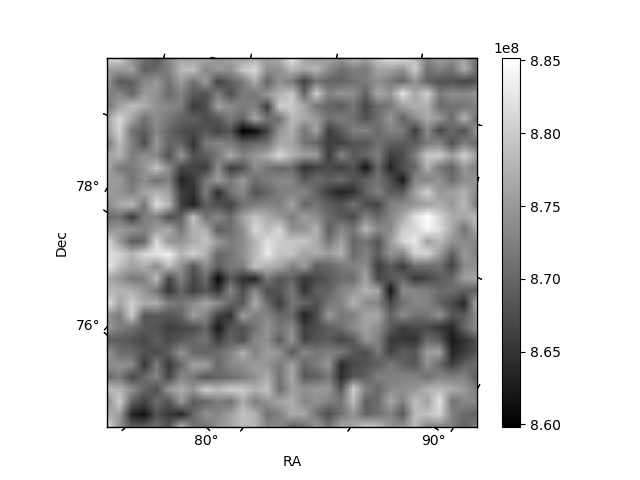
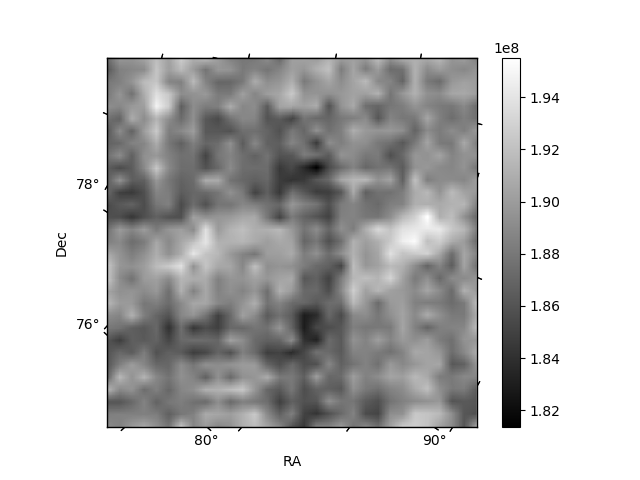
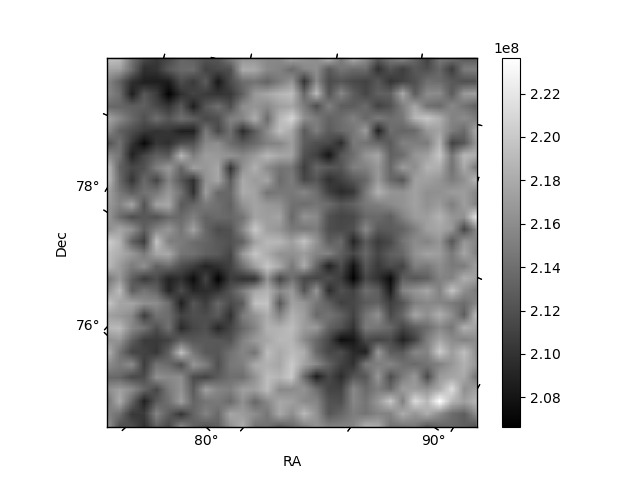
Histogram calculated using DETX and DETY for each event in the final _common_clean file
| Quadrant A | 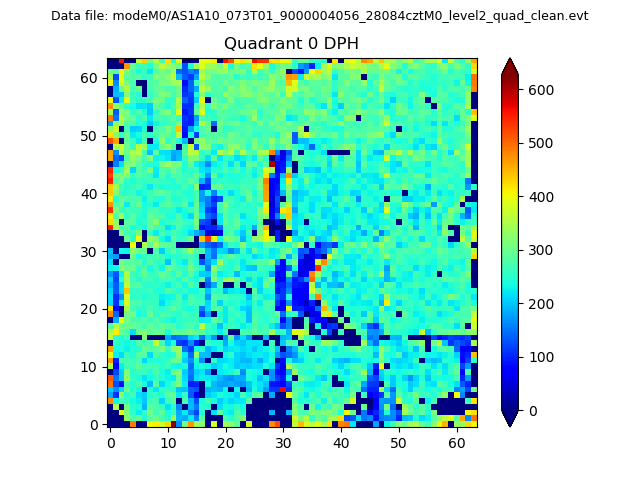 |
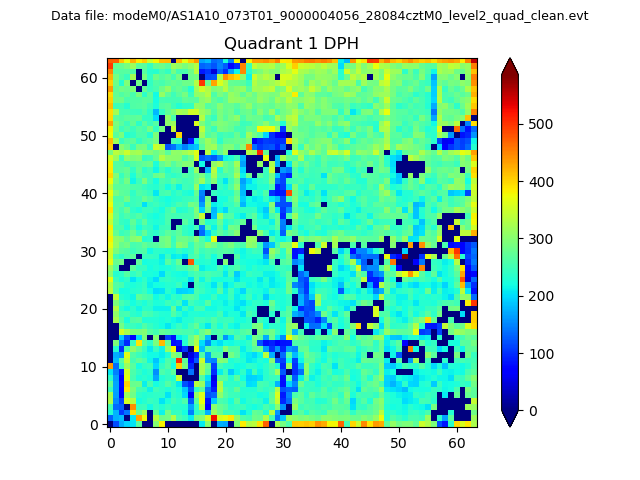 |
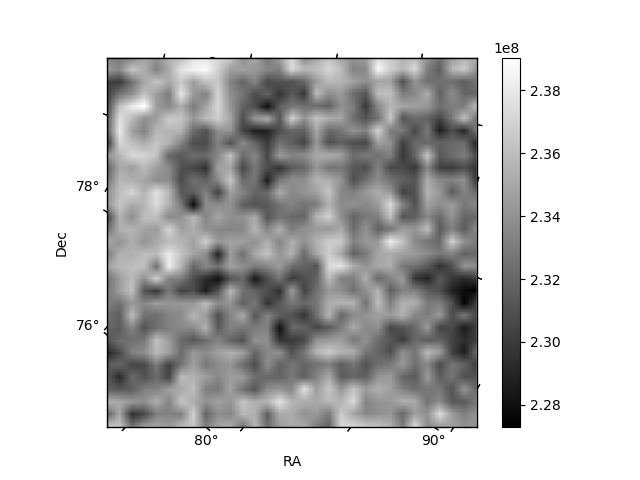
Quadrant B |
|---|---|---|---|
| Quadrant D | 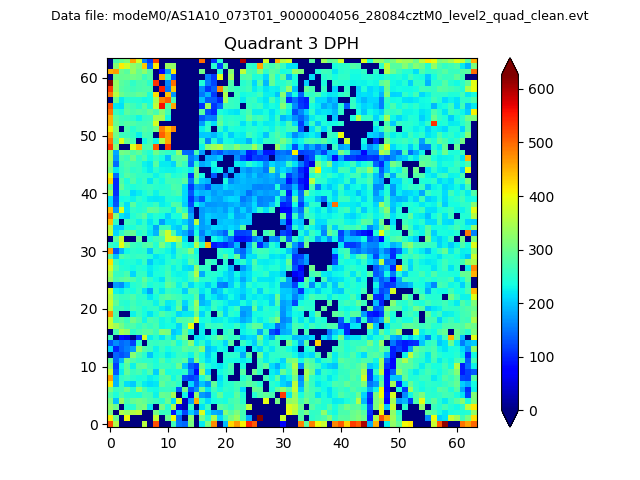 |
 |
Quadrant C |
| Plot type | Count rate plots | Images |
|---|---|---|
| Comparison with Poisson distribution Blue bars denote a histogram of data divided into 1 sec bins. Red curve is a Poisson curve with rate = median count rate of data. |
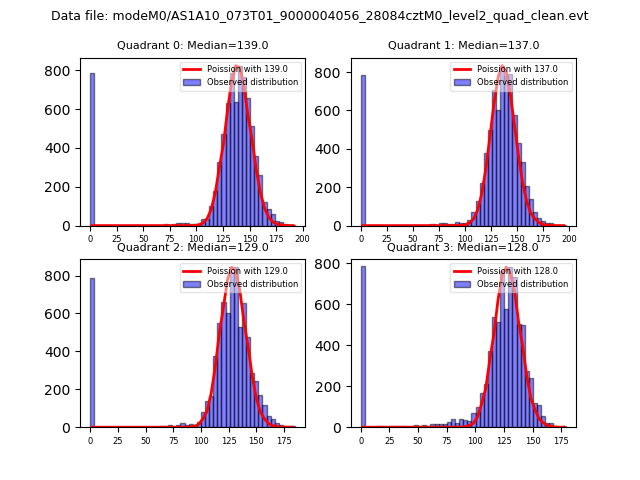 |
 |
| Quadrant-wise count rates Data is divided into 100 sec bins |
 |
|
| Module-wise count rates for Quadrant A Data is divided into 100 sec bins |
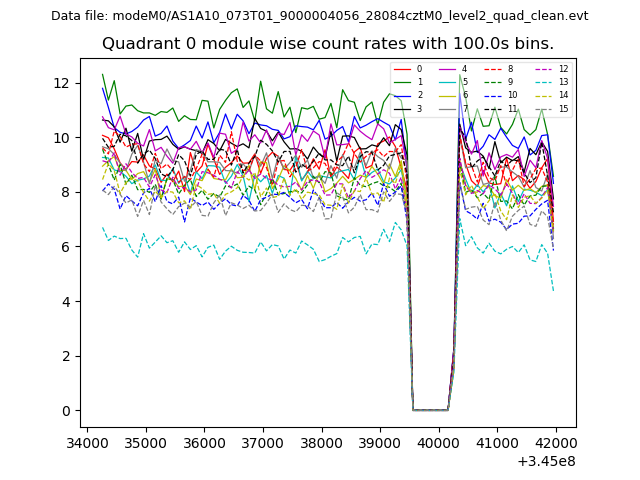 |
 |
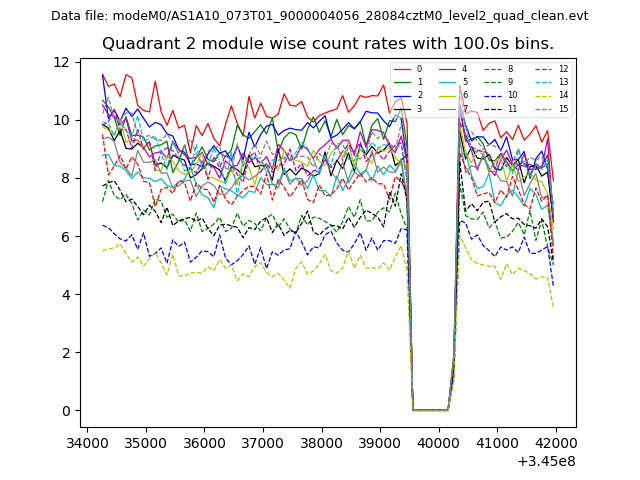
| Module-wise count rates for Quadrant B Data is divided into 100 sec bins |
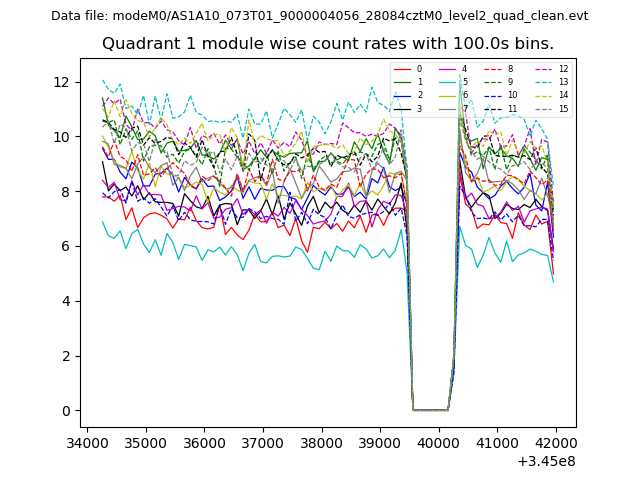 |
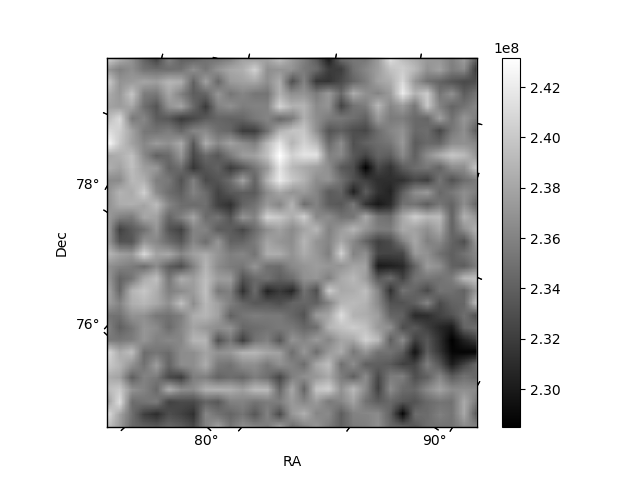 |
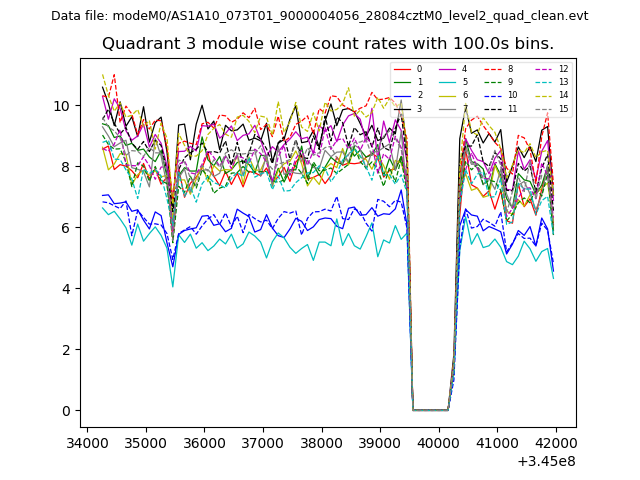
| Module-wise count rates for Quadrant C Data is divided into 100 sec bins |
 |
 |
| Module-wise count rates for Quadrant D Data is divided into 100 sec bins |
 |
 |
| Parameter | Plot |
|---|---|
| CZT HV Monitor | 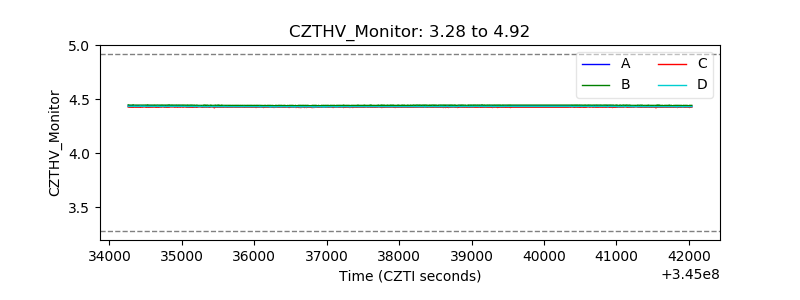 |
| D_VDD | 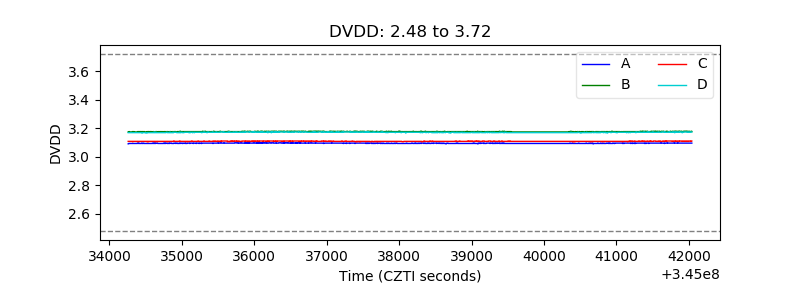 |
| Temperature 1 | 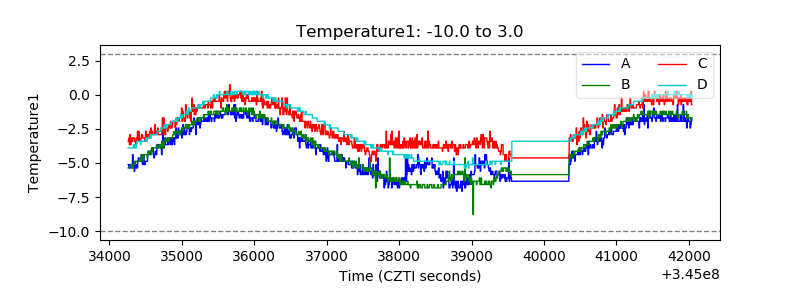 |
| Veto HV Monitor |  |
| Veto LLD | 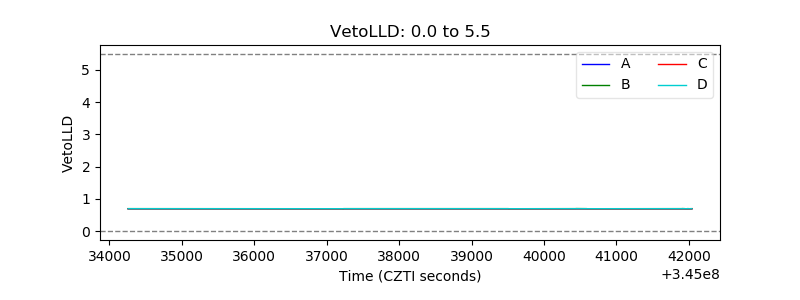 |
| Alpha Counter | 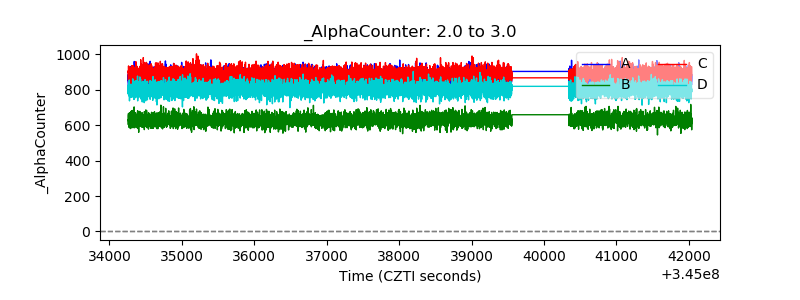 |
| _CPM_Rate | 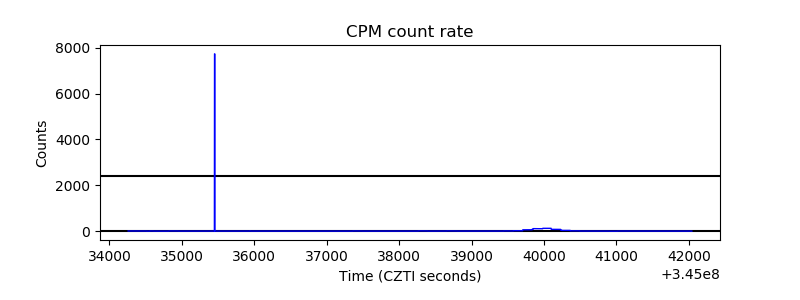 |
| CZT Counter | 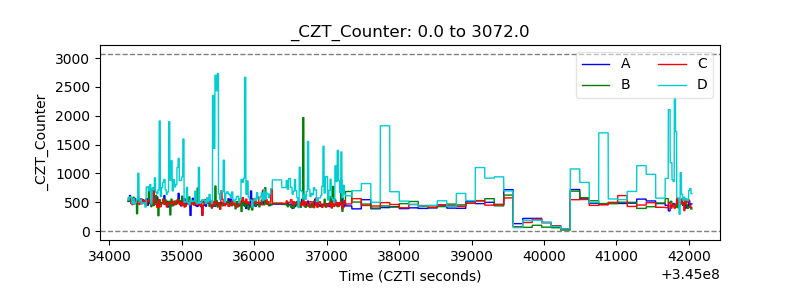 |
| +2.5 Volts monitor | 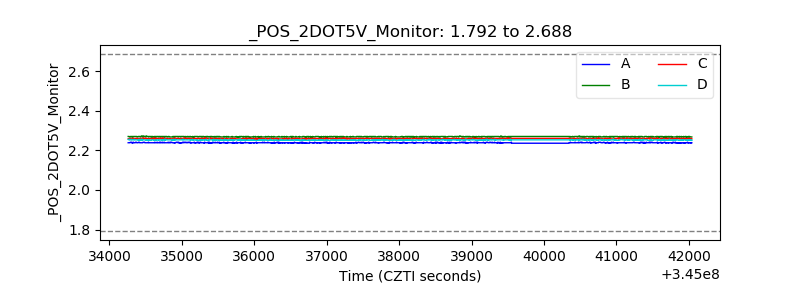 |
| +5 Volts monitor |  |
| _ROLL_ROT | 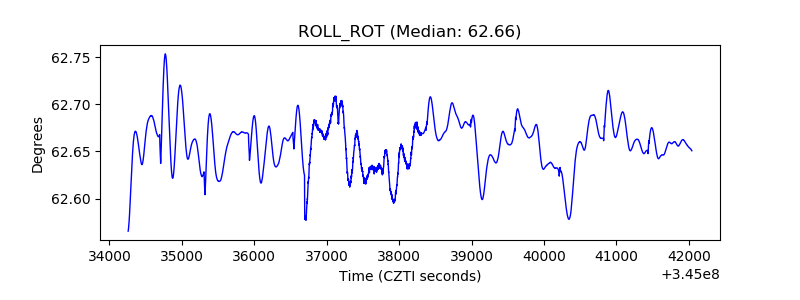 |
| _Roll_DEC | 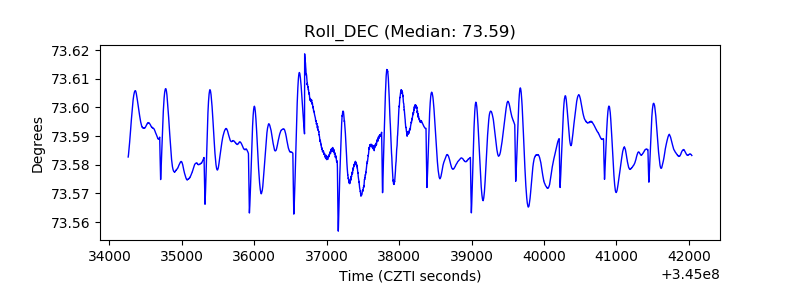 |
| _Roll_RA | 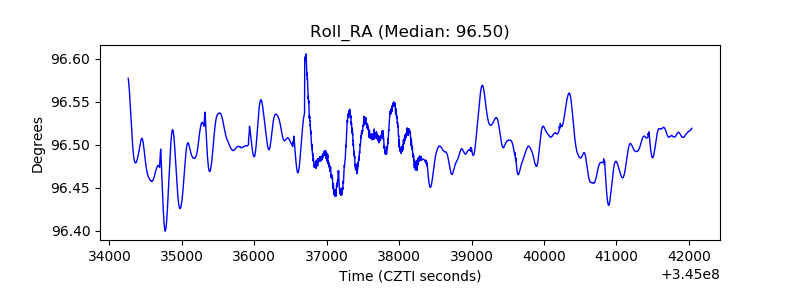 |
| Veto Counter | 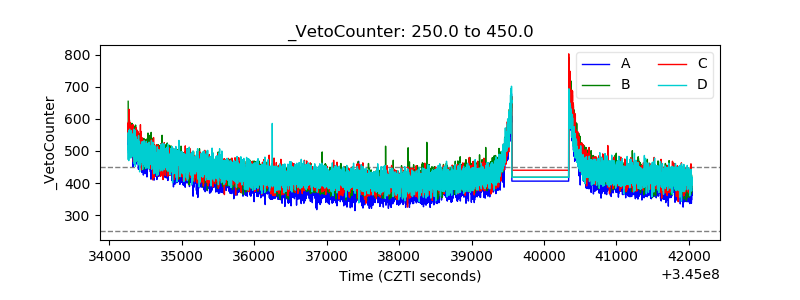 |