| Param | Original file | Final file |
|---|---|---|
| Filename | modeM0/AS1A10_073T01_9000004056_28085cztM0_level2.evt | modeM0/AS1A10_073T01_9000004056_28085cztM0_level2_quad_clean.evt |
| Size (bytes) | 518,336,640 | 127,897,920 |
| Size | 494.3 MB | 122.0 MB |
| Events in quadrant A | 3,173,382 | 895,238 |
| Events in quadrant B | 3,152,152 | 878,609 |
| Events in quadrant C | 3,336,326 | 829,994 |
| Events in quadrant D | 5,582,765 | 804,150 |
| Mode M9 | |||
|---|---|---|---|
| Quadrant | BADHDUFLAG | Total packets | Discarded packets |
| A | 0 | 5 | 0 |
| B | 0 | 5 | 0 |
| C | 0 | 5 | 0 |
| D | 0 | 5 | 0 |
| Mode M0 | |||
|---|---|---|---|
| Quadrant | BADHDUFLAG | Total packets | Discarded packets |
| A | 0 | 13754 | 0 |
| B | 0 | 13743 | 0 |
| C | 0 | 14092 | 0 |
| D | 0 | 21049 | 0 |
| Quadrant | Total seconds | Saturated seconds | Saturation percentage |
|---|---|---|---|
| A | 6684 | 38 | 0.568522% |
| B | 6685 | 49 | 0.732984% |
| C | 6685 | 100 | 1.495886% |
| D | 6685 | 483 | 7.225131% |
Noise dominated data is calculated using 1-second bins in cleaned event files. If a bin has >2000 counts, and if more than 50% of those come from <1% of pixels, then it is considered to be noise-dominated and hence unusable.
| Quadrant | # 1 sec bins | Bins with >0 counts | Bins with >2000 counts | High rate bins dominated by noise | Noise dominated (total time) | Noise dominated (detector-on time) | Marked lightcurve |
|---|---|---|---|---|---|---|---|
| A | 7095 | 6686 | 2 | 2 | 0.03% | 0.03% | 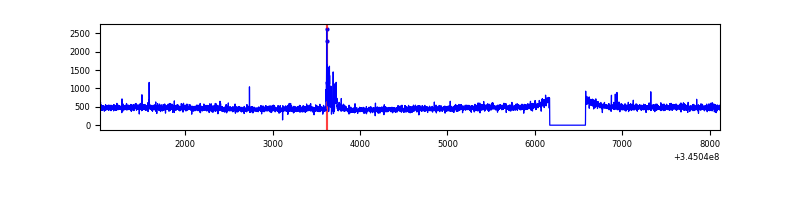 |
| B | 7096 | 6687 | 4 | 4 | 0.06% | 0.06% | 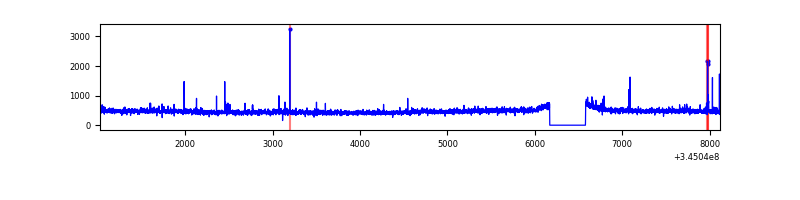 |
| C | 7096 | 6687 | 0 | 0 | 0.00% | 0.00% | 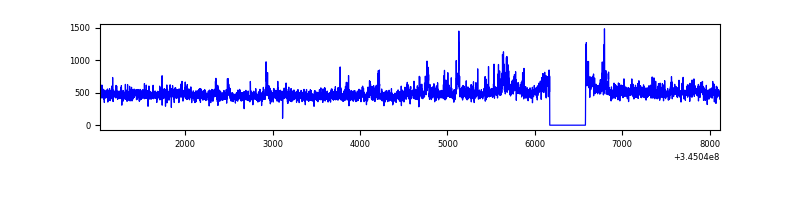 |
| D | 7096 | 6687 | 400 | 400 | 5.64% | 5.98% | 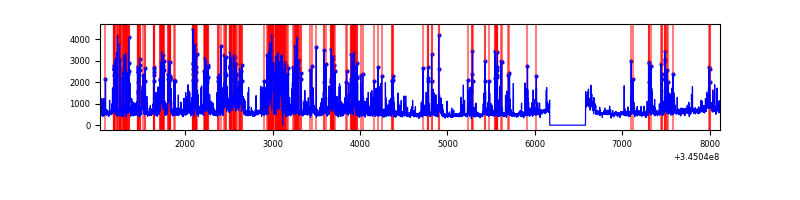 |
Top three noisy pixels from each quadrant. If the there are fewer than three noisy pixels in the level2.evt file, extra rows are filled as -1
| Pixel properties | Quadrant properties | ||||||
|---|---|---|---|---|---|---|---|
| Quadrant | DetID | PixID | Counts | Sigma | Mean | Median | Sigma |
| A | 4 | 2 | 59577 | 366.51 | 803 | 786 | 160.4 |
| A | 0 | 13 | 11930 | 69.47 | 803 | 786 | 160.4 |
| A | 13 | 254 | 10871 | 62.87 | 803 | 786 | 160.4 |
| B | 12 | 111 | 18000 | 116.86 | 787 | 767 | 147.5 |
| B | 0 | 245 | 16431 | 106.22 | 787 | 767 | 147.5 |
| B | 11 | 111 | 16108 | 104.03 | 787 | 767 | 147.5 |
| C | 3 | 233 | 264527 | 1489.95 | 756 | 760 | 177.0 |
| C | 14 | 238 | 123412 | 692.83 | 756 | 760 | 177.0 |
| C | 13 | 61 | 5221 | 25.2 | 756 | 760 | 177.0 |
| D | 1 | 52 | 856835 | 4760.31 | 754 | 733 | 179.8 |
| D | 12 | 1 | 685181 | 3805.84 | 754 | 733 | 179.8 |
| D | 8 | 195 | 552293 | 3066.92 | 754 | 733 | 179.8 |
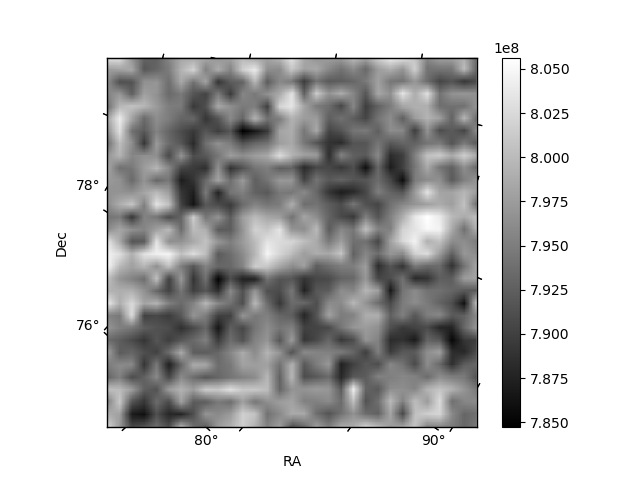
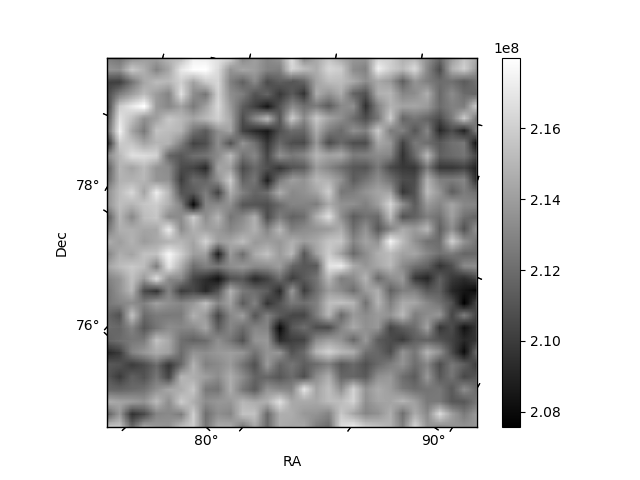
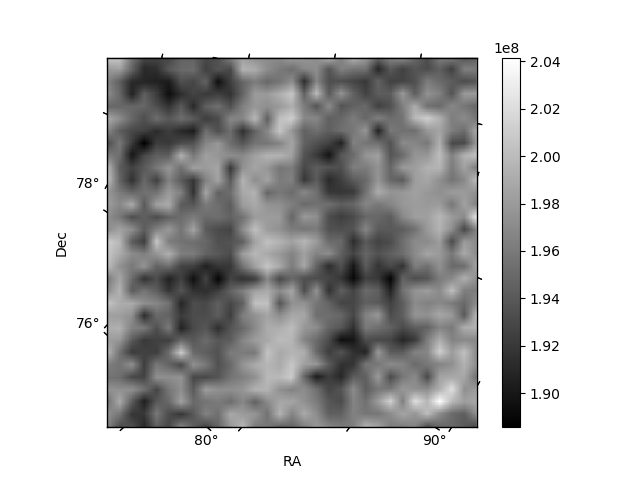
Histogram calculated using DETX and DETY for each event in the final _common_clean file
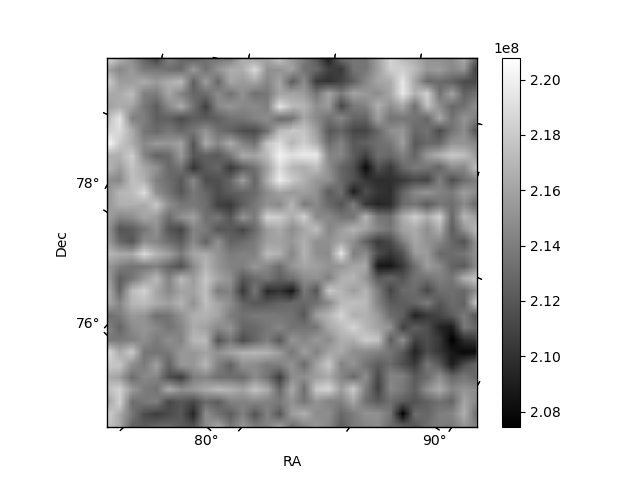
| Quadrant A | 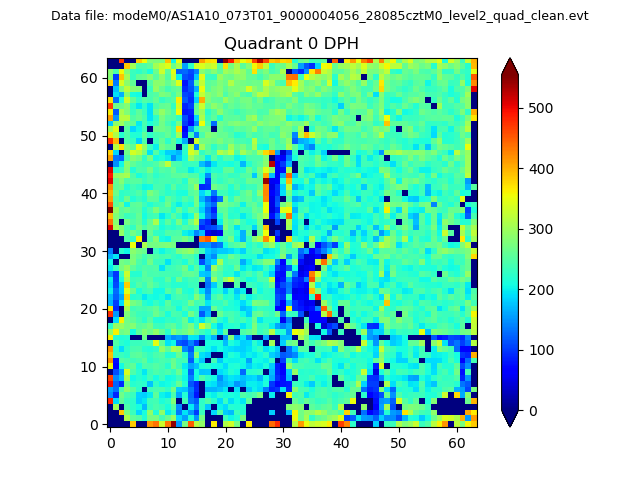 |
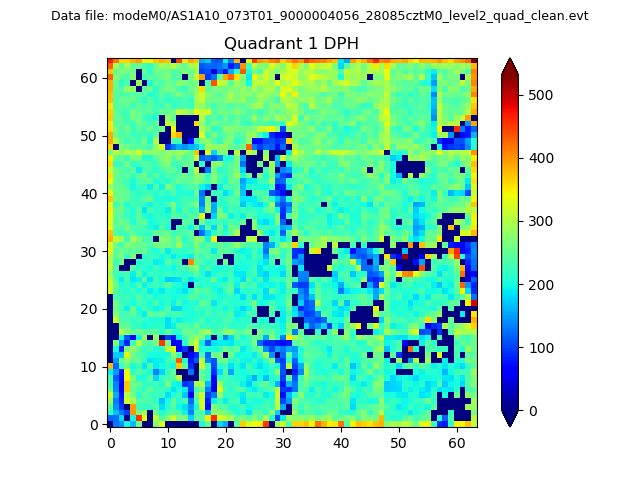 |
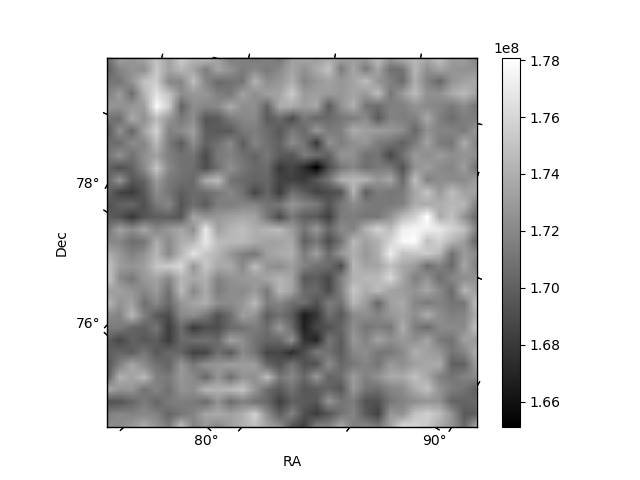
Quadrant B |
|---|---|---|---|
| Quadrant D |  |
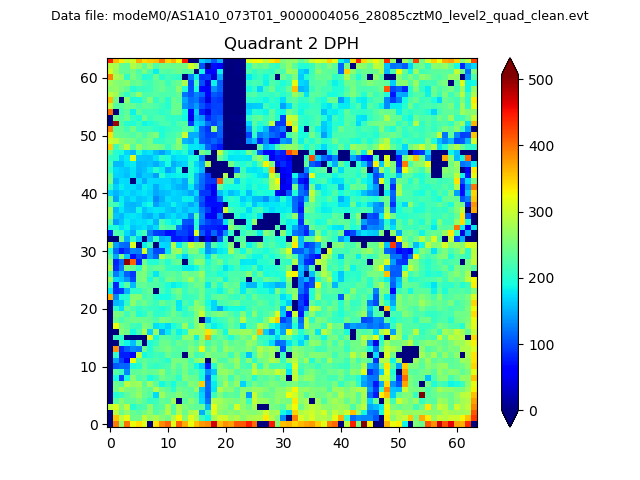 |
Quadrant C |
| Plot type | Count rate plots | Images |
|---|---|---|
| Comparison with Poisson distribution Blue bars denote a histogram of data divided into 1 sec bins. Red curve is a Poisson curve with rate = median count rate of data. |
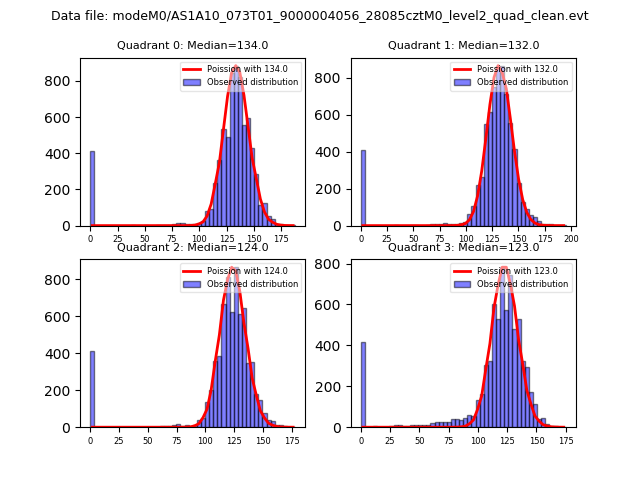 |
 |
| Quadrant-wise count rates Data is divided into 100 sec bins |
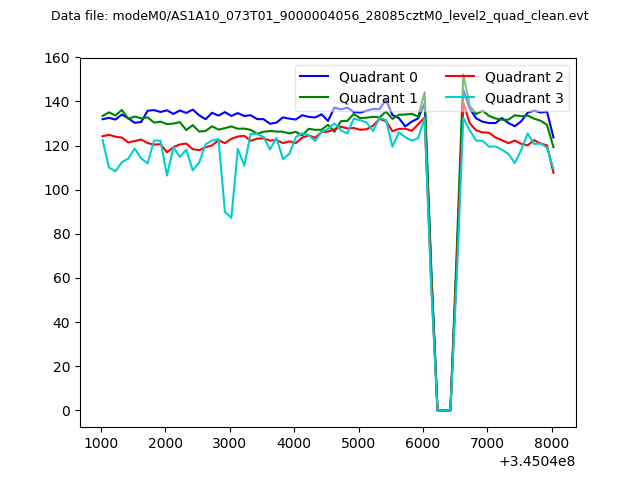 |
|
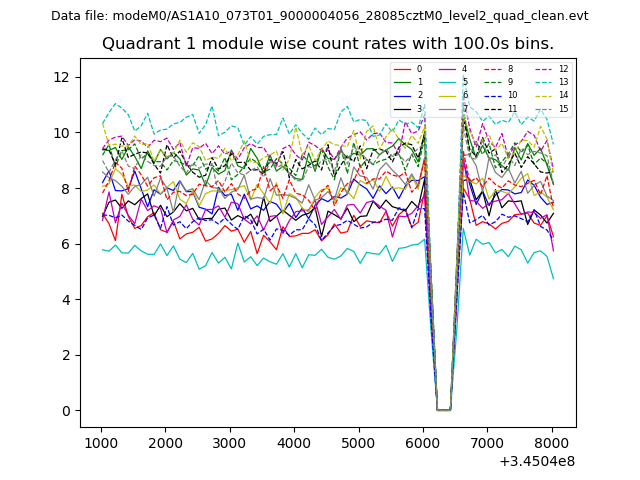
| Module-wise count rates for Quadrant A Data is divided into 100 sec bins |
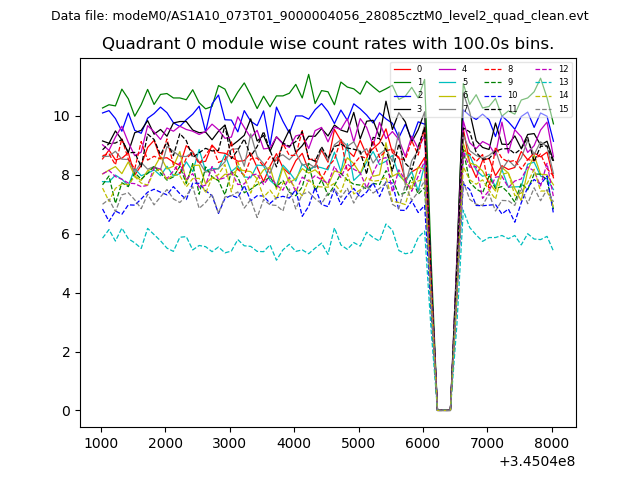 |
 |
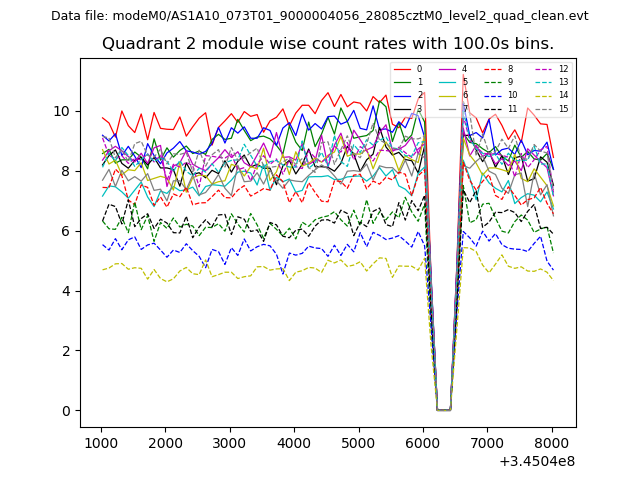
| Module-wise count rates for Quadrant B Data is divided into 100 sec bins |
 |
 |
| Module-wise count rates for Quadrant C Data is divided into 100 sec bins |
 |
 |
| Module-wise count rates for Quadrant D Data is divided into 100 sec bins |
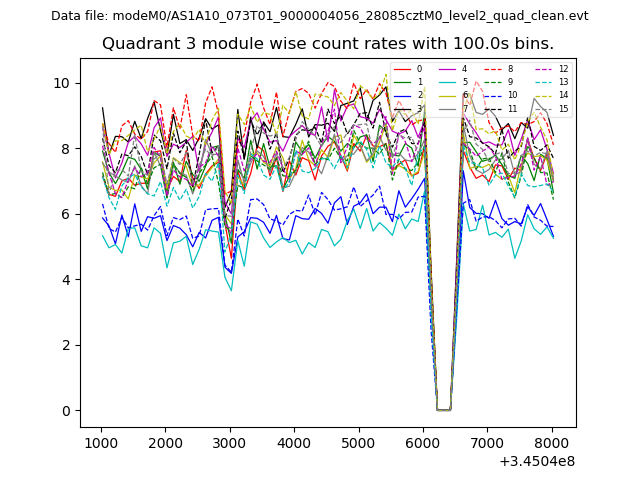 |
 |
| Parameter | Plot |
|---|---|
| CZT HV Monitor | 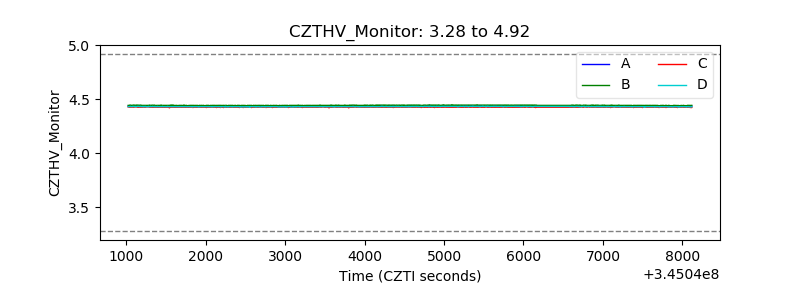 |
| D_VDD | 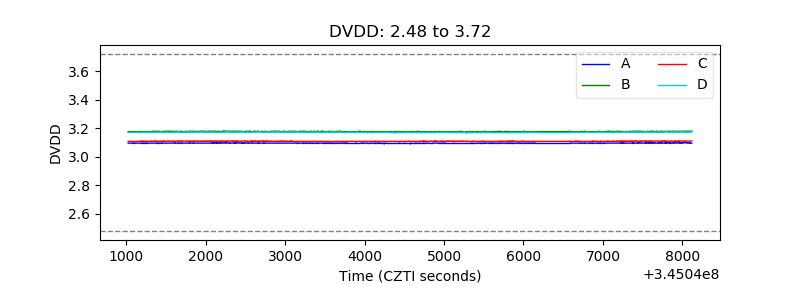 |
| Temperature 1 | 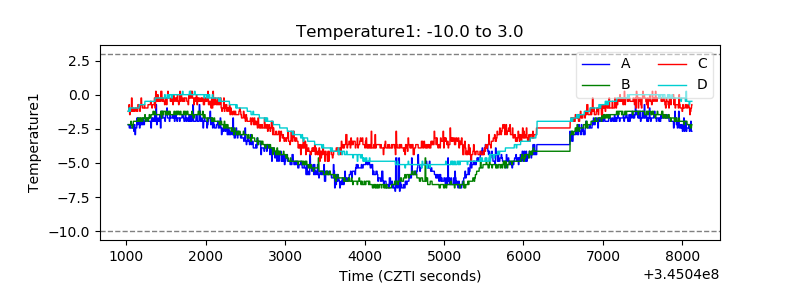 |
| Veto HV Monitor | 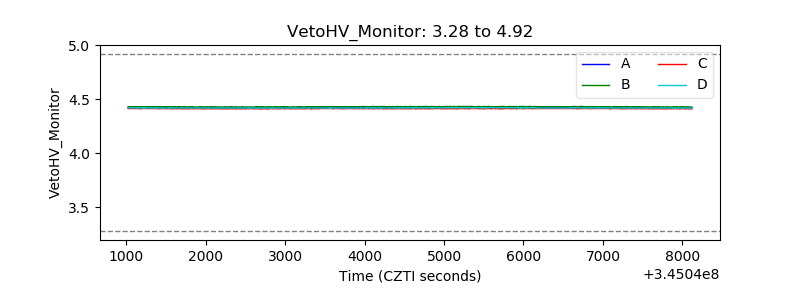 |
| Veto LLD | 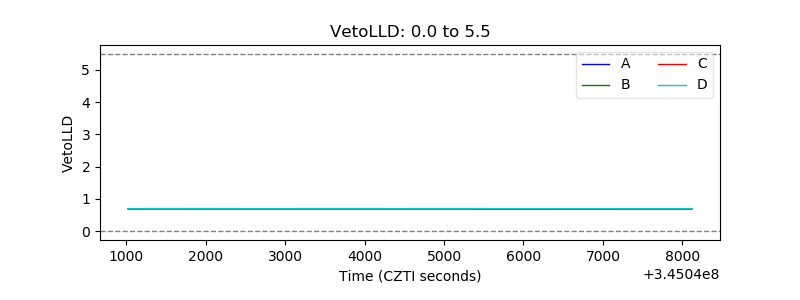 |
| Alpha Counter | 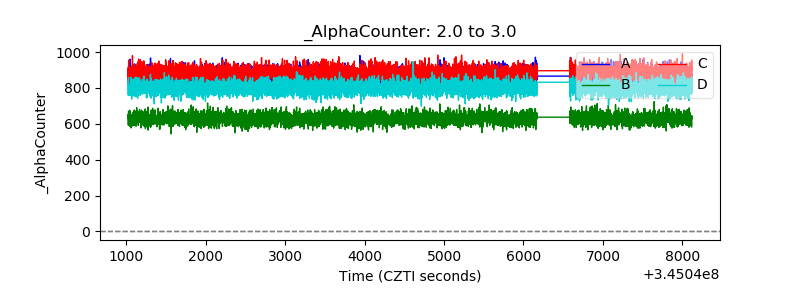 |
| _CPM_Rate |  |
| CZT Counter |  |
| +2.5 Volts monitor |  |
| +5 Volts monitor |  |
| _ROLL_ROT | 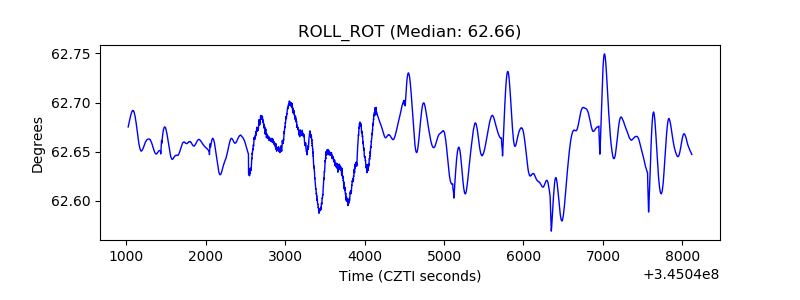 |
| _Roll_DEC | 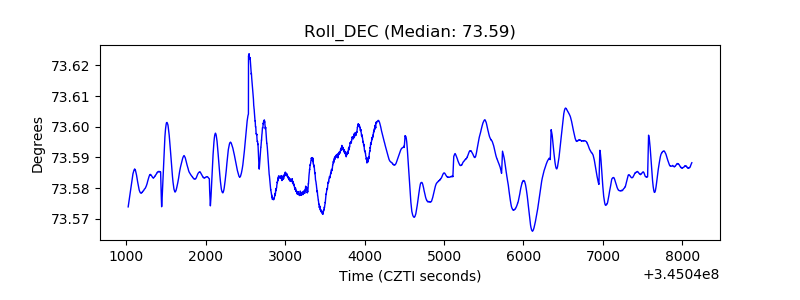 |
| _Roll_RA | 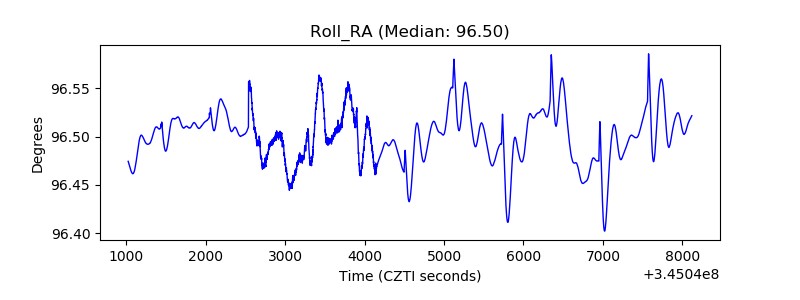 |
| Veto Counter | 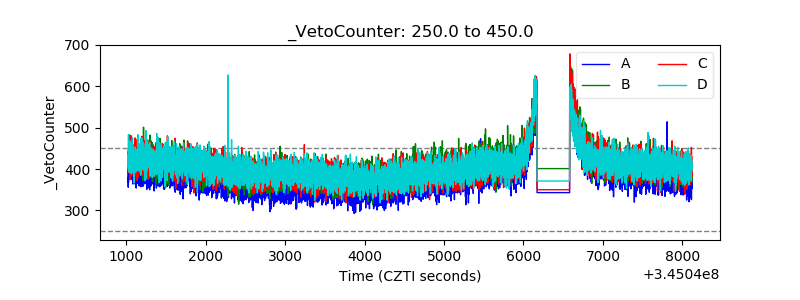 |