| Param | Original file | Final file |
|---|---|---|
| Filename | modeM0/AS1A10_073T01_9000004056_28086cztM0_level2.evt | modeM0/AS1A10_073T01_9000004056_28086cztM0_level2_quad_clean.evt |
| Size (bytes) | 576,941,760 | 139,351,680 |
| Size | 550.2 MB | 132.9 MB |
| Events in quadrant A | 3,489,153 | 972,810 |
| Events in quadrant B | 3,531,326 | 960,843 |
| Events in quadrant C | 4,848,274 | 881,120 |
| Events in quadrant D | 5,104,960 | 893,630 |
| Mode M9 | |||
|---|---|---|---|
| Quadrant | BADHDUFLAG | Total packets | Discarded packets |
| A | 0 | 1 | 0 |
| B | 0 | 1 | 0 |
| C | 0 | 1 | 0 |
| D | 0 | 1 | 0 |
| Mode M0 | |||
|---|---|---|---|
| Quadrant | BADHDUFLAG | Total packets | Discarded packets |
| A | 0 | 15172 | 0 |
| B | 0 | 15335 | 0 |
| C | 0 | 19154 | 0 |
| D | 0 | 20034 | 0 |
| Quadrant | Total seconds | Saturated seconds | Saturation percentage |
|---|---|---|---|
| A | 7353 | 82 | 1.115191% |
| B | 7354 | 132 | 1.794942% |
| C | 7354 | 535 | 7.274952% |
| D | 7354 | 321 | 4.364971% |
Noise dominated data is calculated using 1-second bins in cleaned event files. If a bin has >2000 counts, and if more than 50% of those come from <1% of pixels, then it is considered to be noise-dominated and hence unusable.
| Quadrant | # 1 sec bins | Bins with >0 counts | Bins with >2000 counts | High rate bins dominated by noise | Noise dominated (total time) | Noise dominated (detector-on time) | Marked lightcurve |
|---|---|---|---|---|---|---|---|
| A | 7458 | 7354 | 0 | 0 | 0.00% | 0.00% | 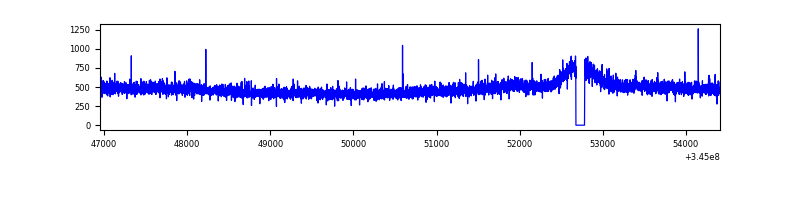 |
| B | 7459 | 7355 | 6 | 6 | 0.08% | 0.08% | 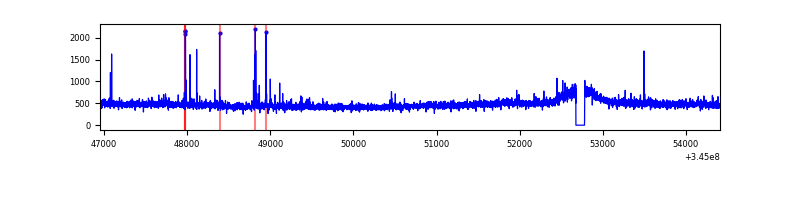 |
| C | 7459 | 7355 | 97 | 97 | 1.30% | 1.32% | 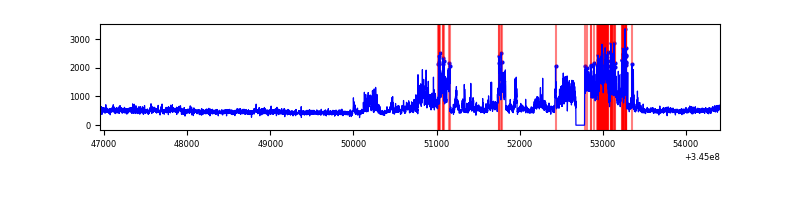 |
| D | 7459 | 7355 | 145 | 145 | 1.94% | 1.97% | 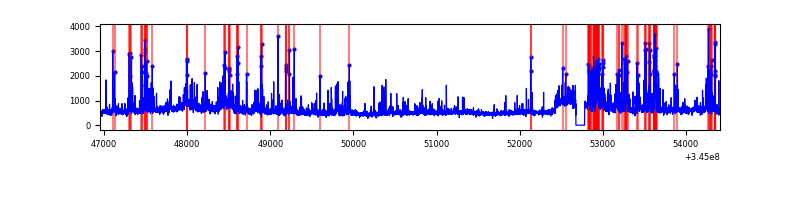 |
Top three noisy pixels from each quadrant. If the there are fewer than three noisy pixels in the level2.evt file, extra rows are filled as -1
| Pixel properties | Quadrant properties | ||||||
|---|---|---|---|---|---|---|---|
| Quadrant | DetID | PixID | Counts | Sigma | Mean | Median | Sigma |
| A | 0 | 13 | 35735 | 193.07 | 895 | 875 | 180.6 |
| A | 13 | 254 | 12846 | 66.3 | 895 | 875 | 180.6 |
| A | 3 | 137 | 8628 | 42.94 | 895 | 875 | 180.6 |
| B | 12 | 111 | 20247 | 116.59 | 878 | 852 | 166.4 |
| B | 11 | 111 | 18112 | 103.75 | 878 | 852 | 166.4 |
| B | 4 | 200 | 16601 | 94.67 | 878 | 852 | 166.4 |
| C | 3 | 233 | 1480254 | 7633.23 | 827 | 829 | 193.8 |
| C | 14 | 238 | 133441 | 684.22 | 827 | 829 | 193.8 |
| C | 2 | 16 | 7844 | 36.19 | 827 | 829 | 193.8 |
| D | 8 | 195 | 785936 | 3858.73 | 852 | 828 | 203.5 |
| D | 2 | 250 | 291100 | 1426.66 | 852 | 828 | 203.5 |
| D | 1 | 52 | 262998 | 1288.54 | 852 | 828 | 203.5 |
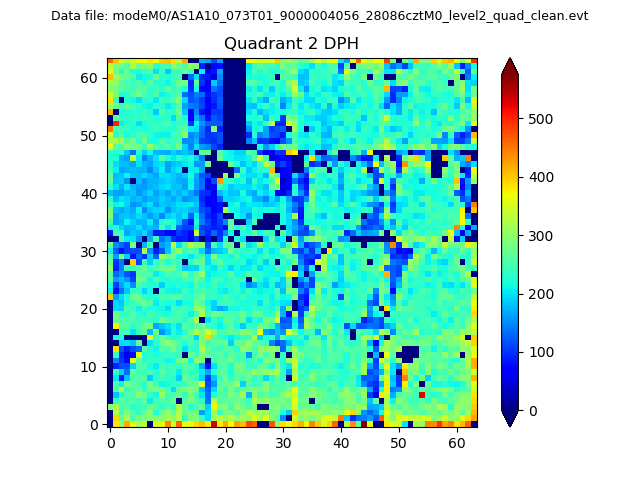
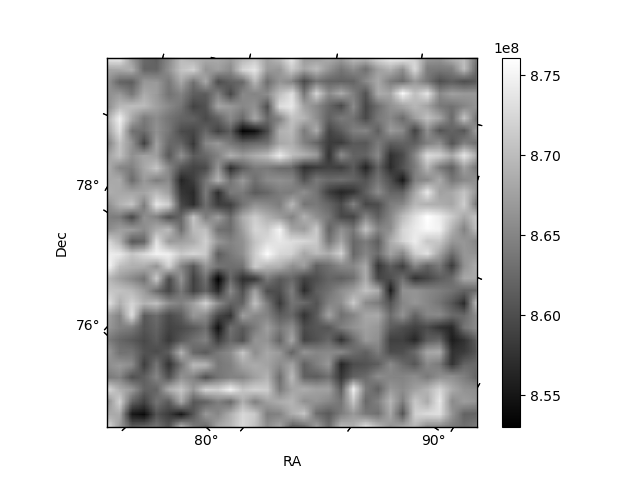
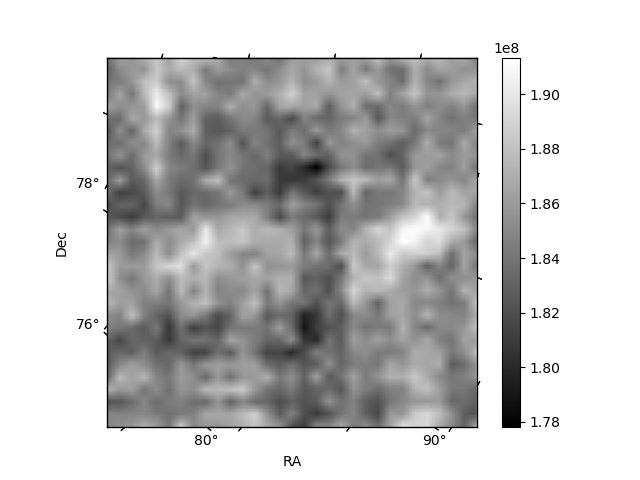
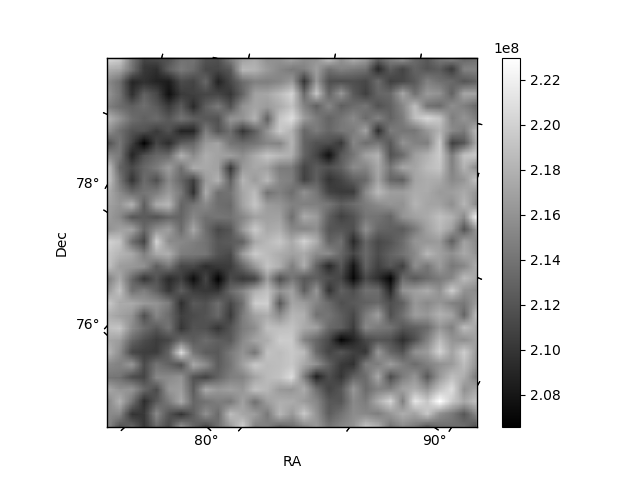
Histogram calculated using DETX and DETY for each event in the final _common_clean file
| Quadrant A | 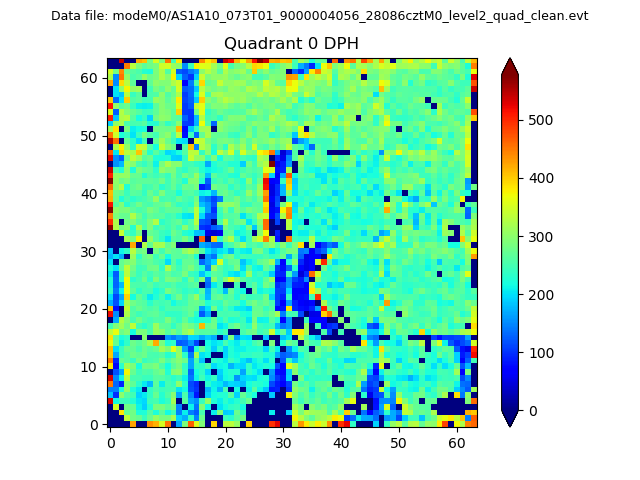 |
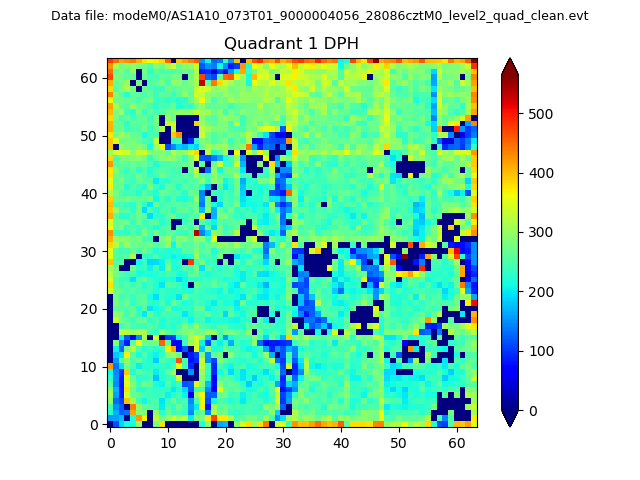 |
Quadrant B |
|---|---|---|---|
| Quadrant D | 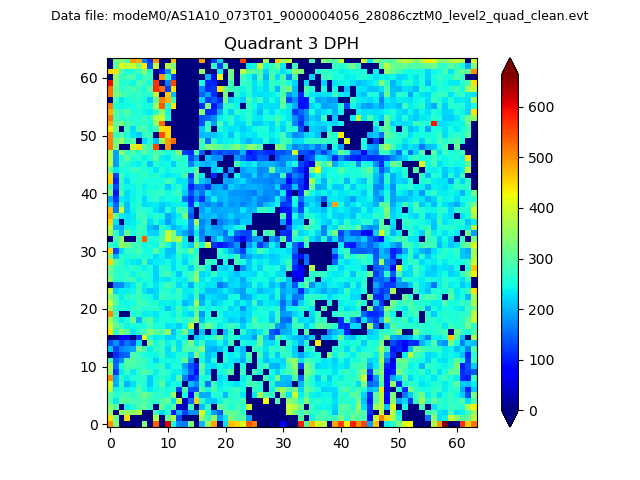 |
 |
Quadrant C |
| Plot type | Count rate plots | Images |
|---|---|---|
| Comparison with Poisson distribution Blue bars denote a histogram of data divided into 1 sec bins. Red curve is a Poisson curve with rate = median count rate of data. |
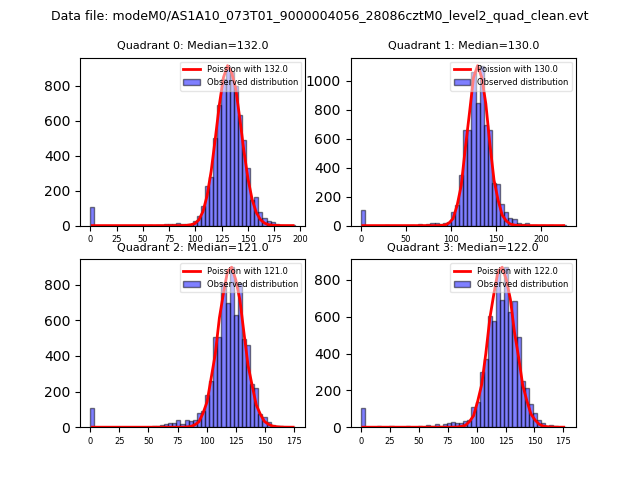 |
 |
| Quadrant-wise count rates Data is divided into 100 sec bins |
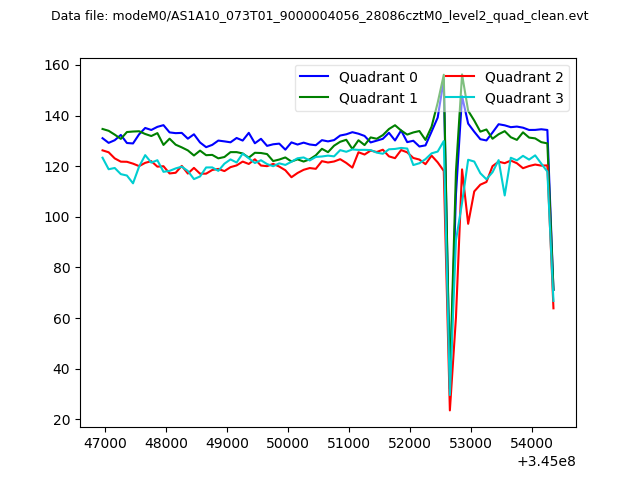 |
|
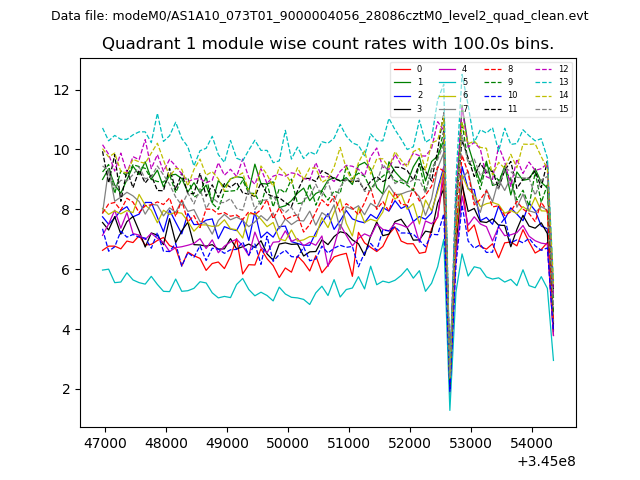
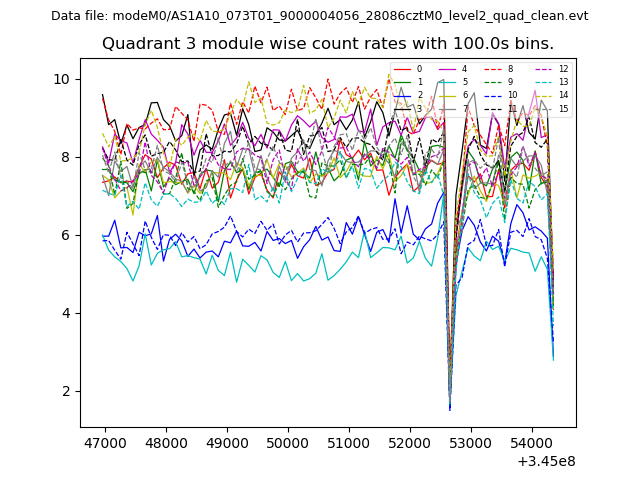
| Module-wise count rates for Quadrant A Data is divided into 100 sec bins |
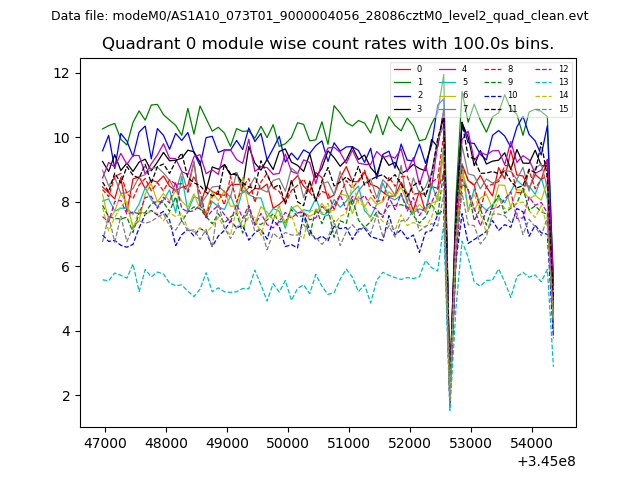 |
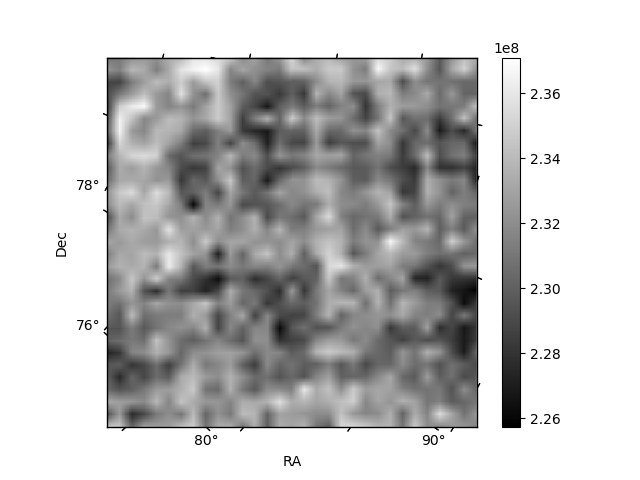 |
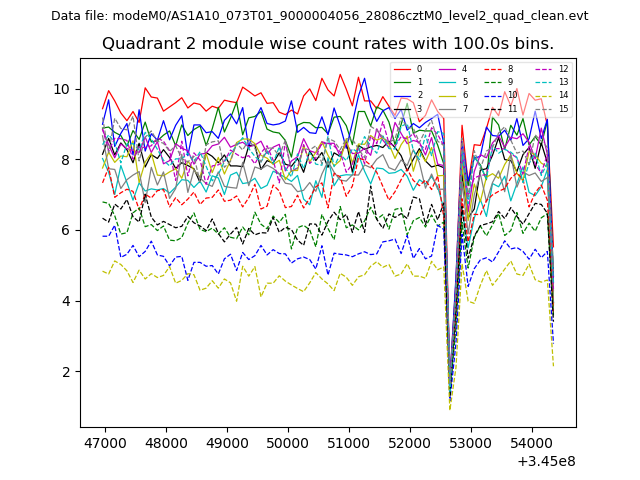
| Module-wise count rates for Quadrant B Data is divided into 100 sec bins |
 |
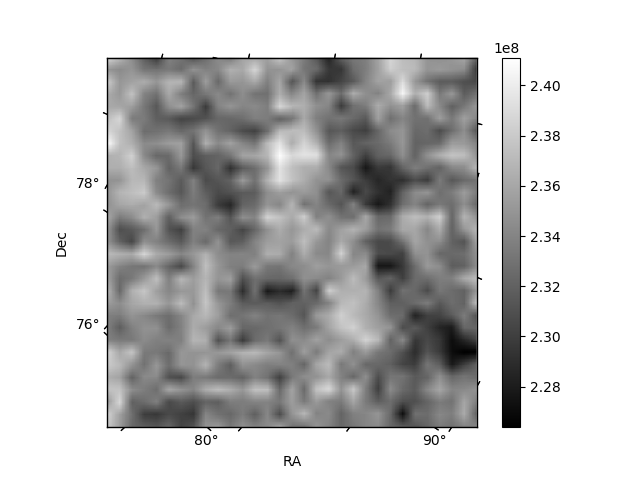 |
| Module-wise count rates for Quadrant C Data is divided into 100 sec bins |
 |
 |
| Module-wise count rates for Quadrant D Data is divided into 100 sec bins |
 |
 |
| Parameter | Plot |
|---|---|
| CZT HV Monitor | 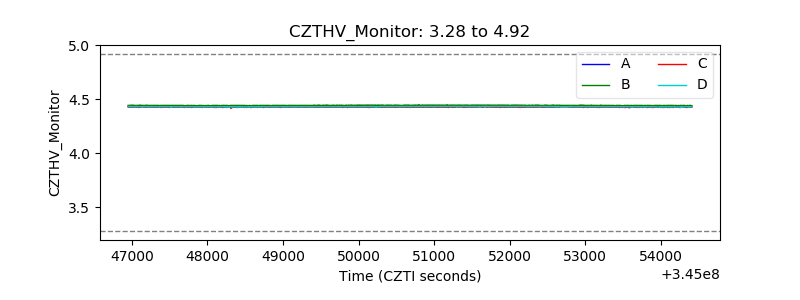 |
| D_VDD | 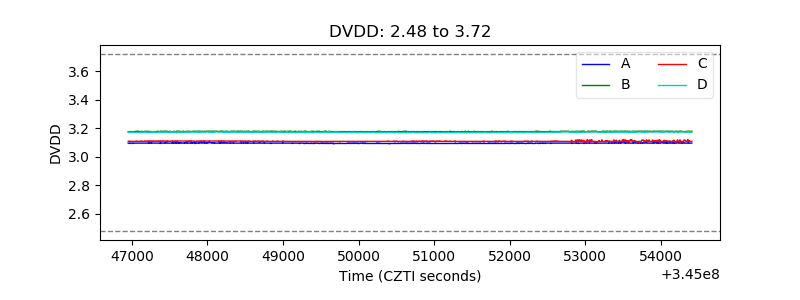 |
| Temperature 1 | 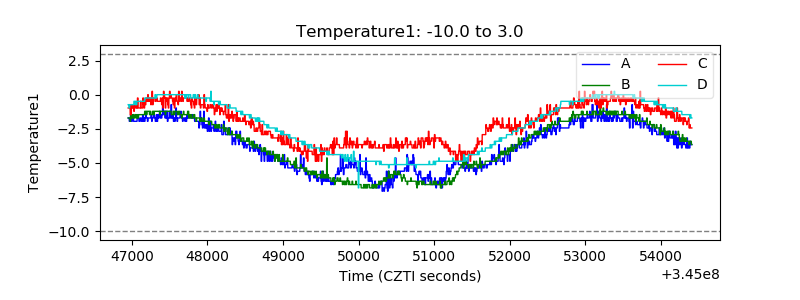 |
| Veto HV Monitor | 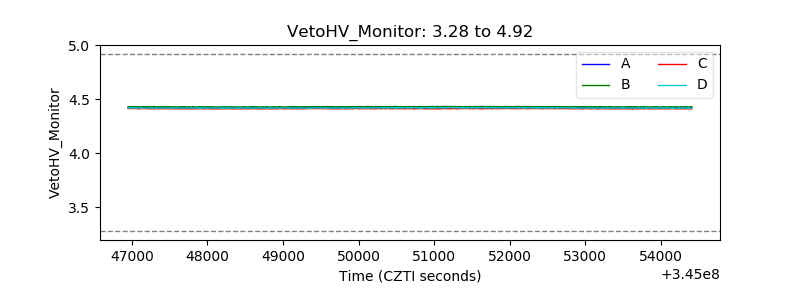 |
| Veto LLD | 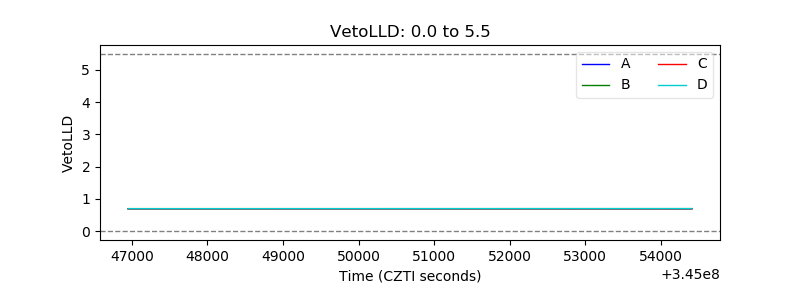 |
| Alpha Counter | 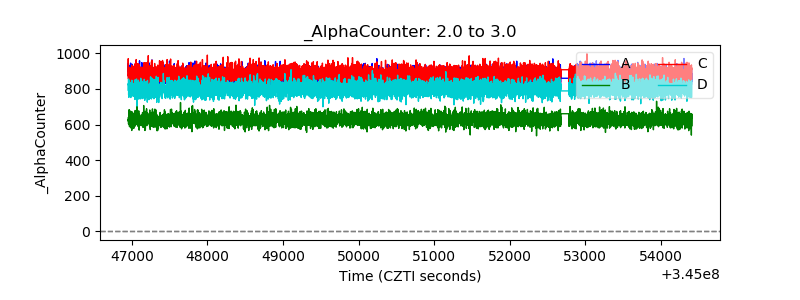 |
| _CPM_Rate | 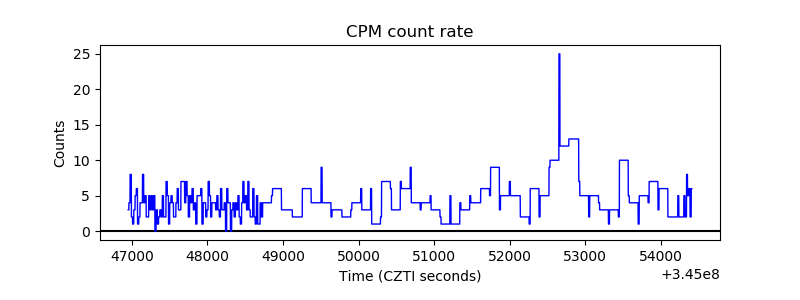 |
| CZT Counter | 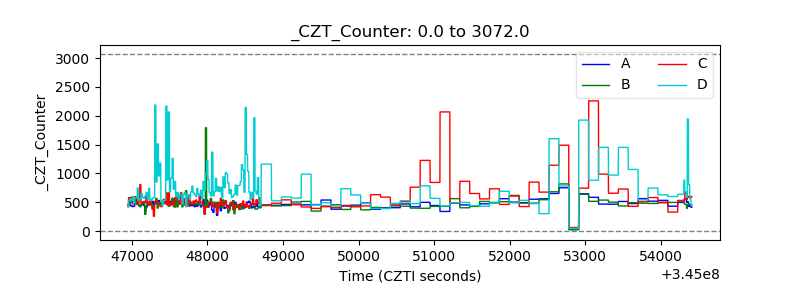 |
| +2.5 Volts monitor |  |
| +5 Volts monitor |  |
| _ROLL_ROT | 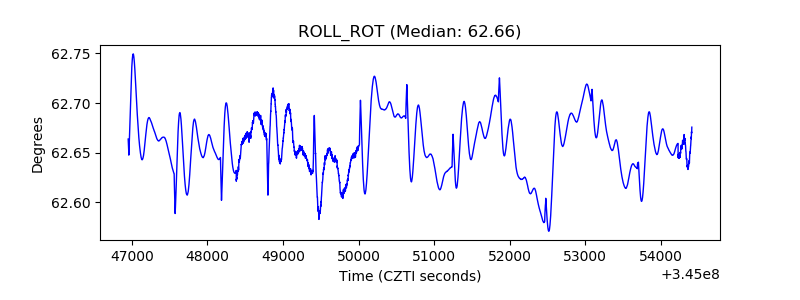 |
| _Roll_DEC | 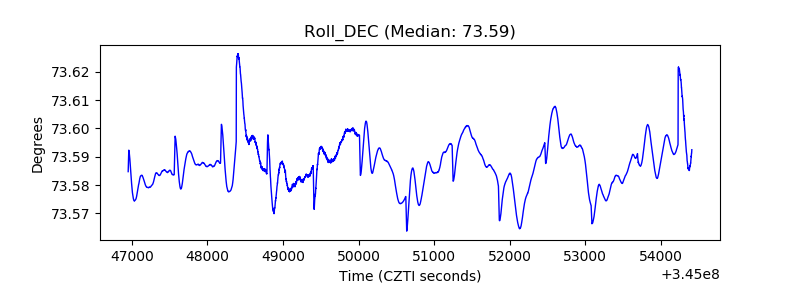 |
| _Roll_RA | 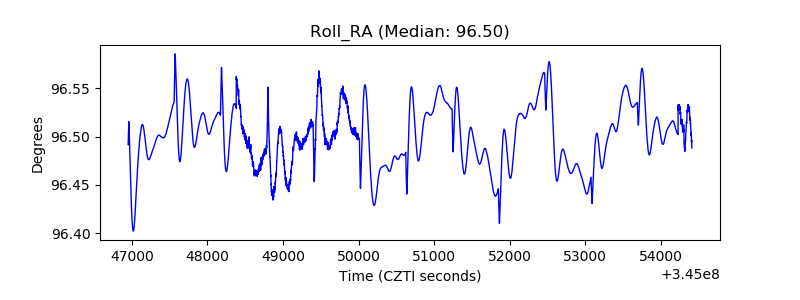 |
| Veto Counter | 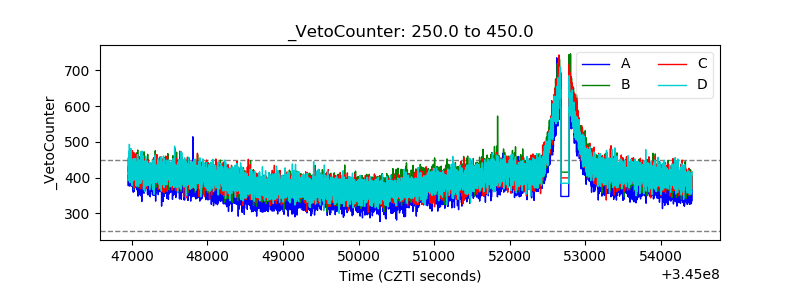 |