| Param | Original file | Final file |
|---|---|---|
| Filename | modeM0/AS1A10_073T01_9000004056_28087cztM0_level2.evt | modeM0/AS1A10_073T01_9000004056_28087cztM0_level2_quad_clean.evt |
| Size (bytes) | 643,253,760 | 142,223,040 |
| Size | 613.5 MB | 135.6 MB |
| Events in quadrant A | 3,606,348 | 999,867 |
| Events in quadrant B | 3,647,082 | 983,594 |
| Events in quadrant C | 5,337,035 | 902,132 |
| Events in quadrant D | 6,377,639 | 894,935 |
| Mode M9 | |||
|---|---|---|---|
| Quadrant | BADHDUFLAG | Total packets | Discarded packets |
| A | 0 | 3 | 0 |
| B | 0 | 4 | 0 |
| C | 0 | 4 | 0 |
| D | 0 | 4 | 0 |
| Mode M0 | |||
|---|---|---|---|
| Quadrant | BADHDUFLAG | Total packets | Discarded packets |
| A | 0 | 15636 | 0 |
| B | 0 | 15795 | 0 |
| C | 0 | 20929 | 0 |
| D | 0 | 24195 | 0 |
| Quadrant | Total seconds | Saturated seconds | Saturation percentage |
|---|---|---|---|
| A | 7571 | 63 | 0.832123% |
| B | 7571 | 101 | 1.334038% |
| C | 7571 | 623 | 8.228768% |
| D | 7571 | 706 | 9.325056% |
Noise dominated data is calculated using 1-second bins in cleaned event files. If a bin has >2000 counts, and if more than 50% of those come from <1% of pixels, then it is considered to be noise-dominated and hence unusable.
| Quadrant | # 1 sec bins | Bins with >0 counts | Bins with >2000 counts | High rate bins dominated by noise | Noise dominated (total time) | Noise dominated (detector-on time) | Marked lightcurve |
|---|---|---|---|---|---|---|---|
| A | 7921 | 7572 | 0 | 0 | 0.00% | 0.00% | 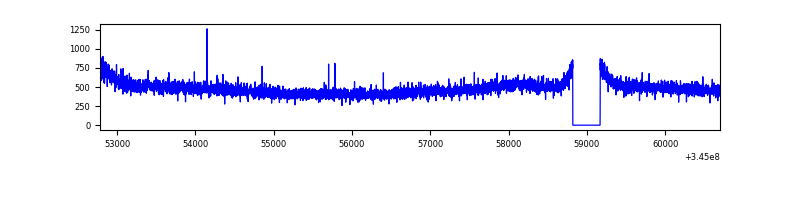 |
| B | 7921 | 7572 | 0 | 0 | 0.00% | 0.00% | 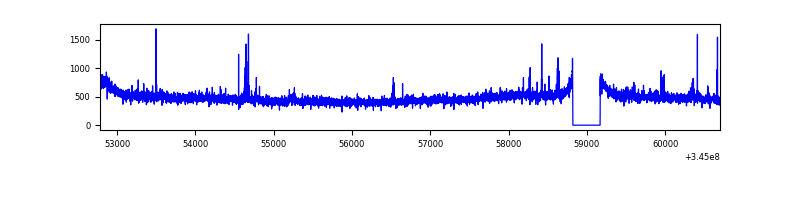 |
| C | 7921 | 7572 | 127 | 127 | 1.60% | 1.68% | 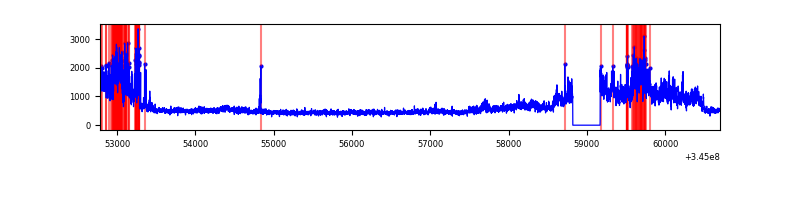 |
| D | 7921 | 7571 | 504 | 504 | 6.36% | 6.66% | 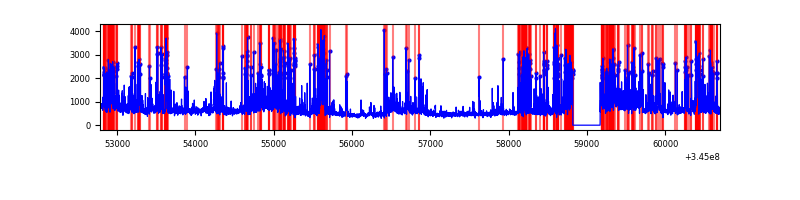 |
Top three noisy pixels from each quadrant. If the there are fewer than three noisy pixels in the level2.evt file, extra rows are filled as -1
| Pixel properties | Quadrant properties | ||||||
|---|---|---|---|---|---|---|---|
| Quadrant | DetID | PixID | Counts | Sigma | Mean | Median | Sigma |
| A | 0 | 13 | 42351 | 222.97 | 924 | 903 | 185.9 |
| A | 13 | 254 | 13165 | 65.96 | 924 | 903 | 185.9 |
| A | 3 | 137 | 8854 | 42.77 | 924 | 903 | 185.9 |
| B | 12 | 111 | 20946 | 116.76 | 908 | 885 | 171.8 |
| B | 11 | 111 | 18941 | 105.09 | 908 | 885 | 171.8 |
| B | 0 | 230 | 18316 | 101.45 | 908 | 885 | 171.8 |
| C | 3 | 233 | 1841279 | 9164.39 | 853 | 855 | 200.8 |
| C | 14 | 238 | 136550 | 675.69 | 853 | 855 | 200.8 |
| C | 2 | 16 | 16151 | 76.16 | 853 | 855 | 200.8 |
| D | 12 | 1 | 1120568 | 5510.9 | 855 | 829 | 203.2 |
| D | 8 | 195 | 885262 | 4352.82 | 855 | 829 | 203.2 |
| D | 1 | 52 | 446727 | 2194.53 | 855 | 829 | 203.2 |
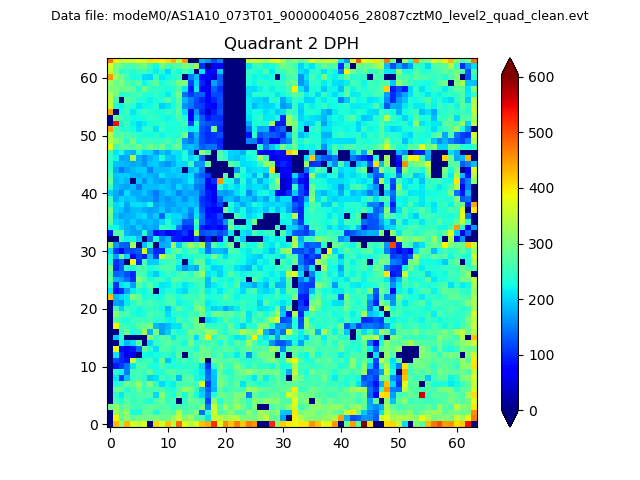
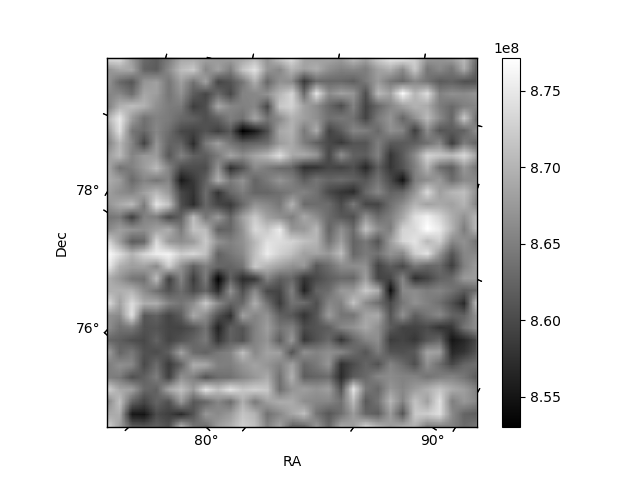
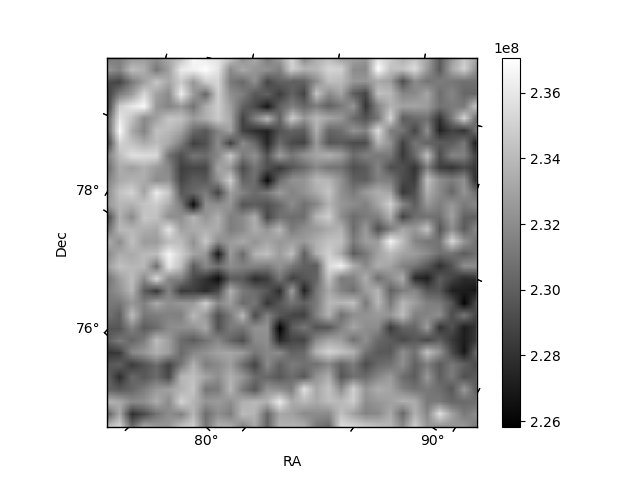
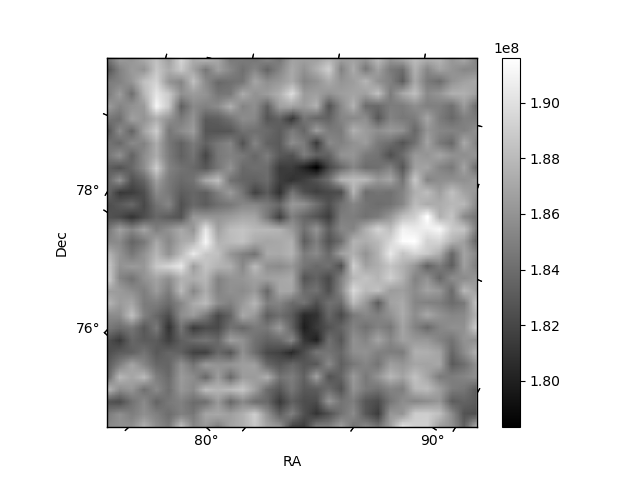
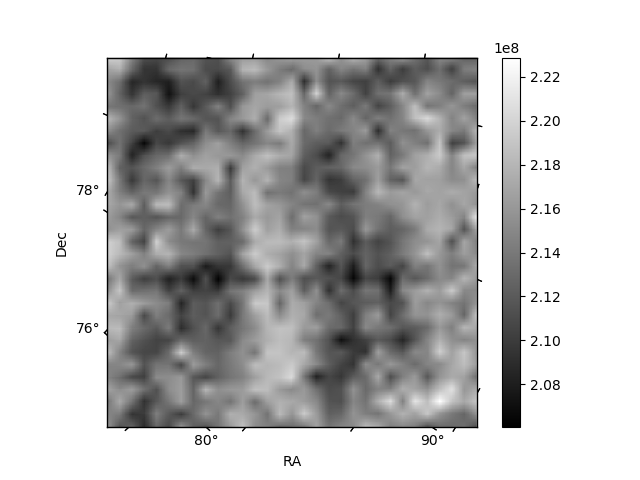
Histogram calculated using DETX and DETY for each event in the final _common_clean file
| Quadrant A | 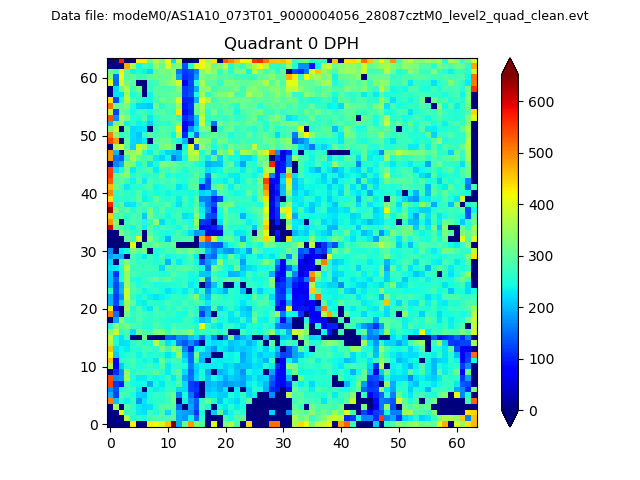 |
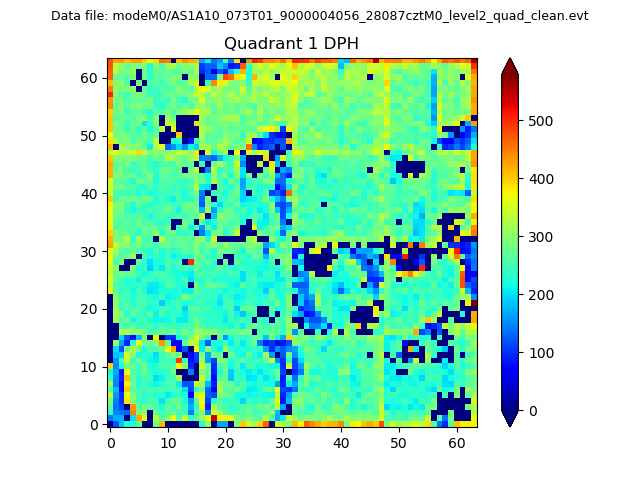 |
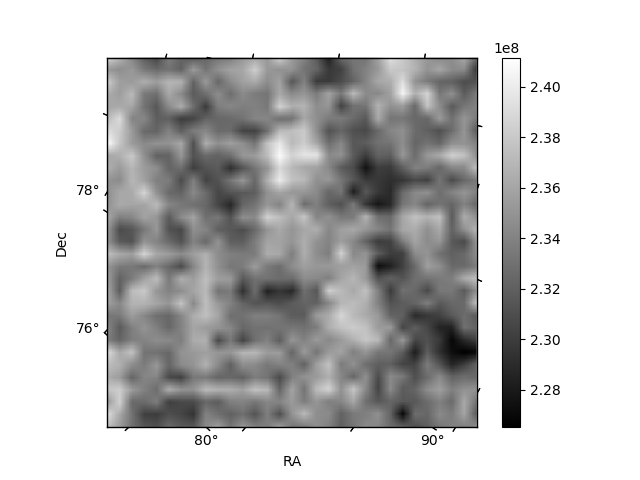
Quadrant B |
|---|---|---|---|
| Quadrant D | 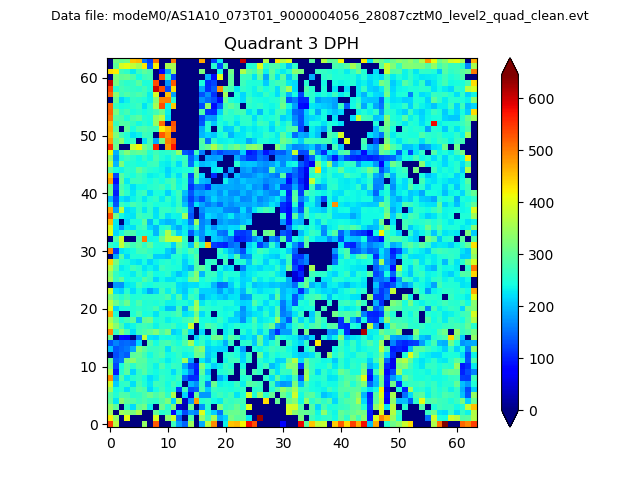 |
 |
Quadrant C |
| Plot type | Count rate plots | Images |
|---|---|---|
| Comparison with Poisson distribution Blue bars denote a histogram of data divided into 1 sec bins. Red curve is a Poisson curve with rate = median count rate of data. |
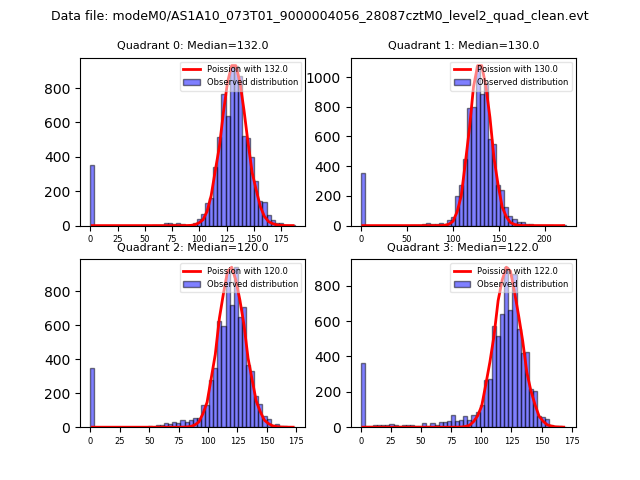 |
 |
| Quadrant-wise count rates Data is divided into 100 sec bins |
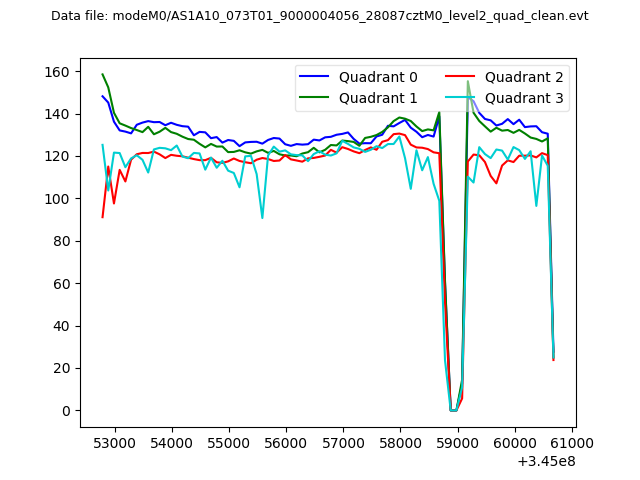 |
|
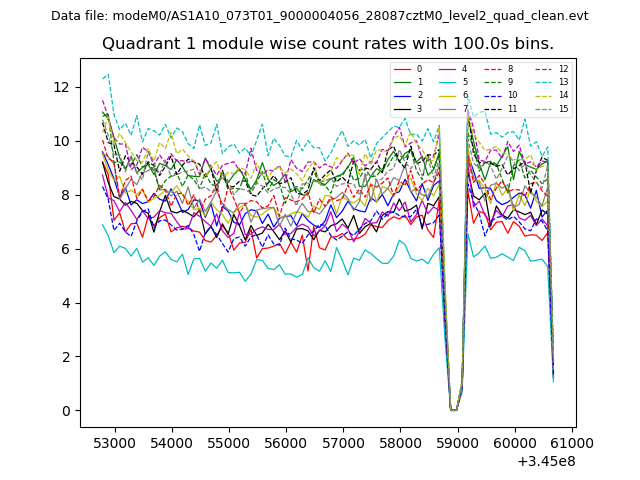
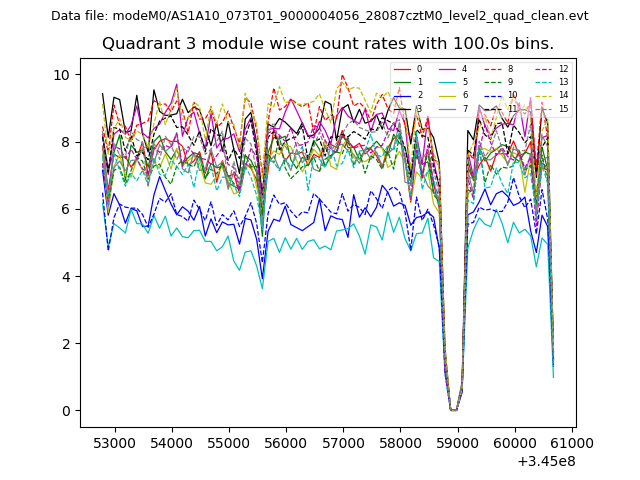
| Module-wise count rates for Quadrant A Data is divided into 100 sec bins |
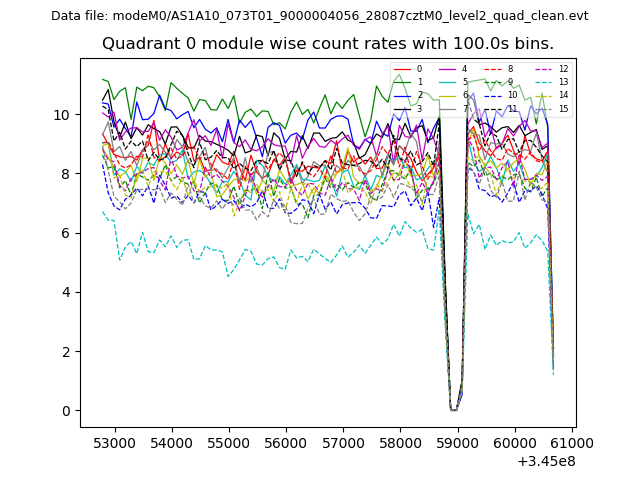 |
 |
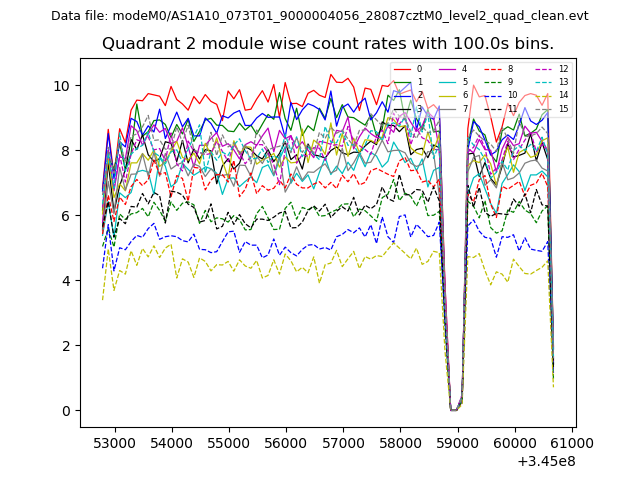
| Module-wise count rates for Quadrant B Data is divided into 100 sec bins |
 |
 |
| Module-wise count rates for Quadrant C Data is divided into 100 sec bins |
 |
 |
| Module-wise count rates for Quadrant D Data is divided into 100 sec bins |
 |
 |
| Parameter | Plot |
|---|---|
| CZT HV Monitor | 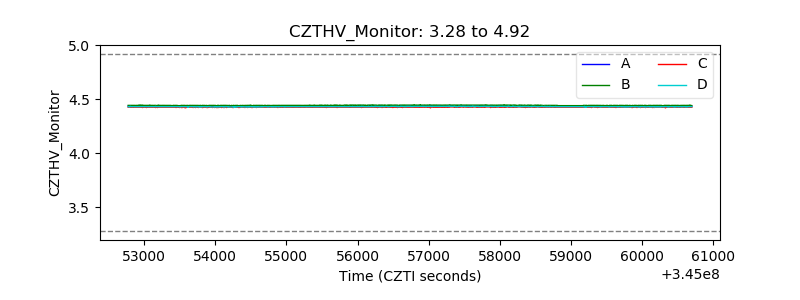 |
| D_VDD | 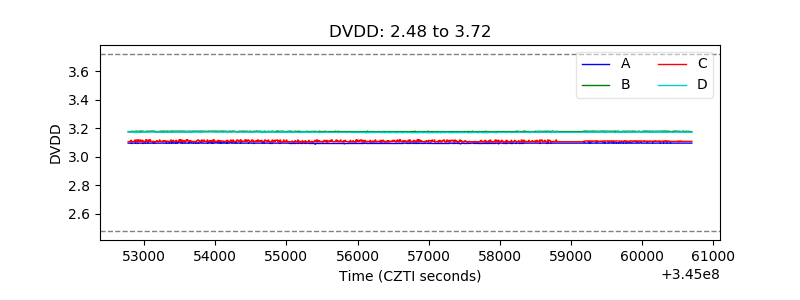 |
| Temperature 1 | 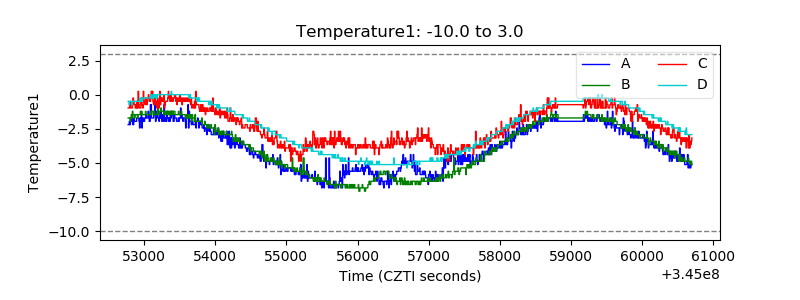 |
| Veto HV Monitor | 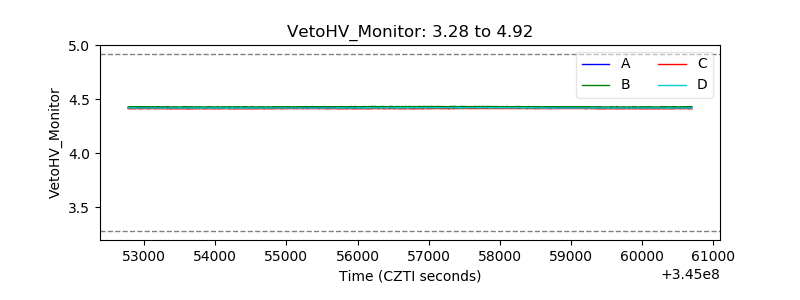 |
| Veto LLD | 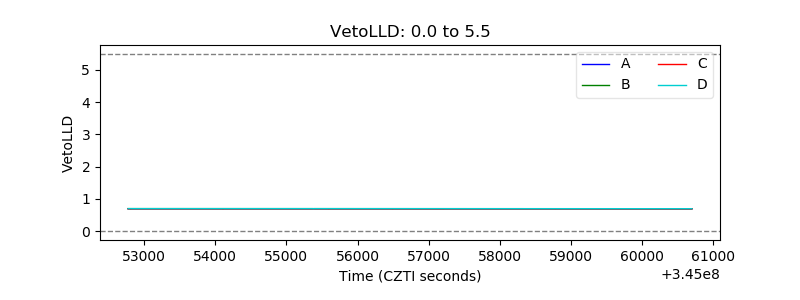 |
| Alpha Counter | 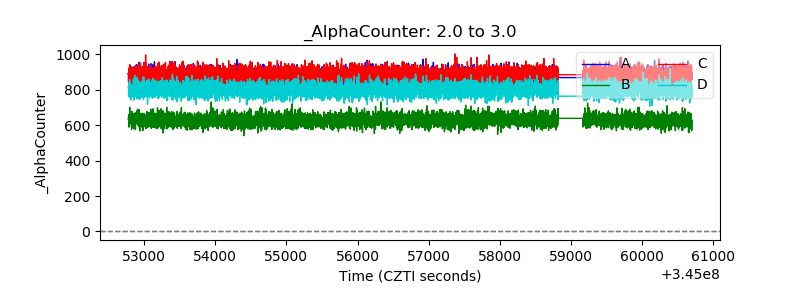 |
| _CPM_Rate | 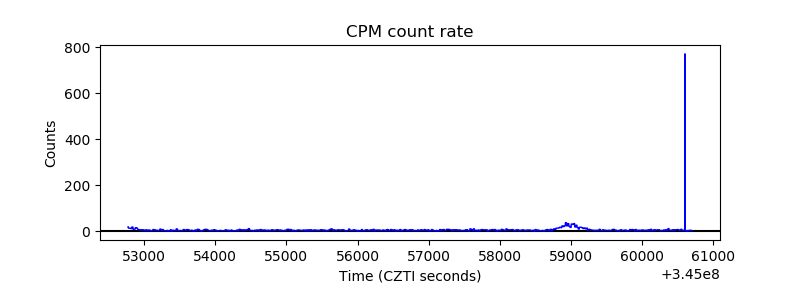 |
| CZT Counter | 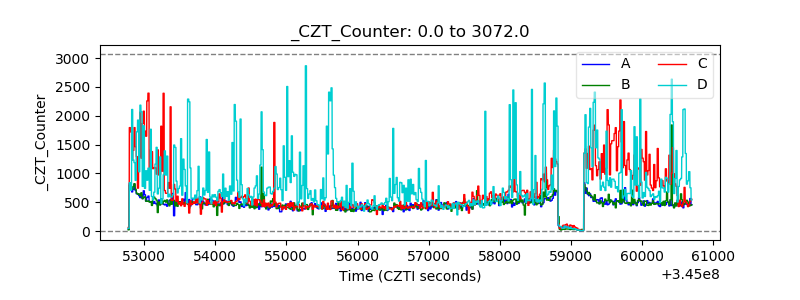 |
| +2.5 Volts monitor |  |
| +5 Volts monitor |  |
| _ROLL_ROT | 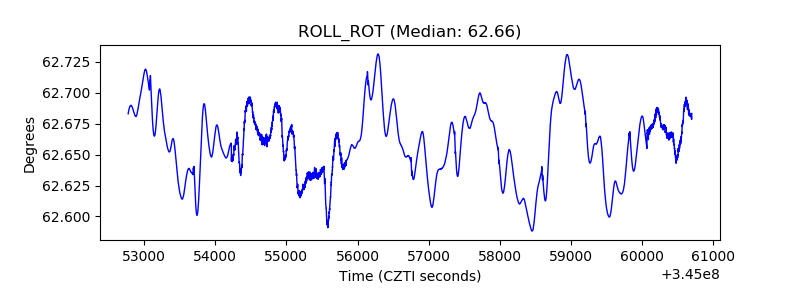 |
| _Roll_DEC | 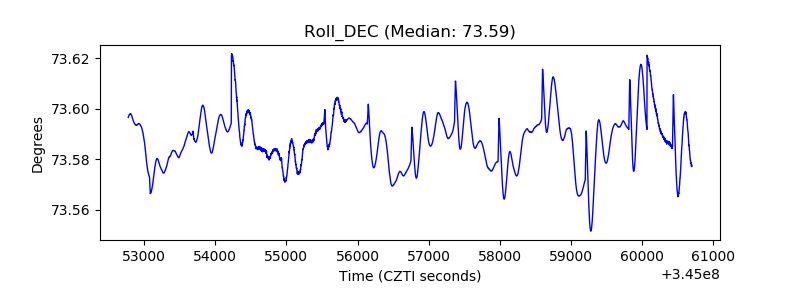 |
| _Roll_RA | 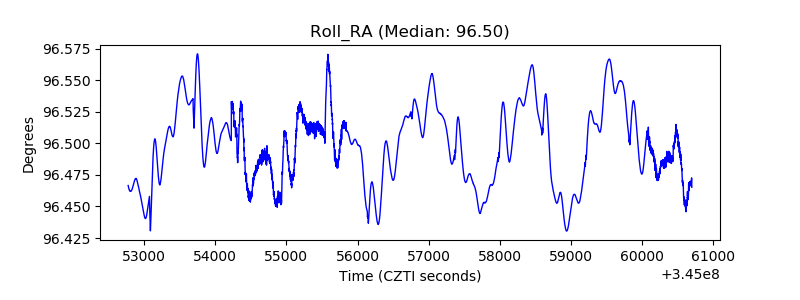 |
| Veto Counter | 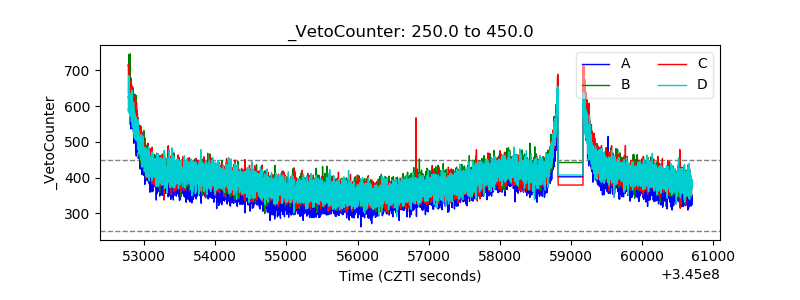 |