| Param | Original file | Final file |
|---|---|---|
| Filename | modeM0/AS1A10_073T01_9000004056_28089cztM0_level2.evt | modeM0/AS1A10_073T01_9000004056_28089cztM0_level2_quad_clean.evt |
| Size (bytes) | 568,811,520 | 124,367,040 |
| Size | 542.5 MB | 118.6 MB |
| Events in quadrant A | 3,266,867 | 869,900 |
| Events in quadrant B | 3,172,881 | 858,529 |
| Events in quadrant C | 4,333,215 | 808,879 |
| Events in quadrant D | 5,999,705 | 762,330 |
| Mode M9 | |||
|---|---|---|---|
| Quadrant | BADHDUFLAG | Total packets | Discarded packets |
| A | 0 | 5 | 0 |
| B | 0 | 5 | 0 |
| C | 0 | 5 | 0 |
| D | 0 | 5 | 0 |
| Mode M0 | |||
|---|---|---|---|
| Quadrant | BADHDUFLAG | Total packets | Discarded packets |
| A | 0 | 14081 | 0 |
| B | 0 | 13875 | 0 |
| C | 0 | 17280 | 0 |
| D | 0 | 22565 | 0 |
| Quadrant | Total seconds | Saturated seconds | Saturation percentage |
|---|---|---|---|
| A | 6686 | 90 | 1.346096% |
| B | 6687 | 57 | 0.852400% |
| C | 6687 | 312 | 4.665769% |
| D | 6687 | 873 | 13.055182% |
Noise dominated data is calculated using 1-second bins in cleaned event files. If a bin has >2000 counts, and if more than 50% of those come from <1% of pixels, then it is considered to be noise-dominated and hence unusable.
| Quadrant | # 1 sec bins | Bins with >0 counts | Bins with >2000 counts | High rate bins dominated by noise | Noise dominated (total time) | Noise dominated (detector-on time) | Marked lightcurve |
|---|---|---|---|---|---|---|---|
| A | 7231 | 6687 | 49 | 49 | 0.68% | 0.73% | 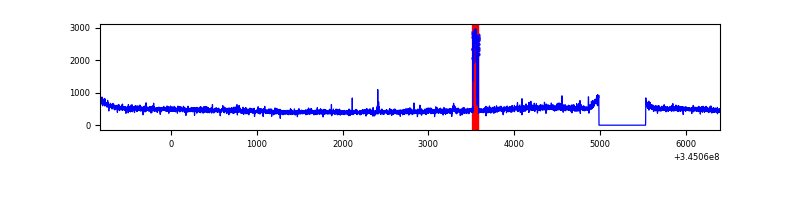 |
| B | 7232 | 6688 | 2 | 2 | 0.03% | 0.03% | 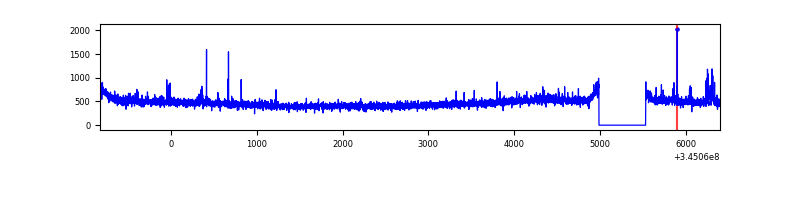 |
| C | 7232 | 6688 | 44 | 44 | 0.61% | 0.66% | 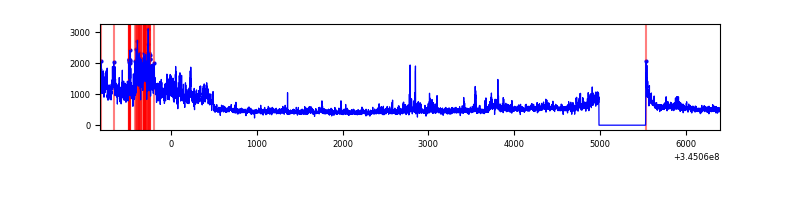 |
| D | 7232 | 6687 | 653 | 653 | 9.03% | 9.77% | 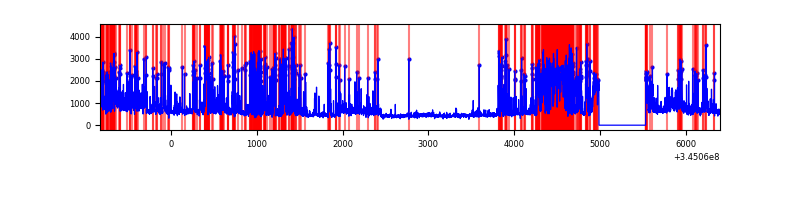 |
Top three noisy pixels from each quadrant. If the there are fewer than three noisy pixels in the level2.evt file, extra rows are filled as -1
| Pixel properties | Quadrant properties | ||||||
|---|---|---|---|---|---|---|---|
| Quadrant | DetID | PixID | Counts | Sigma | Mean | Median | Sigma |
| A | 13 | 170 | 136630 | 837.81 | 801 | 783 | 162.1 |
| A | 0 | 13 | 26380 | 157.86 | 801 | 783 | 162.1 |
| A | 12 | 96 | 11155 | 63.97 | 801 | 783 | 162.1 |
| B | 15 | 32 | 21941 | 140.41 | 791 | 770 | 150.8 |
| B | 4 | 200 | 20649 | 131.84 | 791 | 770 | 150.8 |
| B | 12 | 111 | 18578 | 118.11 | 791 | 770 | 150.8 |
| C | 3 | 233 | 1258391 | 7057.37 | 758 | 760 | 178.2 |
| C | 14 | 238 | 121904 | 679.82 | 758 | 760 | 178.2 |
| C | 13 | 61 | 5281 | 25.37 | 758 | 760 | 178.2 |
| D | 12 | 1 | 1668166 | 9498.61 | 727 | 707 | 175.5 |
| D | 8 | 195 | 674305 | 3837.12 | 727 | 707 | 175.5 |
| D | 1 | 52 | 342253 | 1945.6 | 727 | 707 | 175.5 |
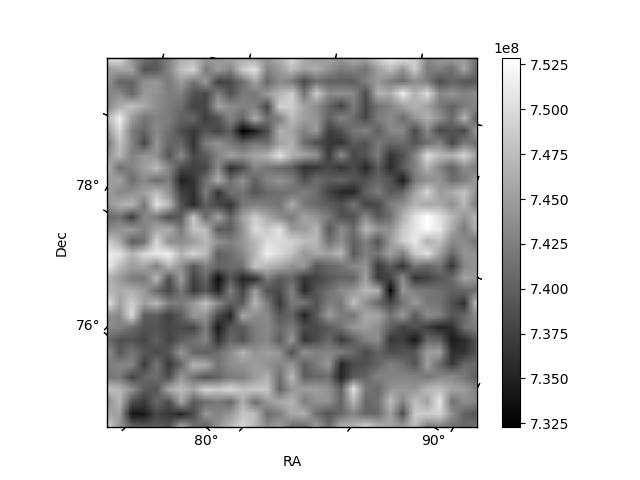
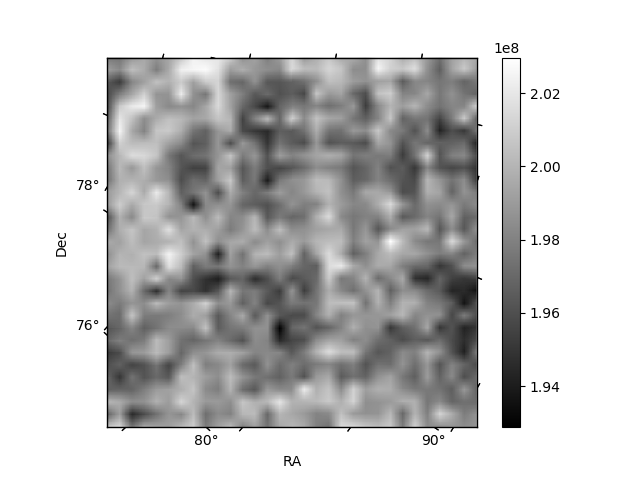
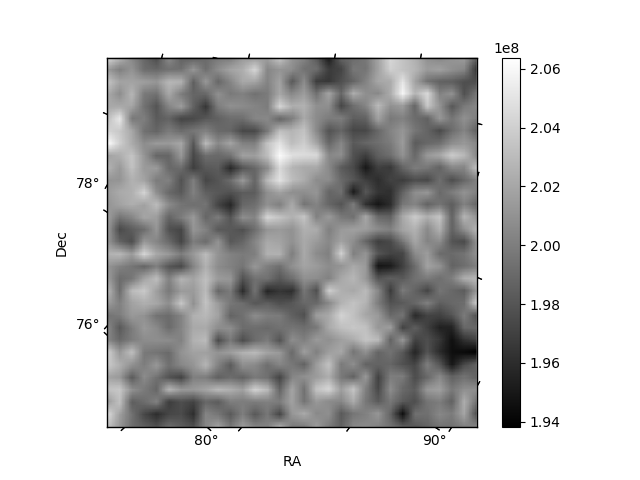
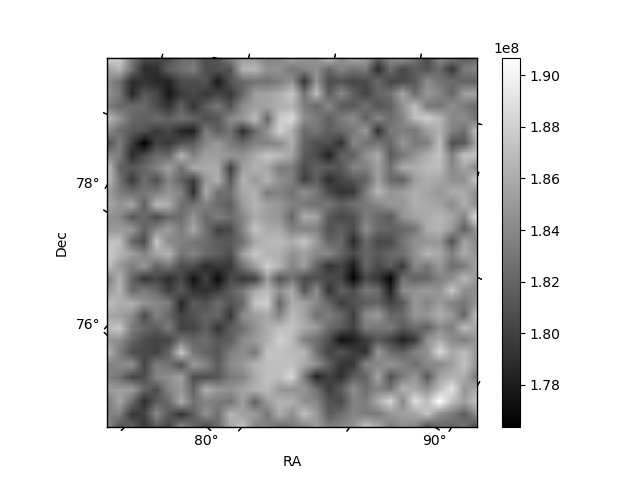
Histogram calculated using DETX and DETY for each event in the final _common_clean file
| Quadrant A | 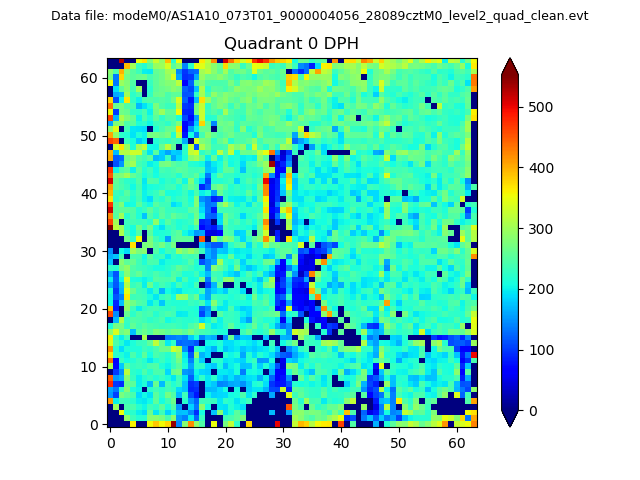 |
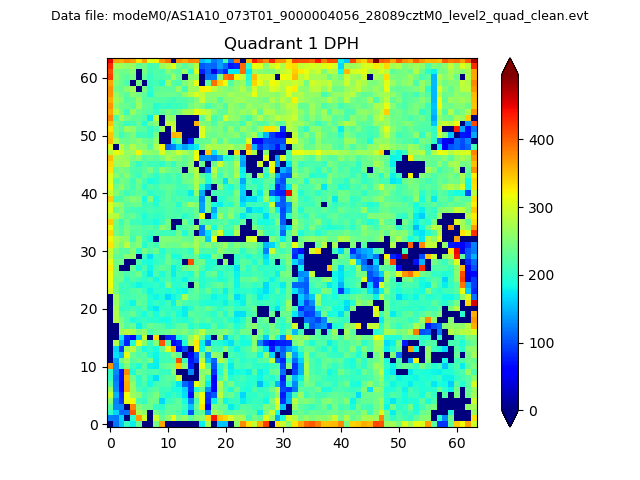 |
Quadrant B |
|---|---|---|---|
| Quadrant D |  |
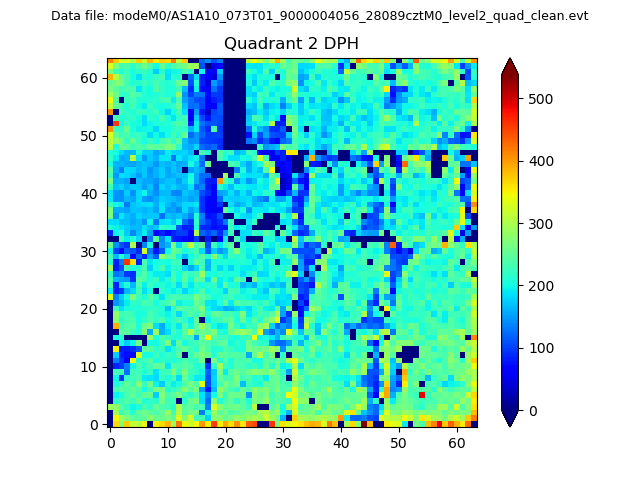 |
Quadrant C |
| Plot type | Count rate plots | Images |
|---|---|---|
| Comparison with Poisson distribution Blue bars denote a histogram of data divided into 1 sec bins. Red curve is a Poisson curve with rate = median count rate of data. |
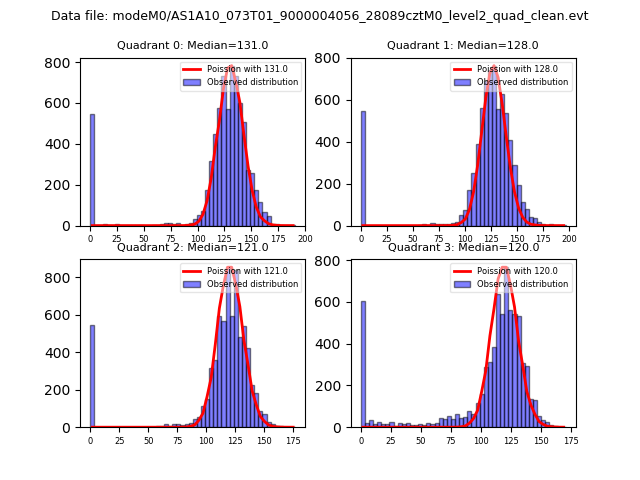 |
 |
| Quadrant-wise count rates Data is divided into 100 sec bins |
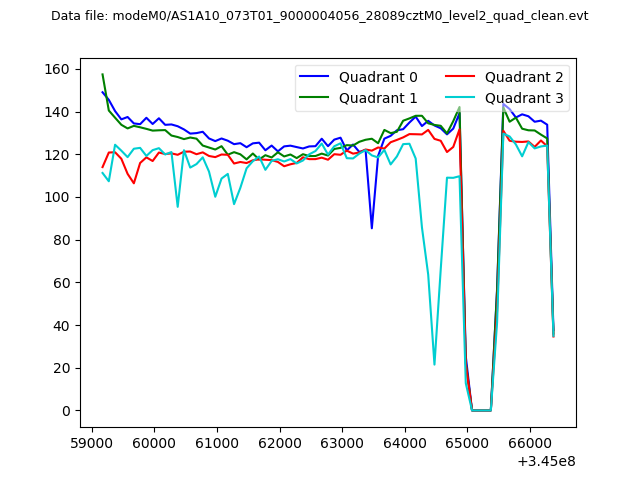 |
|
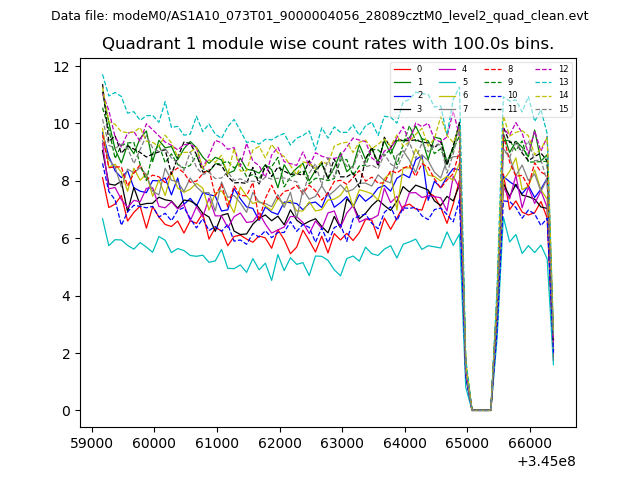
| Module-wise count rates for Quadrant A Data is divided into 100 sec bins |
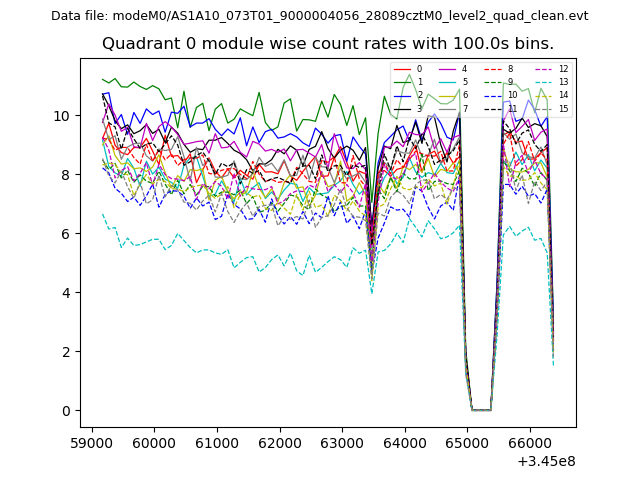 |
 |
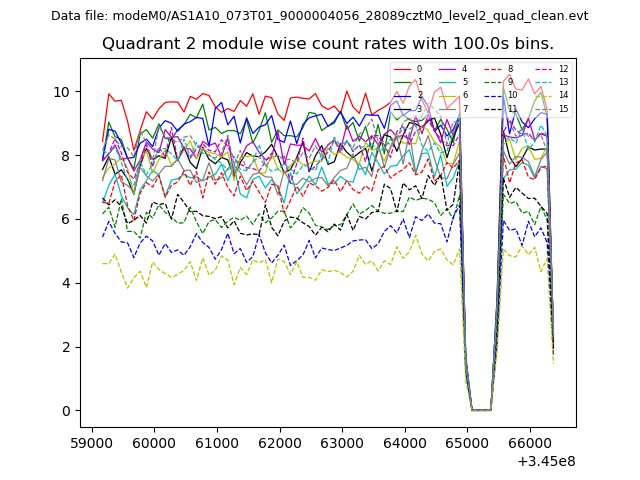
| Module-wise count rates for Quadrant B Data is divided into 100 sec bins |
 |
 |
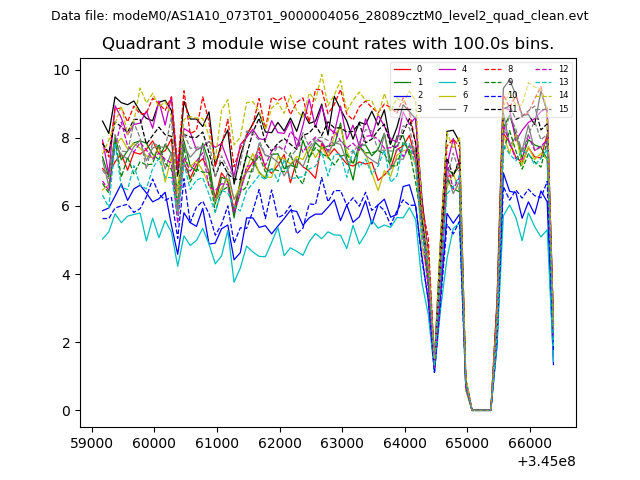
| Module-wise count rates for Quadrant C Data is divided into 100 sec bins |
 |
 |
| Module-wise count rates for Quadrant D Data is divided into 100 sec bins |
 |
 |
| Parameter | Plot |
|---|---|
| CZT HV Monitor | 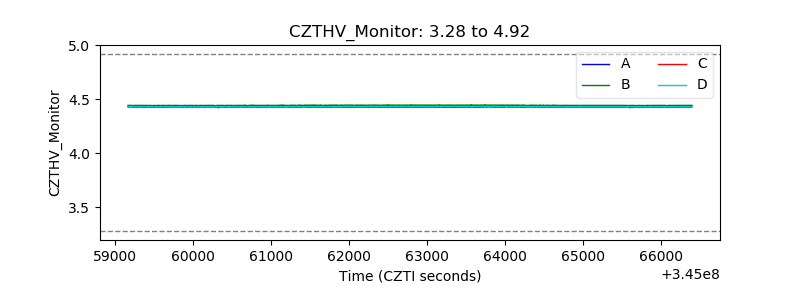 |
| D_VDD | 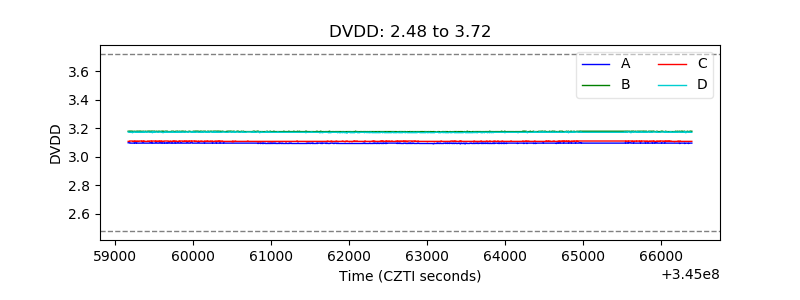 |
| Temperature 1 | 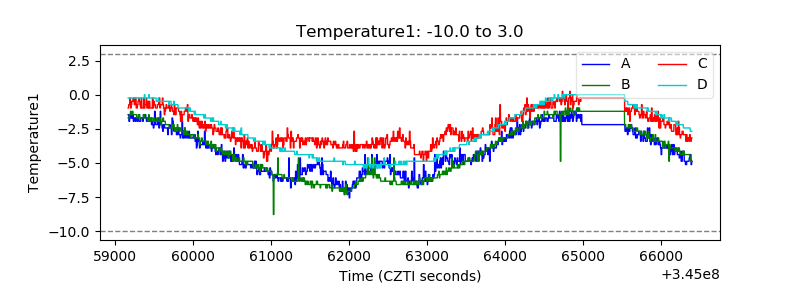 |
| Veto HV Monitor | 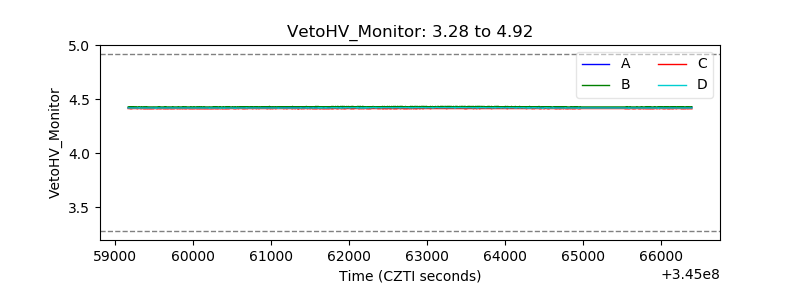 |
| Veto LLD | 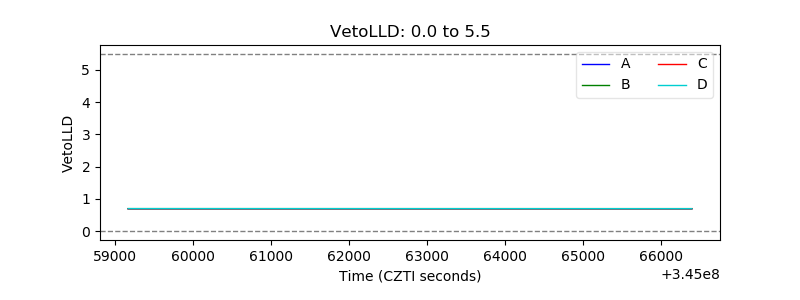 |
| Alpha Counter | 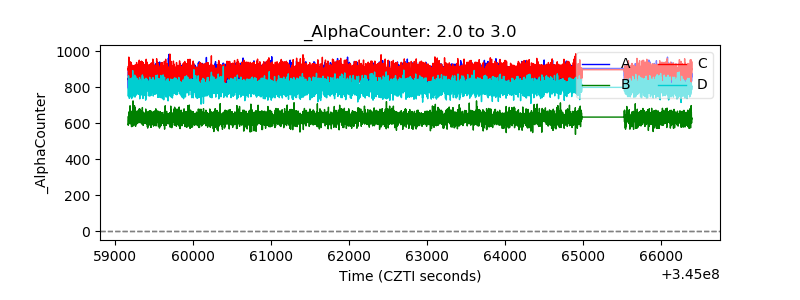 |
| _CPM_Rate | 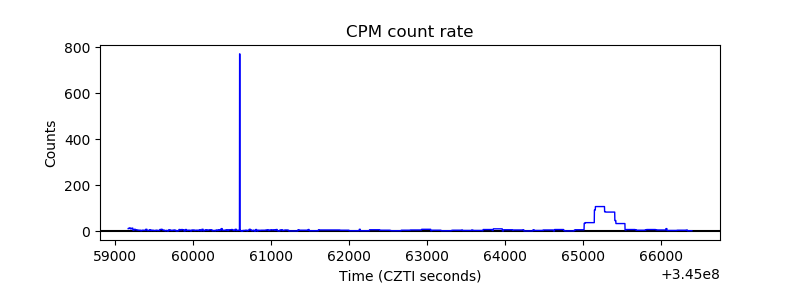 |
| CZT Counter |  |
| +2.5 Volts monitor |  |
| +5 Volts monitor |  |
| _ROLL_ROT | 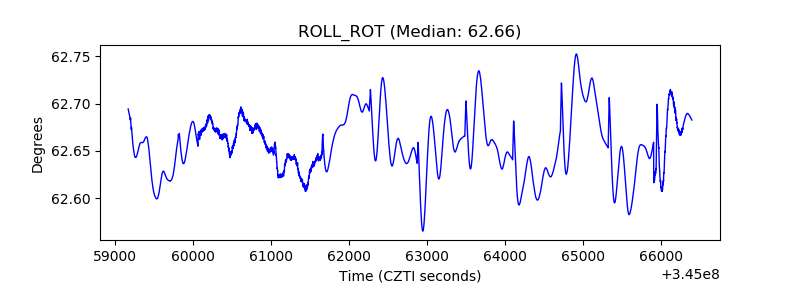 |
| _Roll_DEC | 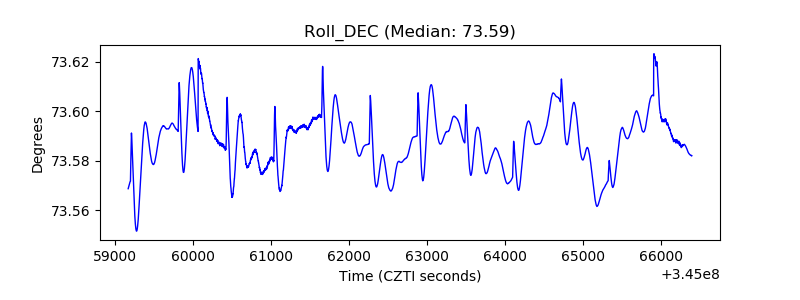 |
| _Roll_RA |  |
| Veto Counter | 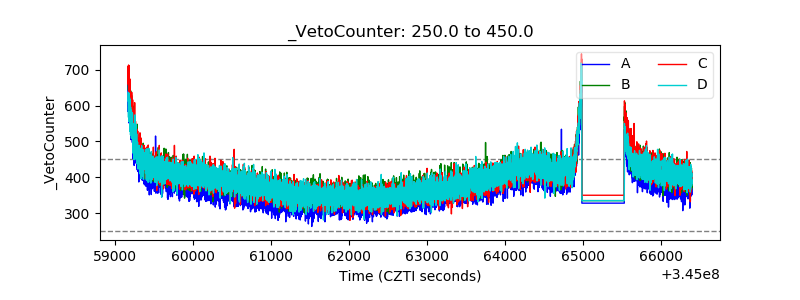 |