| Param | Original file | Final file |
|---|---|---|
| Filename | modeM0/AS1A10_073T04_9000004058cztM0_level2.fits | modeM0/AS1A10_073T04_9000004058cztM0_level2_quad_clean.evt |
| Size (bytes) | 135,262,080 | 177,099,840 |
| Size | 129.0 MB | 168.9 MB |
| Events in quadrant A | 829,924 | 1,168,881 |
| Events in quadrant B | 792,352 | 1,166,578 |
| Events in quadrant C | 801,530 | 1,099,889 |
| Events in quadrant D | 657,254 | 913,017 |
| Mode SS | |||
|---|---|---|---|
| Quadrant | BADHDUFLAG | Total packets | Discarded packets |
| A | 0 | 298 | 0 |
| B | 0 | 298 | 0 |
| C | 0 | 298 | 0 |
| D | 0 | 298 | 0 |
| Mode M0 | |||
|---|---|---|---|
| Quadrant | BADHDUFLAG | Total packets | Discarded packets |
| A | 0 | 30079 | 0 |
| B | 0 | 30035 | 0 |
| C | 0 | 31846 | 0 |
| D | 0 | 46600 | 0 |
| Mode M9 | |||
|---|---|---|---|
| Quadrant | BADHDUFLAG | Total packets | Discarded packets |
| A | 0 | 16 | 0 |
| B | 0 | 16 | 0 |
| C | 0 | 16 | 0 |
| D | 0 | 16 | 0 |
| Quadrant | Total seconds | Saturated seconds | Saturation percentage |
|---|---|---|---|
| A | 14702 | 75 | 0.510135% |
| B | 14702 | 36 | 0.244865% |
| C | 14702 | 169 | 1.149503% |
| D | 14702 | 1635 | 11.120936% |
Noise dominated data is calculated using 1-second bins in cleaned event files. If a bin has >2000 counts, and if more than 50% of those come from <1% of pixels, then it is considered to be noise-dominated and hence unusable.
| Quadrant | # 1 sec bins | Bins with >0 counts | Bins with >2000 counts | High rate bins dominated by noise | Noise dominated (total time) | Noise dominated (detector-on time) | Marked lightcurve |
|---|---|---|---|---|---|---|---|
| A | 16232 | 14702 | 0 | 0 | 0.00% | 0.00% |  |
| B | 16232 | 14702 | 0 | 0 | 0.00% | 0.00% |  |
| C | 16232 | 14702 | 0 | 0 | 0.00% | 0.00% | 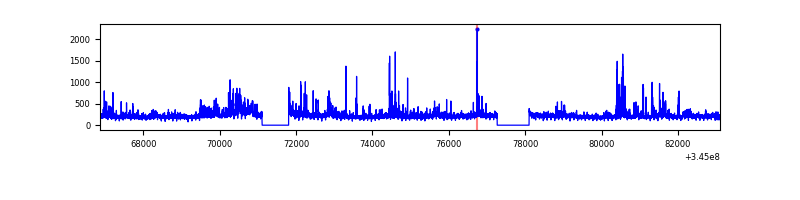 |
| D | 16232 | 14632 | 0 | 0 | 0.00% | 0.00% |  |
Top three noisy pixels from each quadrant. If the there are fewer than three noisy pixels in the level2.evt file, extra rows are filled as -1
| Pixel properties | Quadrant properties | ||||||
|---|---|---|---|---|---|---|---|
| Quadrant | DetID | PixID | Counts | Sigma | Mean | Median | Sigma |
| A | 0 | 29 | 691 | 8.63 | 216 | 203 | 56.5 |
| A | 7 | 110 | 645 | 7.82 | 216 | 203 | 56.5 |
| A | 9 | 19 | 627 | 7.5 | 216 | 203 | 56.5 |
| B | 2 | 9 | 619 | 9.65 | 209 | 200 | 43.4 |
| B | 5 | 232 | 553 | 8.13 | 209 | 200 | 43.4 |
| B | 3 | 80 | 527 | 7.53 | 209 | 200 | 43.4 |
| C | 1 | 81 | 643 | 8.08 | 211 | 197 | 55.2 |
| C | 1 | 80 | 638 | 7.99 | 211 | 197 | 55.2 |
| C | 1 | 65 | 560 | 6.57 | 211 | 197 | 55.2 |
| D | 6 | 231 | 484 | 5.96 | 188 | 171 | 52.6 |
| D | 10 | 189 | 475 | 5.78 | 188 | 171 | 52.6 |
| D | 6 | 67 | 471 | 5.71 | 188 | 171 | 52.6 |
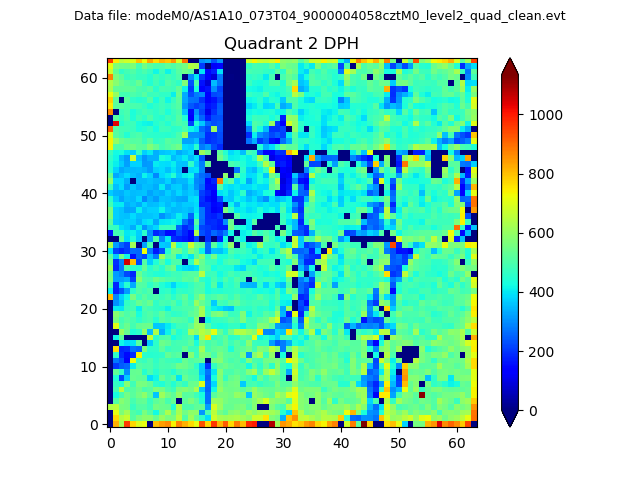
Histogram calculated using DETX and DETY for each event in the final _common_clean file
| Quadrant A |  |
 |
Quadrant B |
|---|---|---|---|
| Quadrant D | 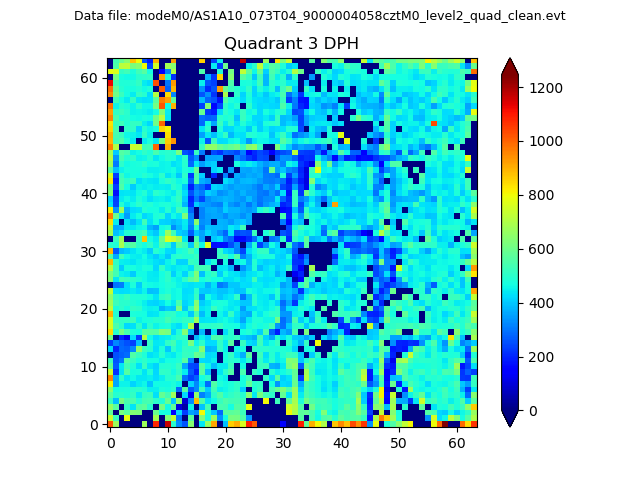 |
 |
Quadrant C |
| Plot type | Count rate plots | Images |
|---|---|---|
| Comparison with Poisson distribution Blue bars denote a histogram of data divided into 1 sec bins. Red curve is a Poisson curve with rate = median count rate of data. |
 |
 |
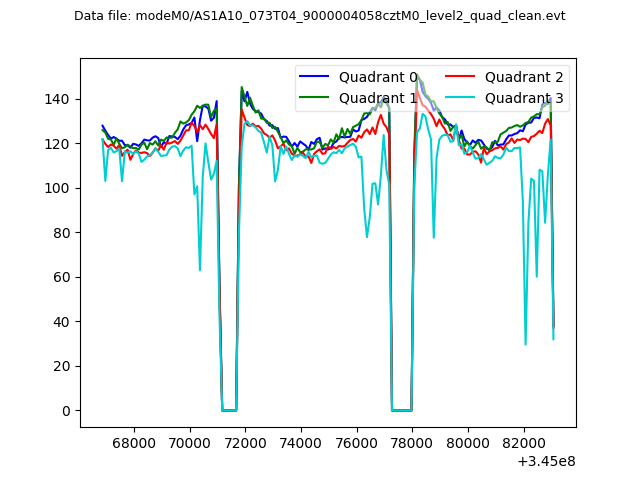
| Quadrant-wise count rates Data is divided into 100 sec bins |
 |
|
| Module-wise count rates for Quadrant A Data is divided into 100 sec bins |
 |
 |
| Module-wise count rates for Quadrant B Data is divided into 100 sec bins |
 |
 |
| Module-wise count rates for Quadrant C Data is divided into 100 sec bins |
 |
 |
| Module-wise count rates for Quadrant D Data is divided into 100 sec bins |
 |
 |
| Parameter | Plot |
|---|---|
| CZT HV Monitor |  |
| D_VDD | 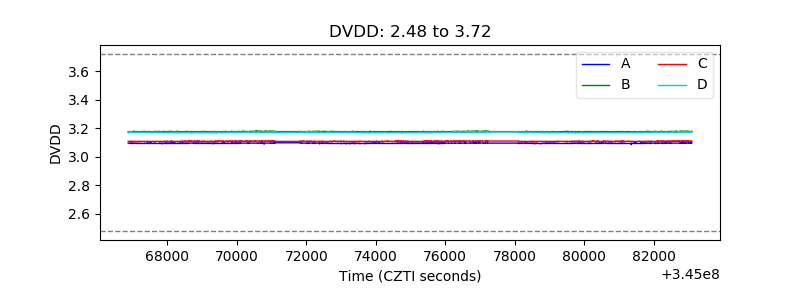 |
| Temperature 1 |  |
| Veto HV Monitor |  |
| Veto LLD |  |
| Alpha Counter |  |
| _CPM_Rate |  |
| CZT Counter |  |
| +2.5 Volts monitor | 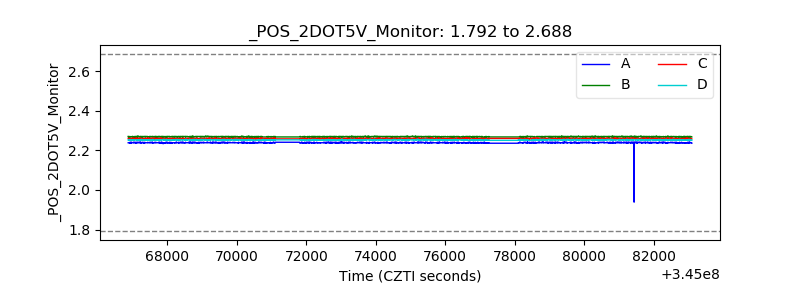 |
| +5 Volts monitor |  |
| _ROLL_ROT | 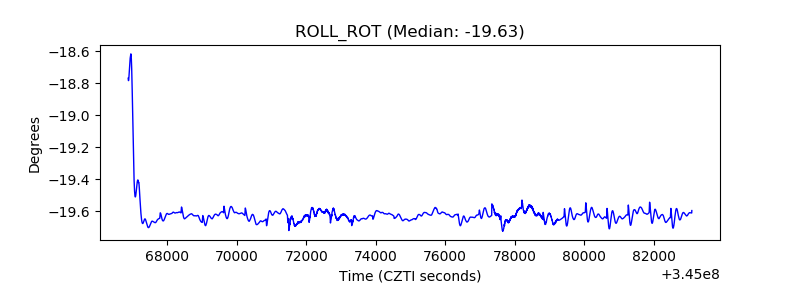 |
| _Roll_DEC |  |
| _Roll_RA | 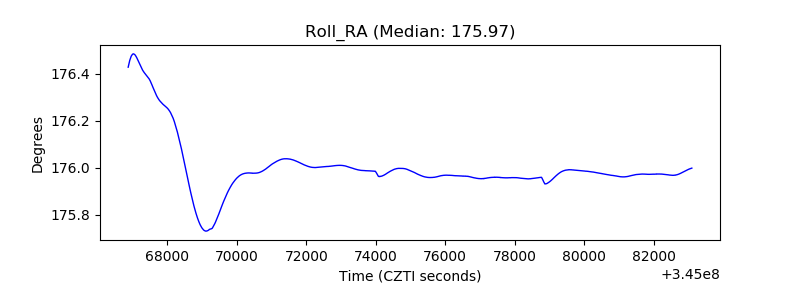 |
| Veto Counter |  |