| Param | Original file | Final file |
|---|---|---|
| Filename | modeM0/AS1A10_073T04_9000004058_28089cztM0_level2.evt | modeM0/AS1A10_073T04_9000004058_28089cztM0_level2_quad_clean.evt |
| Size (bytes) | 196,447,680 | 54,789,120 |
| Size | 187.3 MB | 52.3 MB |
| Events in quadrant A | 1,249,523 | 368,155 |
| Events in quadrant B | 1,258,259 | 367,536 |
| Events in quadrant C | 1,371,187 | 356,694 |
| Events in quadrant D | 1,862,110 | 350,517 |
| Mode M0 | |||
|---|---|---|---|
| Quadrant | BADHDUFLAG | Total packets | Discarded packets |
| A | 0 | 6068 | 0 |
| B | 0 | 6064 | 0 |
| C | 0 | 6208 | 0 |
| D | 0 | 7661 | 0 |
| Quadrant | Total seconds | Saturated seconds | Saturation percentage |
|---|---|---|---|
| A | 3027 | 1 | 0.033036% |
| B | 3027 | 2 | 0.066072% |
| C | 3027 | 5 | 0.165180% |
| D | 3027 | 58 | 1.916089% |
Noise dominated data is calculated using 1-second bins in cleaned event files. If a bin has >2000 counts, and if more than 50% of those come from <1% of pixels, then it is considered to be noise-dominated and hence unusable.
| Quadrant | # 1 sec bins | Bins with >0 counts | Bins with >2000 counts | High rate bins dominated by noise | Noise dominated (total time) | Noise dominated (detector-on time) | Marked lightcurve |
|---|---|---|---|---|---|---|---|
| A | 3027 | 3027 | 0 | 0 | 0.00% | 0.00% | 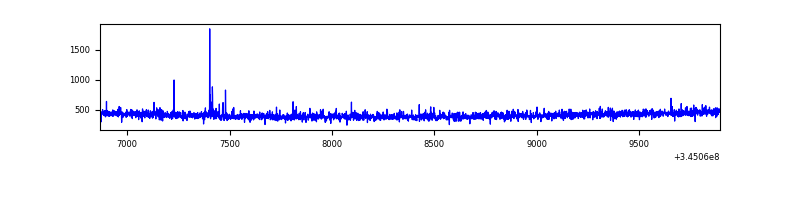 |
| B | 3027 | 3027 | 0 | 0 | 0.00% | 0.00% | 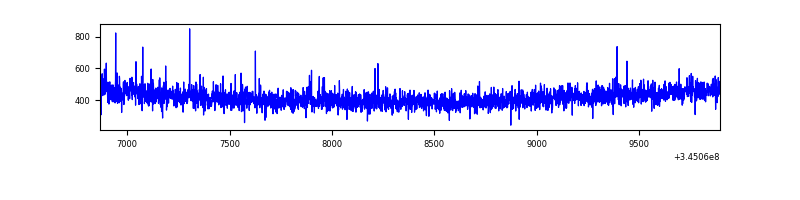 |
| C | 3027 | 3027 | 0 | 0 | 0.00% | 0.00% | 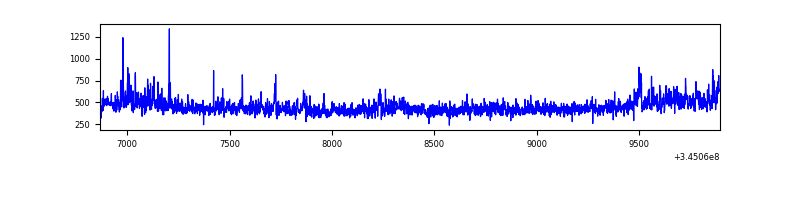 |
| D | 3027 | 3027 | 63 | 63 | 2.08% | 2.08% | 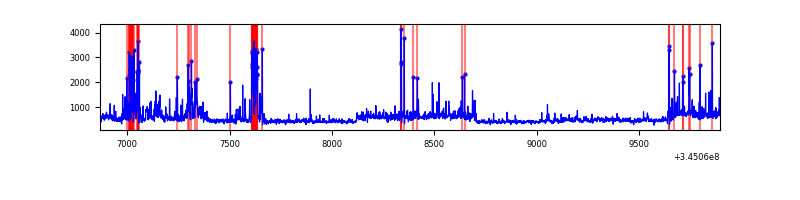 |
Top three noisy pixels from each quadrant. If the there are fewer than three noisy pixels in the level2.evt file, extra rows are filled as -1
| Pixel properties | Quadrant properties | ||||||
|---|---|---|---|---|---|---|---|
| Quadrant | DetID | PixID | Counts | Sigma | Mean | Median | Sigma |
| A | 12 | 96 | 9392 | 138.39 | 321 | 315 | 65.6 |
| A | 13 | 254 | 5205 | 74.55 | 321 | 315 | 65.6 |
| A | 3 | 137 | 3122 | 42.8 | 321 | 315 | 65.6 |
| B | 12 | 111 | 7465 | 114.21 | 320 | 313 | 62.6 |
| B | 11 | 111 | 6685 | 101.76 | 320 | 313 | 62.6 |
| B | 14 | 111 | 6221 | 94.35 | 320 | 313 | 62.6 |
| C | 3 | 233 | 123851 | 1685.88 | 307 | 309 | 73.3 |
| C | 14 | 238 | 50614 | 686.47 | 307 | 309 | 73.3 |
| C | 13 | 61 | 2138 | 24.96 | 307 | 309 | 73.3 |
| D | 8 | 195 | 363082 | 4893.08 | 304 | 296 | 74.1 |
| D | 12 | 1 | 183072 | 2465.19 | 304 | 296 | 74.1 |
| D | 1 | 52 | 79692 | 1070.85 | 304 | 296 | 74.1 |
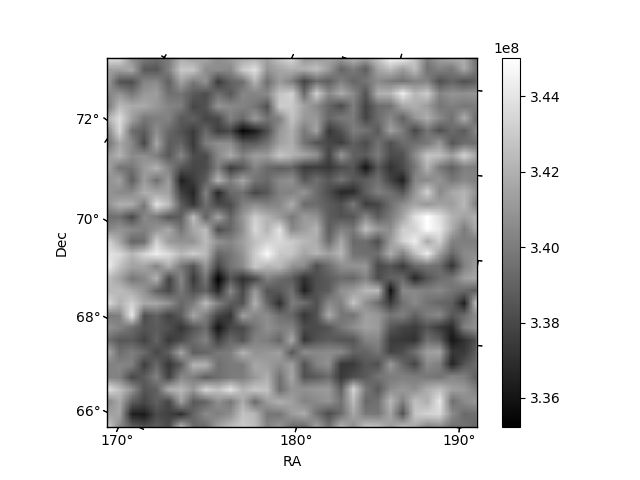
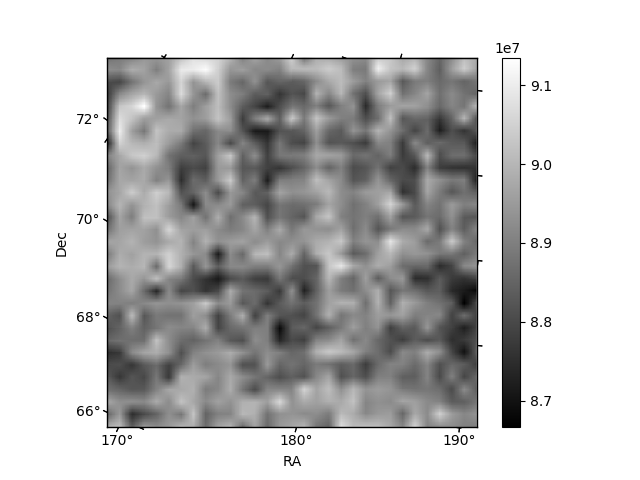
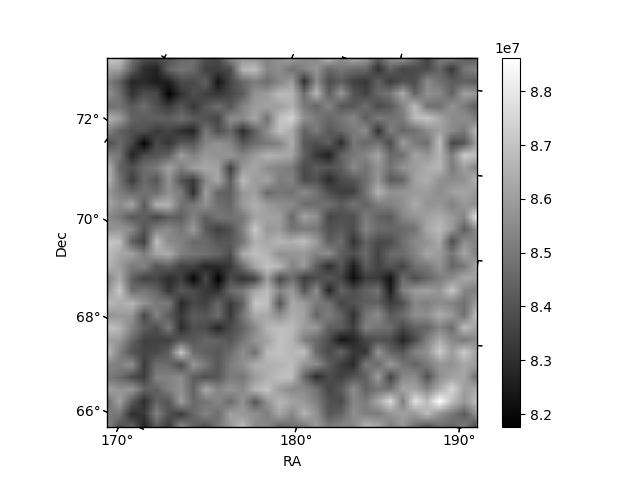
Histogram calculated using DETX and DETY for each event in the final _common_clean file
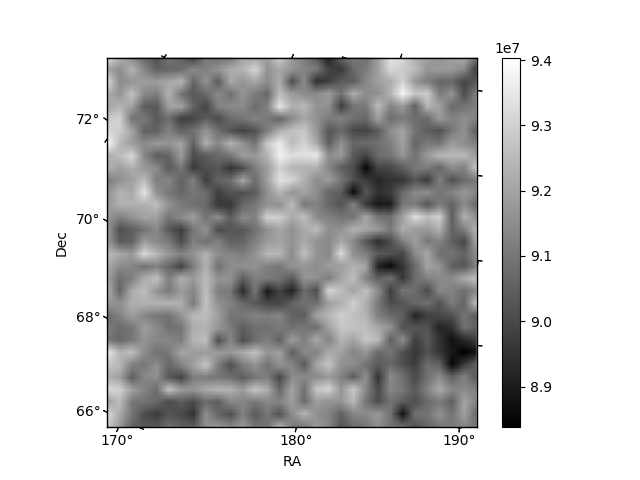
| Quadrant A | 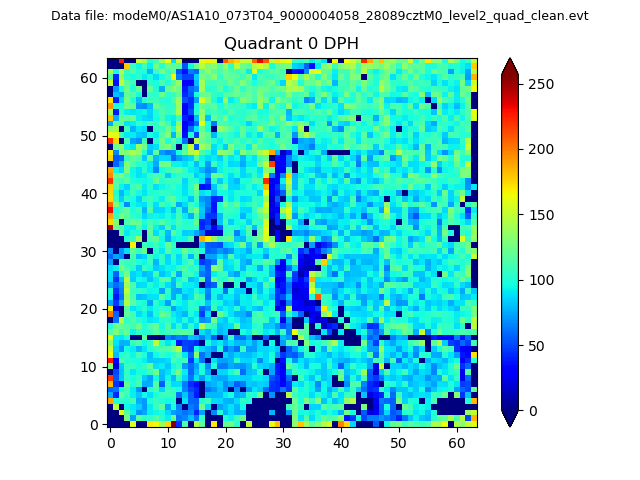 |
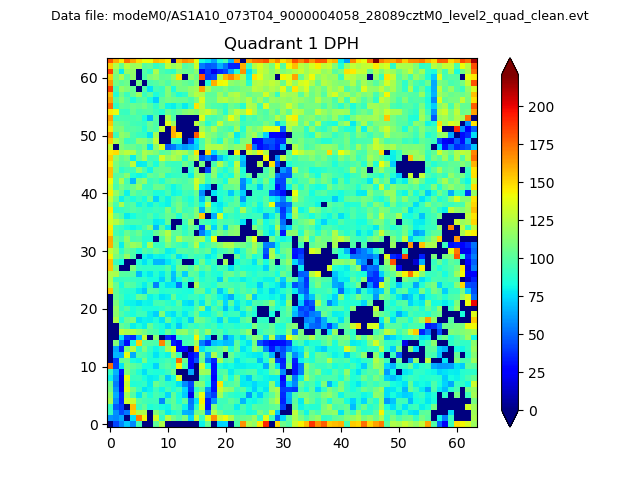 |
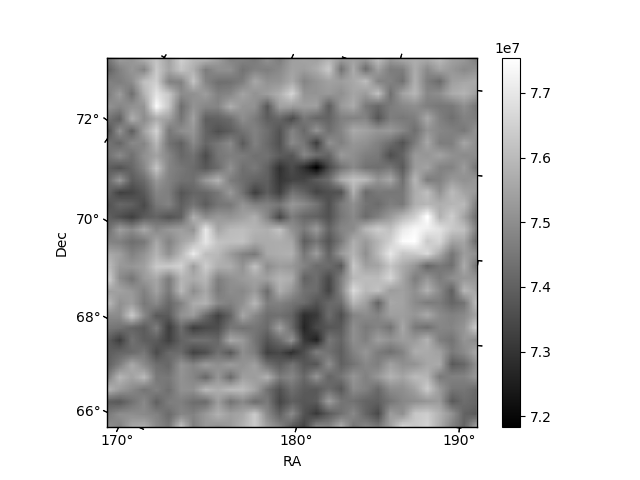
Quadrant B |
|---|---|---|---|
| Quadrant D |  |
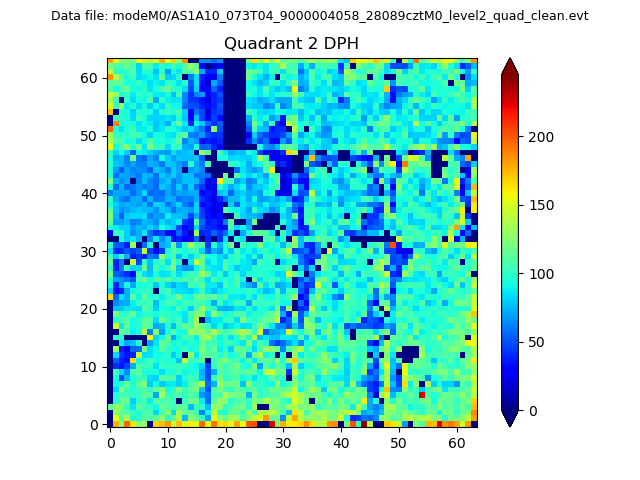 |
Quadrant C |
| Plot type | Count rate plots | Images |
|---|---|---|
| Comparison with Poisson distribution Blue bars denote a histogram of data divided into 1 sec bins. Red curve is a Poisson curve with rate = median count rate of data. |
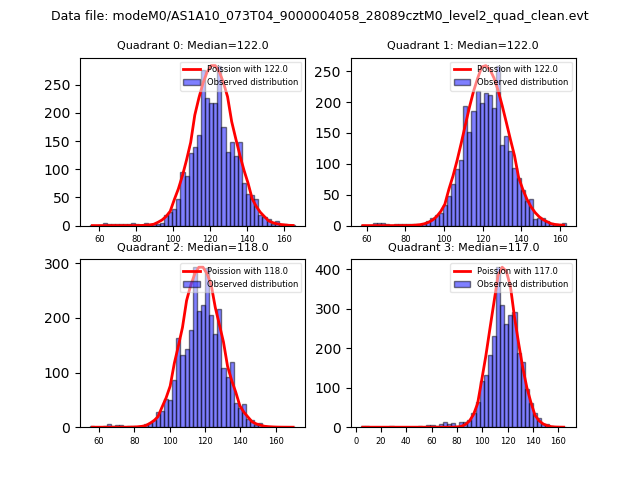 |
 |
| Quadrant-wise count rates Data is divided into 100 sec bins |
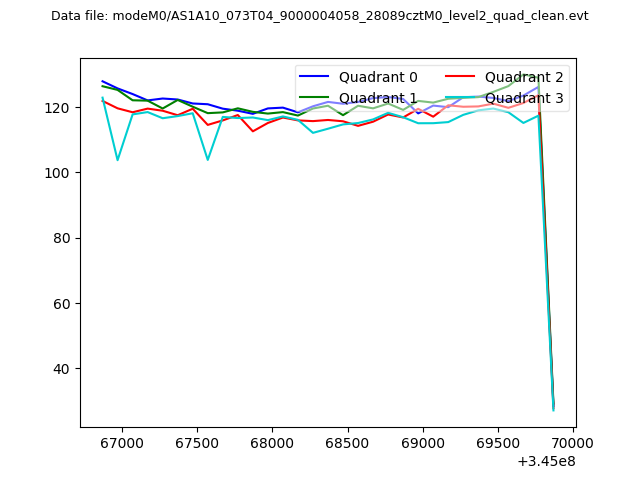 |
|
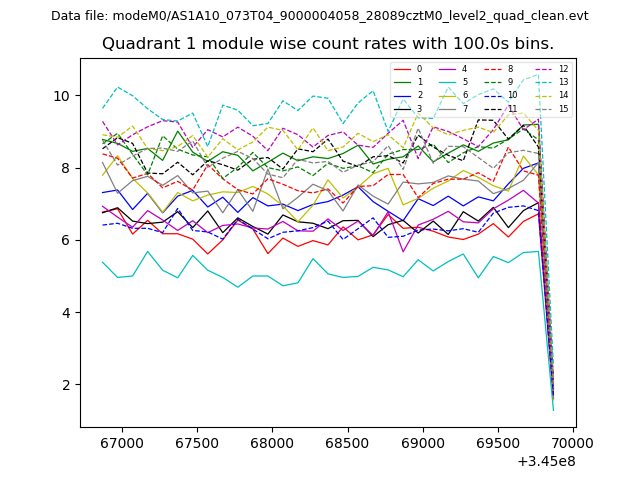
| Module-wise count rates for Quadrant A Data is divided into 100 sec bins |
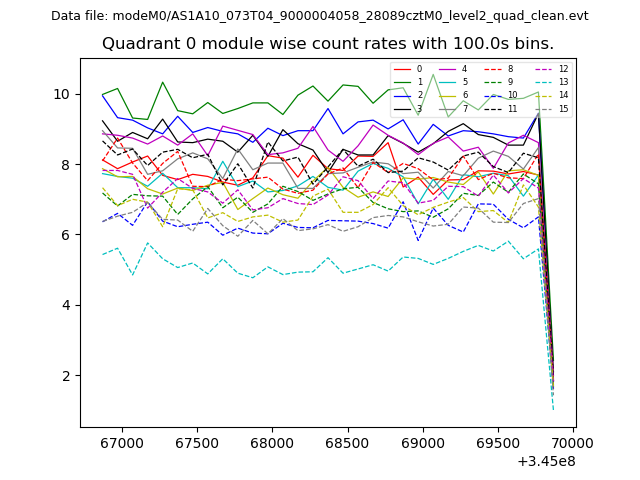 |
 |
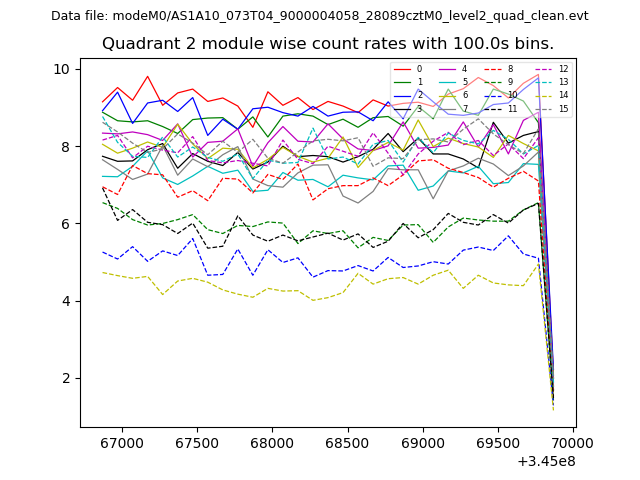
| Module-wise count rates for Quadrant B Data is divided into 100 sec bins |
 |
 |
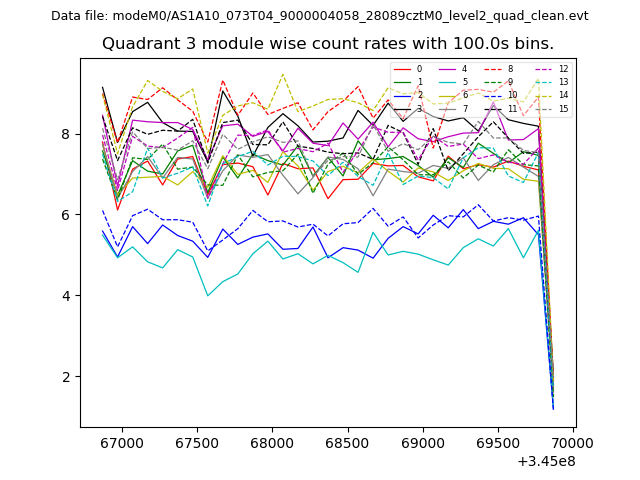
| Module-wise count rates for Quadrant C Data is divided into 100 sec bins |
 |
 |
| Module-wise count rates for Quadrant D Data is divided into 100 sec bins |
 |
 |
| Parameter | Plot |
|---|---|
| CZT HV Monitor | 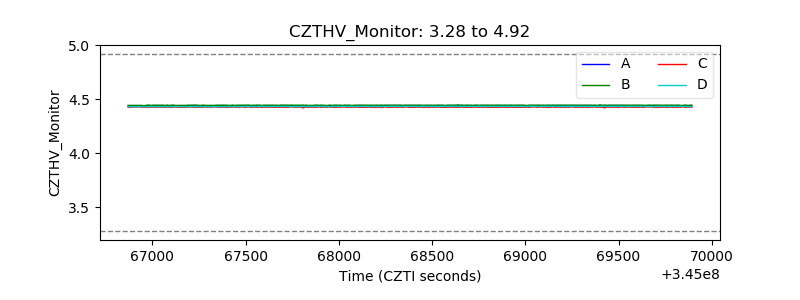 |
| D_VDD | 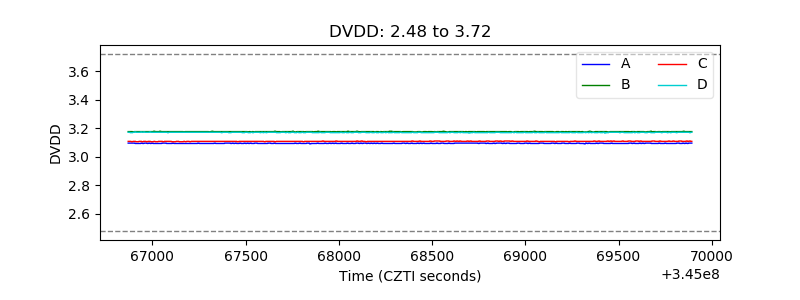 |
| Temperature 1 | 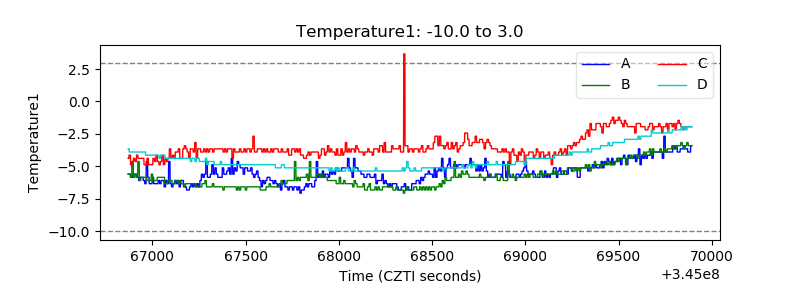 |
| Veto HV Monitor | 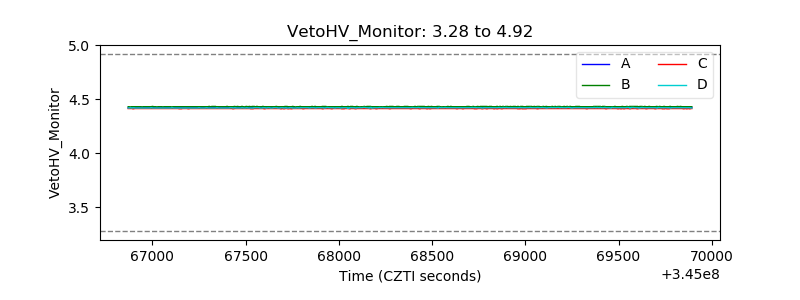 |
| Veto LLD | 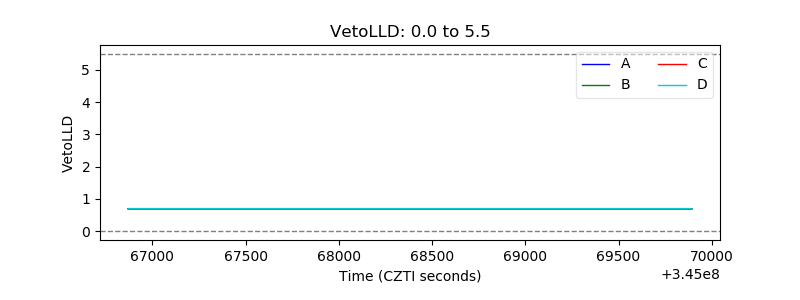 |
| Alpha Counter | 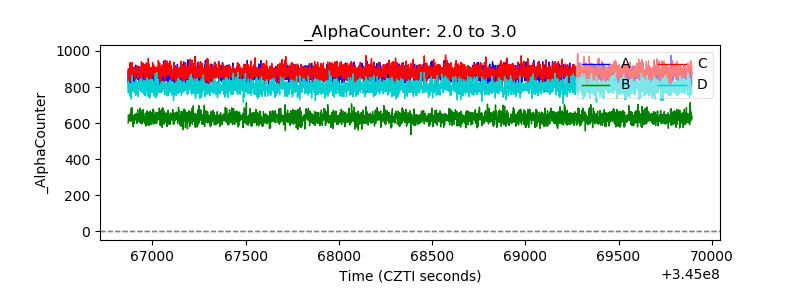 |
| _CPM_Rate | 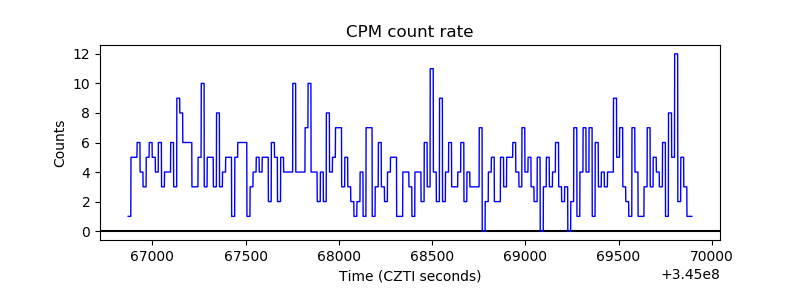 |
| CZT Counter | 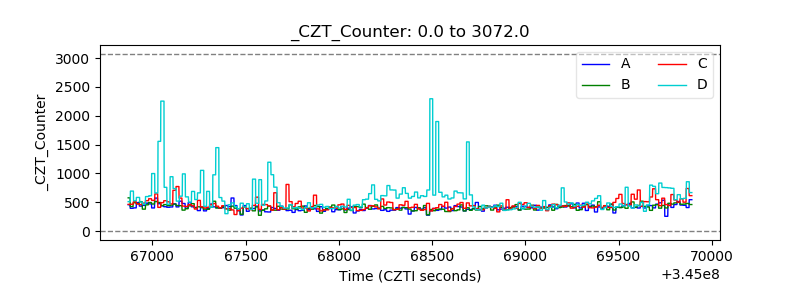 |
| +2.5 Volts monitor |  |
| +5 Volts monitor |  |
| _ROLL_ROT | 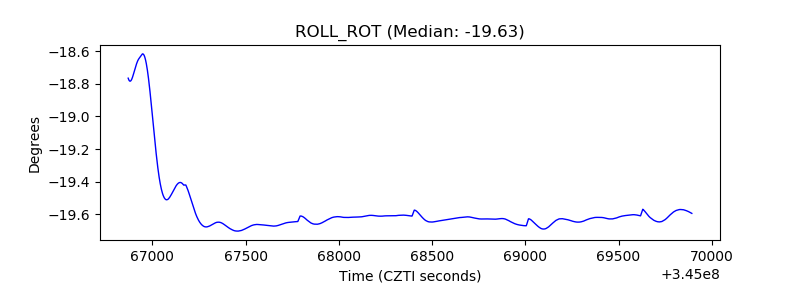 |
| _Roll_DEC | 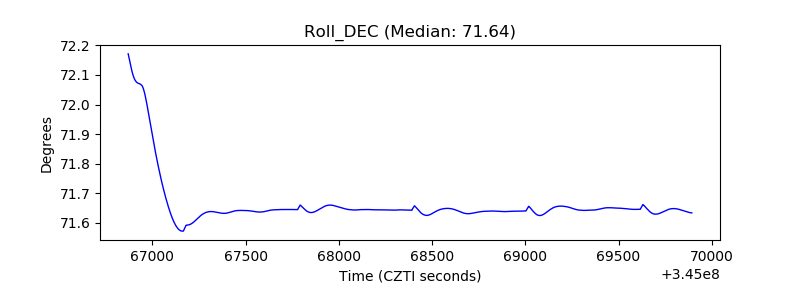 |
| _Roll_RA | 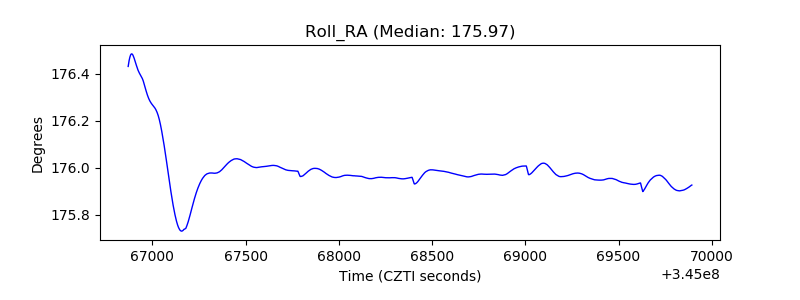 |
| Veto Counter | 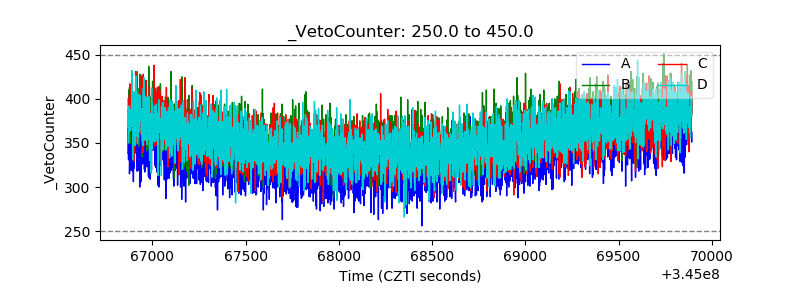 |