| Param | Original file | Final file |
|---|---|---|
| Filename | modeM0/AS1A10_073T04_9000004058_28090cztM0_level2.evt | modeM0/AS1A10_073T04_9000004058_28090cztM0_level2_quad_clean.evt |
| Size (bytes) | 694,794,240 | 161,107,200 |
| Size | 662.6 MB | 153.6 MB |
| Events in quadrant A | 4,098,999 | 1,113,851 |
| Events in quadrant B | 4,088,918 | 1,120,017 |
| Events in quadrant C | 4,540,634 | 1,067,498 |
| Events in quadrant D | 7,732,634 | 982,820 |
| Mode M0 | |||
|---|---|---|---|
| Quadrant | BADHDUFLAG | Total packets | Discarded packets |
| A | 0 | 17787 | 0 |
| B | 0 | 17723 | 0 |
| C | 0 | 19037 | 0 |
| D | 0 | 29006 | 0 |
| Mode M9 | |||
|---|---|---|---|
| Quadrant | BADHDUFLAG | Total packets | Discarded packets |
| A | 0 | 16 | 0 |
| B | 0 | 16 | 0 |
| C | 0 | 16 | 0 |
| D | 0 | 16 | 0 |
| Quadrant | Total seconds | Saturated seconds | Saturation percentage |
|---|---|---|---|
| A | 8578 | 72 | 0.839356% |
| B | 8579 | 31 | 0.361347% |
| C | 8579 | 137 | 1.596923% |
| D | 8579 | 1074 | 12.518942% |
Noise dominated data is calculated using 1-second bins in cleaned event files. If a bin has >2000 counts, and if more than 50% of those come from <1% of pixels, then it is considered to be noise-dominated and hence unusable.
| Quadrant | # 1 sec bins | Bins with >0 counts | Bins with >2000 counts | High rate bins dominated by noise | Noise dominated (total time) | Noise dominated (detector-on time) | Marked lightcurve |
|---|---|---|---|---|---|---|---|
| A | 10108 | 8580 | 31 | 31 | 0.31% | 0.36% | 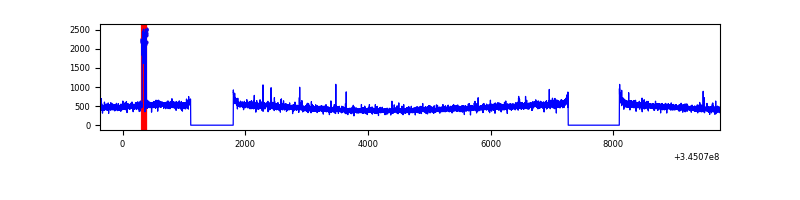 |
| B | 10109 | 8581 | 2 | 2 | 0.02% | 0.02% | 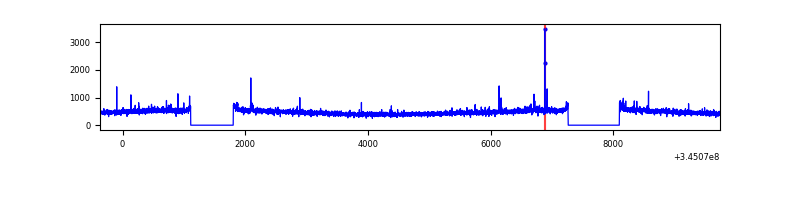 |
| C | 10109 | 8581 | 11 | 11 | 0.11% | 0.13% | 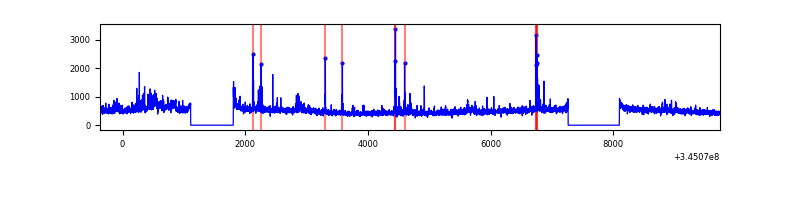 |
| D | 10109 | 8579 | 830 | 830 | 8.21% | 9.67% | 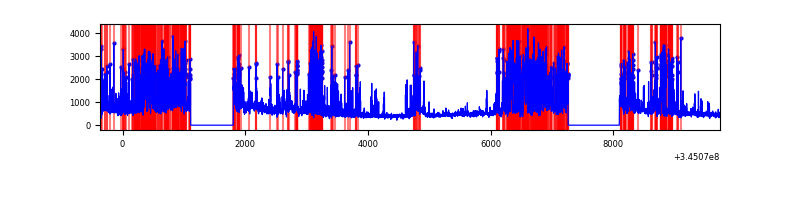 |
Top three noisy pixels from each quadrant. If the there are fewer than three noisy pixels in the level2.evt file, extra rows are filled as -1
| Pixel properties | Quadrant properties | ||||||
|---|---|---|---|---|---|---|---|
| Quadrant | DetID | PixID | Counts | Sigma | Mean | Median | Sigma |
| A | 13 | 170 | 81353 | 388.16 | 1034 | 1013 | 207.0 |
| A | 0 | 13 | 18108 | 82.59 | 1034 | 1013 | 207.0 |
| A | 13 | 254 | 13907 | 62.3 | 1034 | 1013 | 207.0 |
| B | 12 | 111 | 24484 | 120.45 | 1026 | 997 | 195.0 |
| B | 11 | 111 | 21961 | 107.51 | 1026 | 997 | 195.0 |
| B | 14 | 111 | 19687 | 95.85 | 1026 | 997 | 195.0 |
| C | 3 | 233 | 395119 | 1717.5 | 989 | 995 | 229.5 |
| C | 14 | 238 | 160908 | 696.86 | 989 | 995 | 229.5 |
| C | 15 | 208 | 129595 | 560.41 | 989 | 995 | 229.5 |
| D | 12 | 1 | 1819027 | 8067.58 | 944 | 917 | 225.4 |
| D | 8 | 195 | 766440 | 3396.89 | 944 | 917 | 225.4 |
| D | 5 | 222 | 539037 | 2387.82 | 944 | 917 | 225.4 |
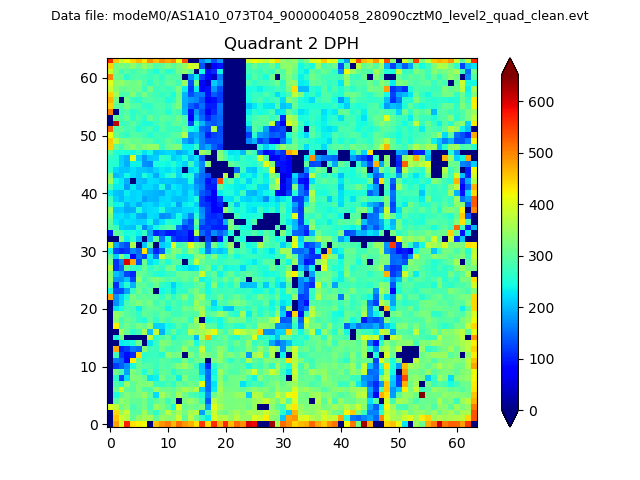
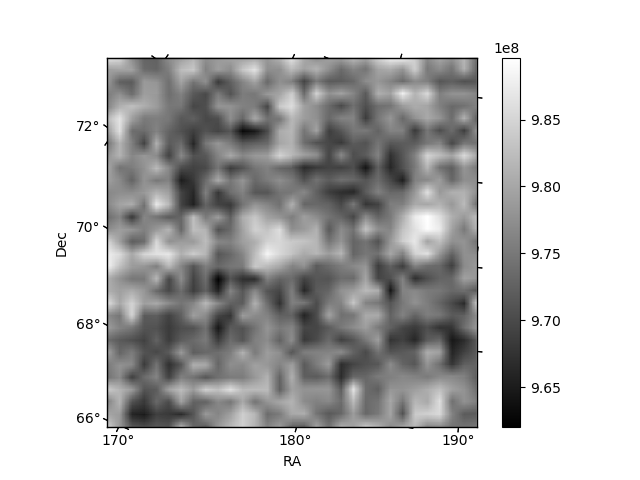
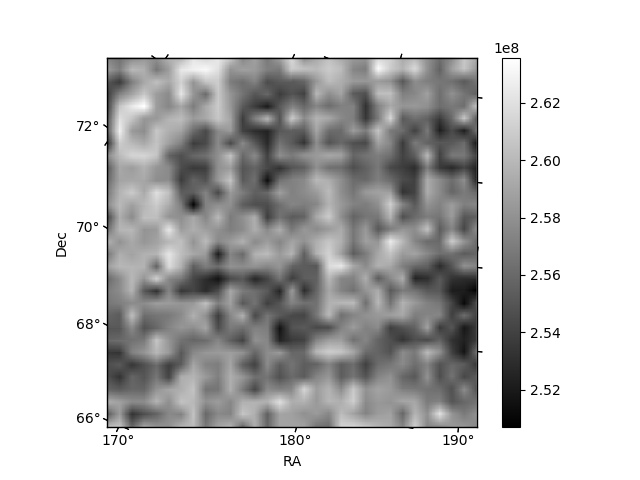
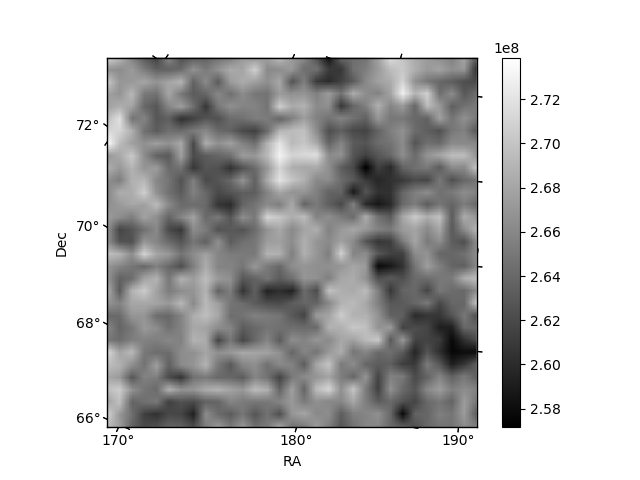
Histogram calculated using DETX and DETY for each event in the final _common_clean file
| Quadrant A | 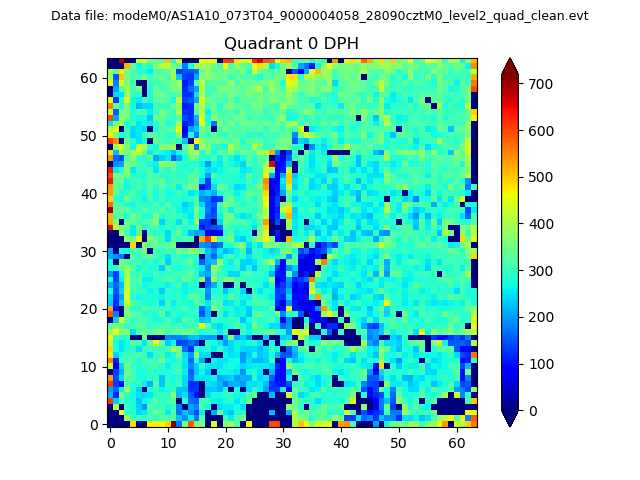 |
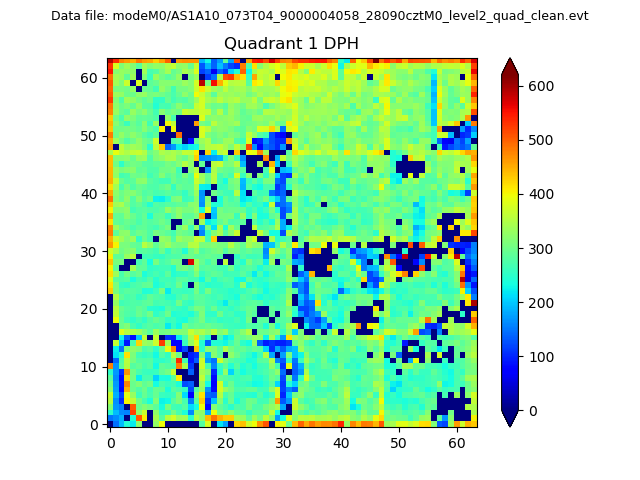 |
Quadrant B |
|---|---|---|---|
| Quadrant D | 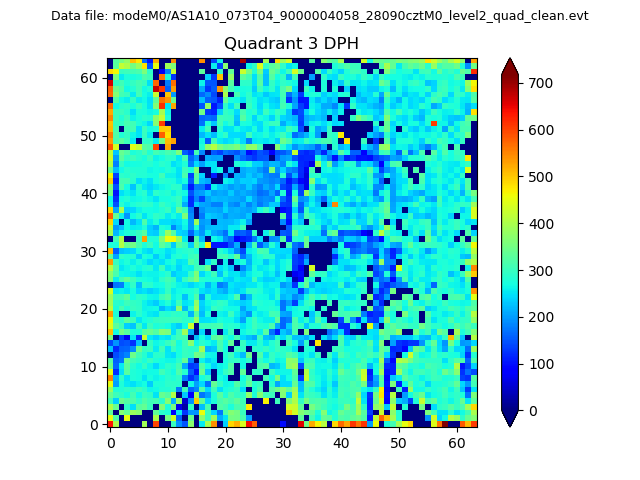 |
 |
Quadrant C |
| Plot type | Count rate plots | Images |
|---|---|---|
| Comparison with Poisson distribution Blue bars denote a histogram of data divided into 1 sec bins. Red curve is a Poisson curve with rate = median count rate of data. |
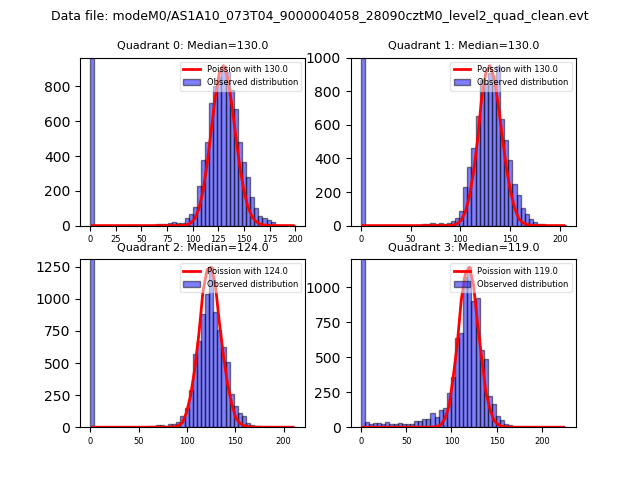 |
 |
| Quadrant-wise count rates Data is divided into 100 sec bins |
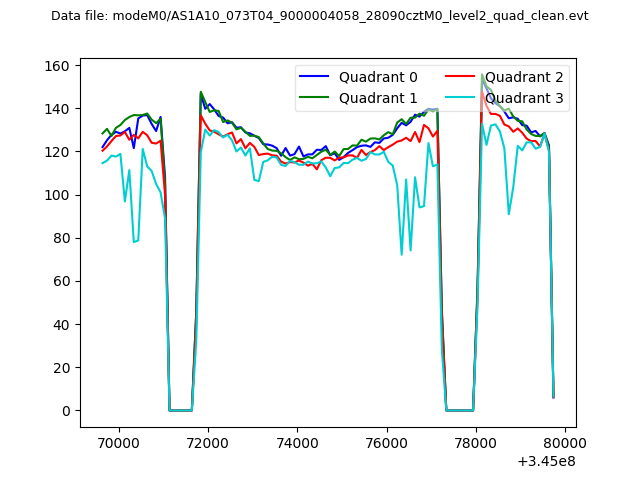 |
|
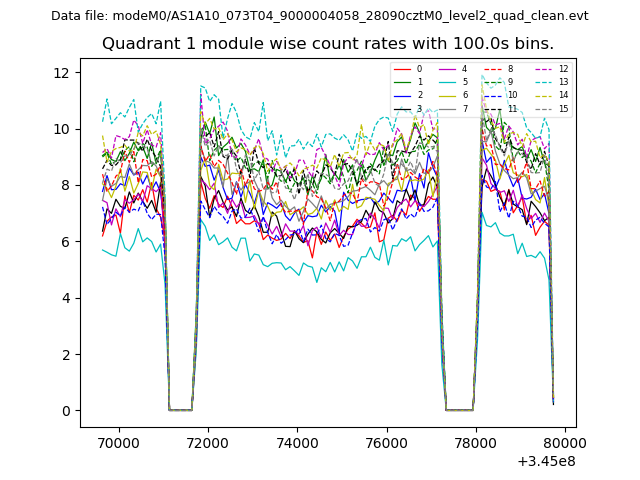
| Module-wise count rates for Quadrant A Data is divided into 100 sec bins |
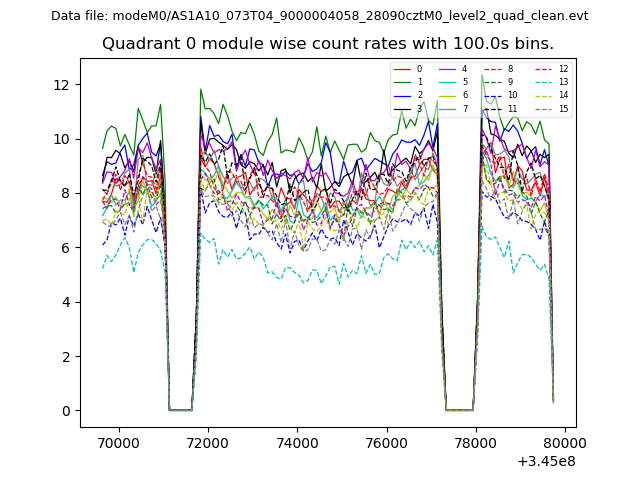 |
 |
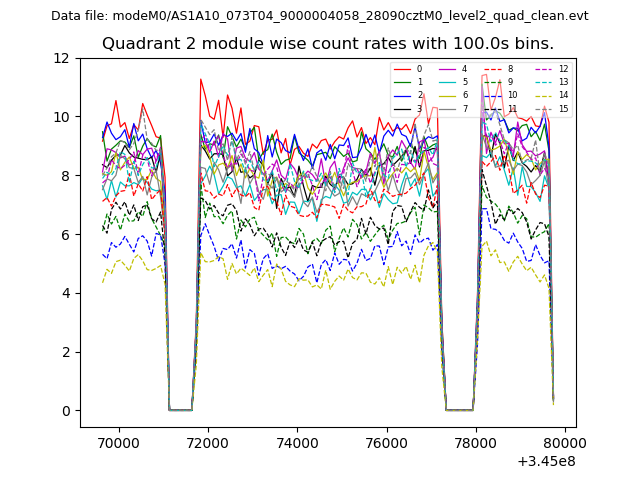
| Module-wise count rates for Quadrant B Data is divided into 100 sec bins |
 |
 |
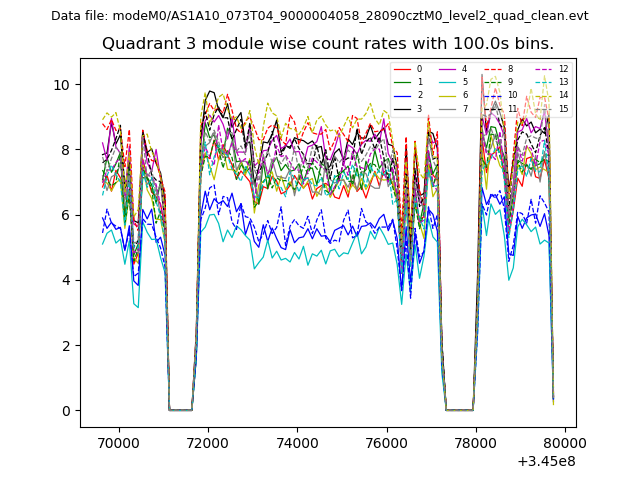
| Module-wise count rates for Quadrant C Data is divided into 100 sec bins |
 |
 |
| Module-wise count rates for Quadrant D Data is divided into 100 sec bins |
 |
 |
| Parameter | Plot |
|---|---|
| CZT HV Monitor | 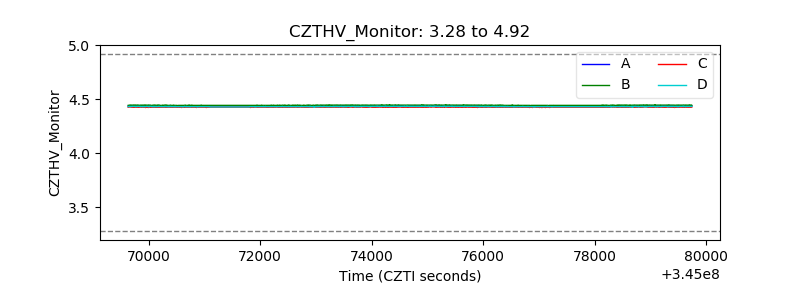 |
| D_VDD | 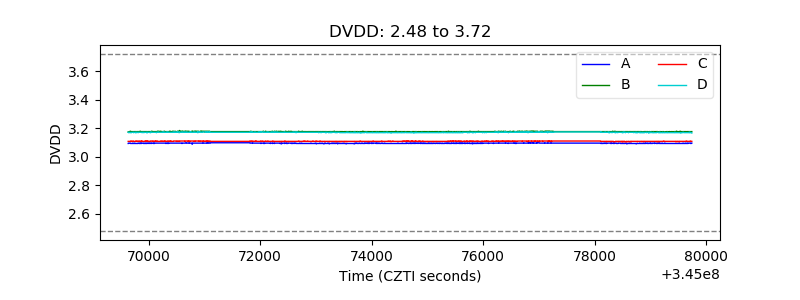 |
| Temperature 1 |  |
| Veto HV Monitor | 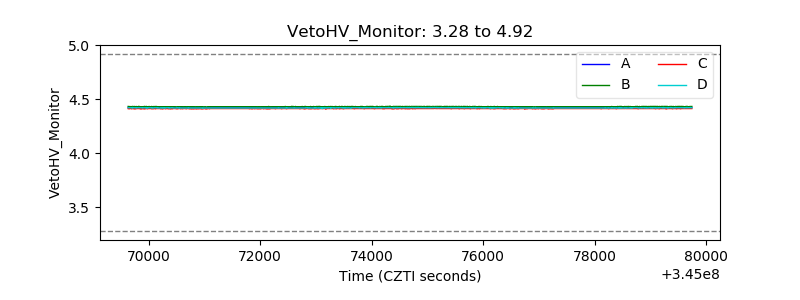 |
| Veto LLD | 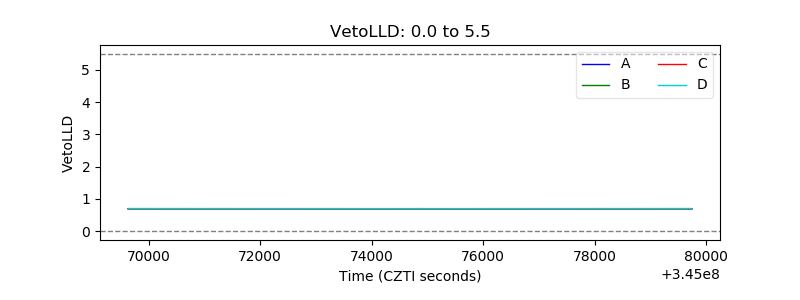 |
| Alpha Counter | 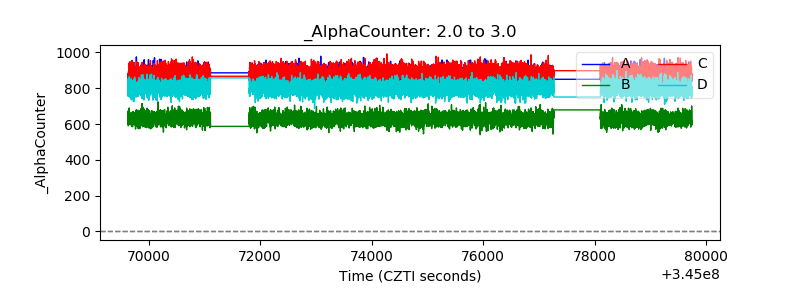 |
| _CPM_Rate | 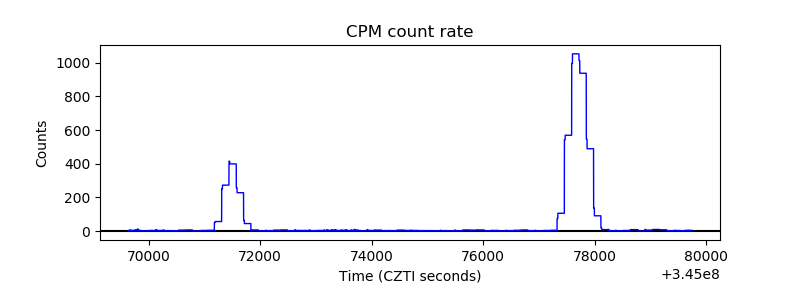 |
| CZT Counter | 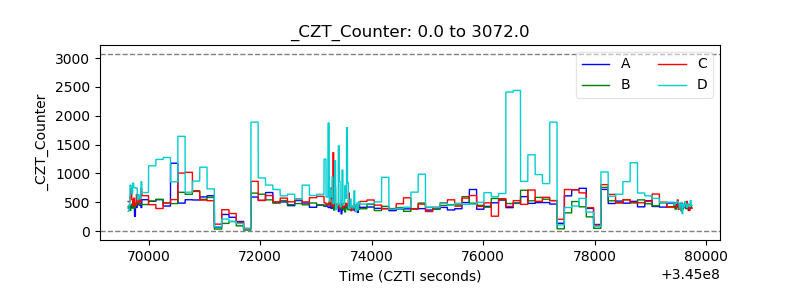 |
| +2.5 Volts monitor |  |
| +5 Volts monitor |  |
| _ROLL_ROT | 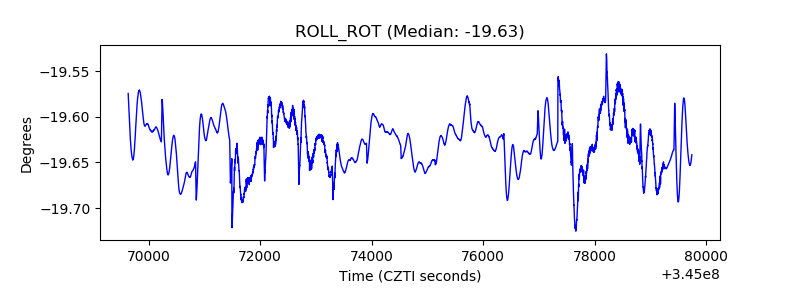 |
| _Roll_DEC | 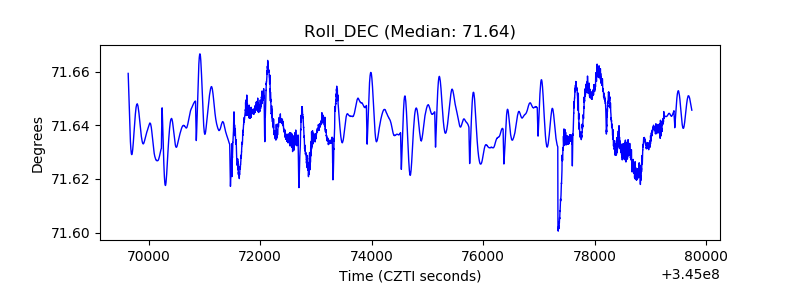 |
| _Roll_RA | 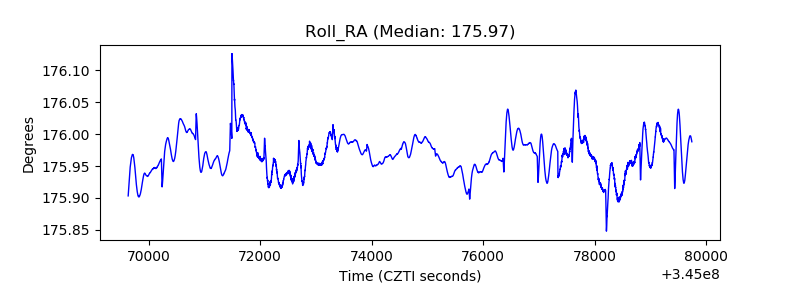 |
| Veto Counter | 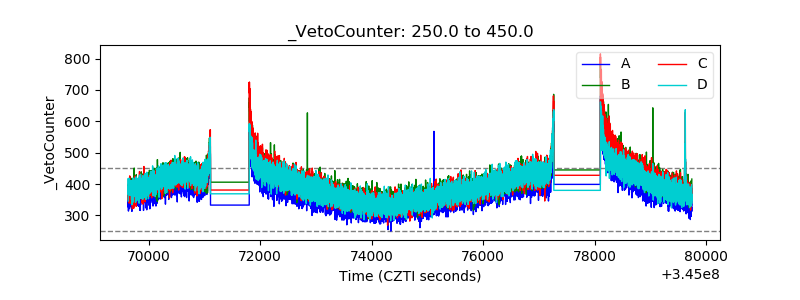 |