| Param | Original file | Final file |
|---|---|---|
| Filename | modeM0/AS1A10_073T04_9000004058_28091cztM0_level2.evt | modeM0/AS1A10_073T04_9000004058_28091cztM0_level2_quad_clean.evt |
| Size (bytes) | 389,698,560 | 94,818,240 |
| Size | 371.6 MB | 90.4 MB |
| Events in quadrant A | 2,302,697 | 654,943 |
| Events in quadrant B | 2,332,296 | 661,335 |
| Events in quadrant C | 2,562,938 | 630,128 |
| Events in quadrant D | 4,258,409 | 569,151 |
| Mode M0 | |||
|---|---|---|---|
| Quadrant | BADHDUFLAG | Total packets | Discarded packets |
| A | 0 | 10333 | 0 |
| B | 0 | 10411 | 0 |
| C | 0 | 10916 | 0 |
| D | 0 | 16299 | 0 |
| Mode M9 | |||
|---|---|---|---|
| Quadrant | BADHDUFLAG | Total packets | Discarded packets |
| A | 0 | 9 | 0 |
| B | 0 | 9 | 0 |
| C | 0 | 9 | 0 |
| D | 0 | 9 | 0 |
| Quadrant | Total seconds | Saturated seconds | Saturation percentage |
|---|---|---|---|
| A | 5080 | 16 | 0.314961% |
| B | 5081 | 18 | 0.354261% |
| C | 5081 | 67 | 1.318638% |
| D | 5081 | 715 | 14.072033% |
Noise dominated data is calculated using 1-second bins in cleaned event files. If a bin has >2000 counts, and if more than 50% of those come from <1% of pixels, then it is considered to be noise-dominated and hence unusable.
| Quadrant | # 1 sec bins | Bins with >0 counts | Bins with >2000 counts | High rate bins dominated by noise | Noise dominated (total time) | Noise dominated (detector-on time) | Marked lightcurve |
|---|---|---|---|---|---|---|---|
| A | 5915 | 5081 | 0 | 0 | 0.00% | 0.00% | 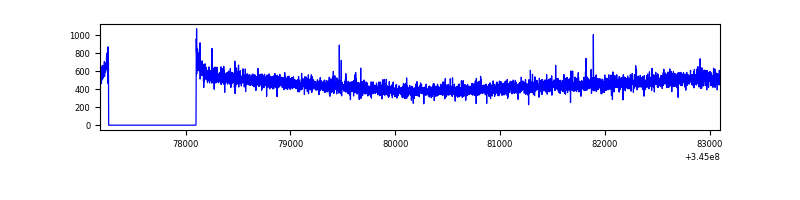 |
| B | 5916 | 5082 | 1 | 1 | 0.02% | 0.02% | 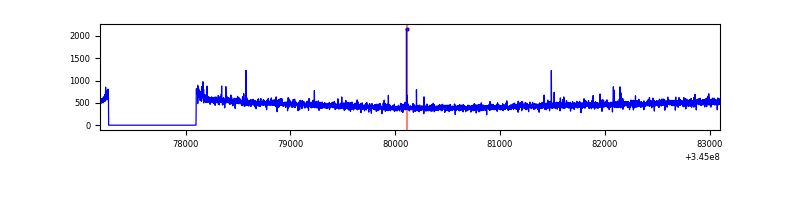 |
| C | 5916 | 5082 | 8 | 8 | 0.14% | 0.16% | 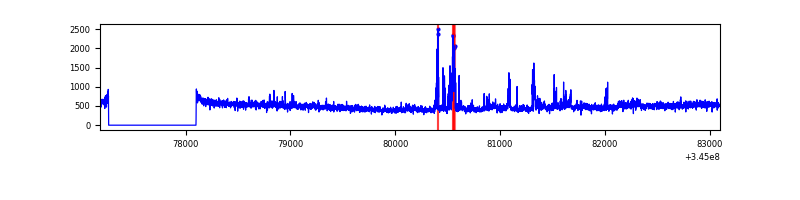 |
| D | 5916 | 5081 | 550 | 550 | 9.30% | 10.82% | 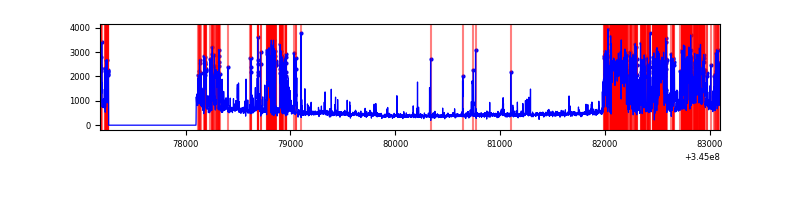 |
Top three noisy pixels from each quadrant. If the there are fewer than three noisy pixels in the level2.evt file, extra rows are filled as -1
| Pixel properties | Quadrant properties | ||||||
|---|---|---|---|---|---|---|---|
| Quadrant | DetID | PixID | Counts | Sigma | Mean | Median | Sigma |
| A | 0 | 13 | 12016 | 96.17 | 593 | 581 | 118.9 |
| A | 13 | 254 | 7935 | 61.85 | 593 | 581 | 118.9 |
| A | 3 | 137 | 5751 | 43.48 | 593 | 581 | 118.9 |
| B | 12 | 111 | 13748 | 117.56 | 588 | 572 | 112.1 |
| B | 11 | 111 | 12570 | 107.05 | 588 | 572 | 112.1 |
| B | 4 | 52 | 11723 | 99.49 | 588 | 572 | 112.1 |
| C | 3 | 233 | 243615 | 1819.83 | 566 | 569 | 133.6 |
| C | 14 | 238 | 92823 | 690.76 | 566 | 569 | 133.6 |
| C | 15 | 208 | 20305 | 147.77 | 566 | 569 | 133.6 |
| D | 12 | 1 | 1341120 | 10648.31 | 530 | 515 | 125.9 |
| D | 8 | 195 | 314388 | 2493.07 | 530 | 515 | 125.9 |
| D | 1 | 52 | 274913 | 2179.52 | 530 | 515 | 125.9 |
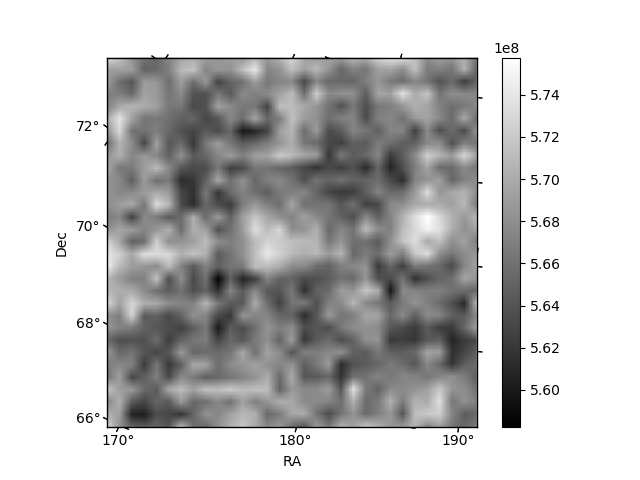
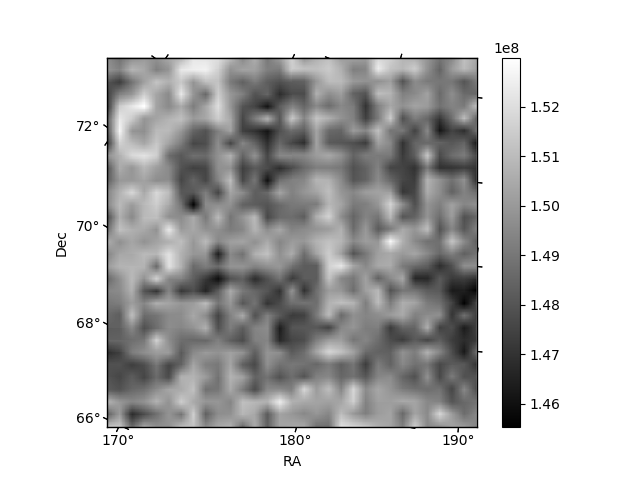
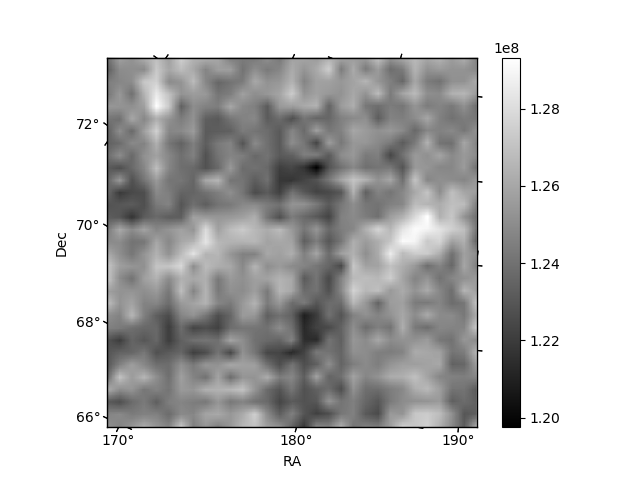
Histogram calculated using DETX and DETY for each event in the final _common_clean file
| Quadrant A | 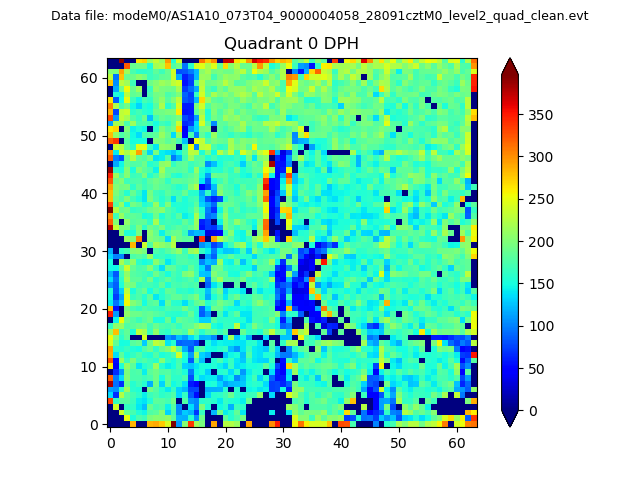 |
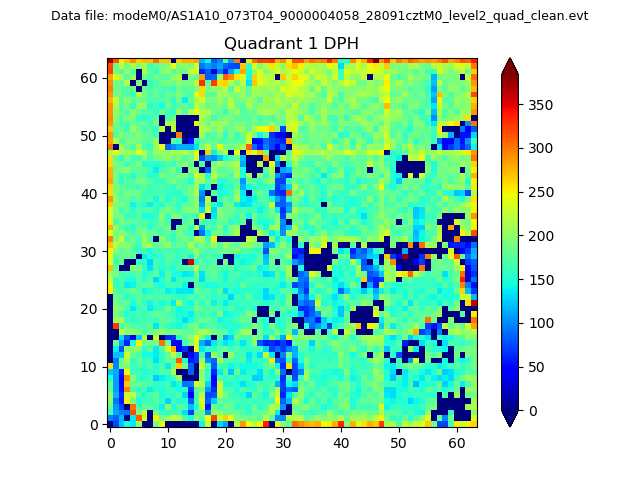 |
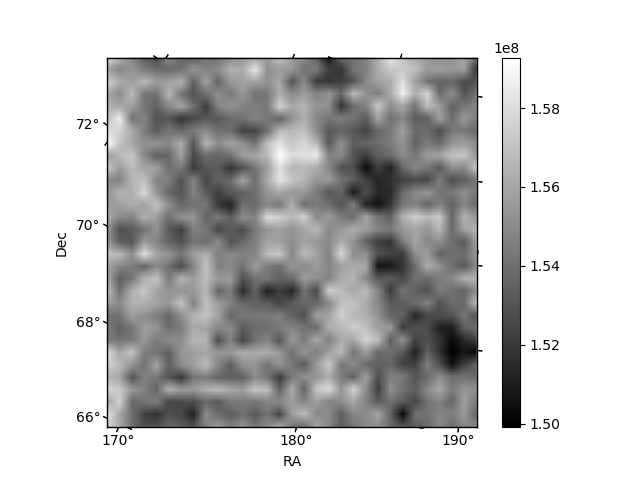
Quadrant B |
|---|---|---|---|
| Quadrant D | 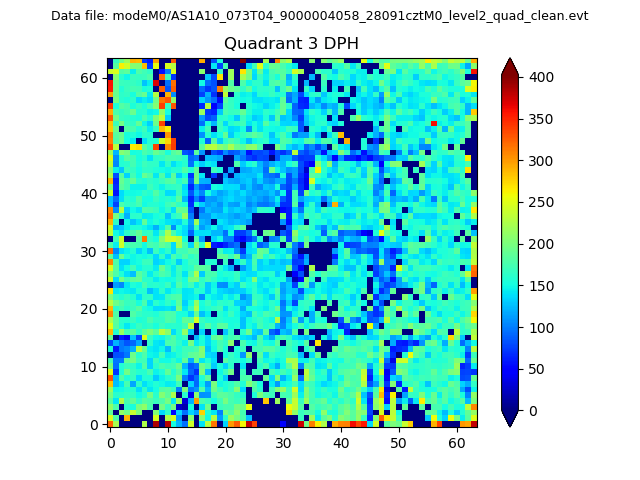 |
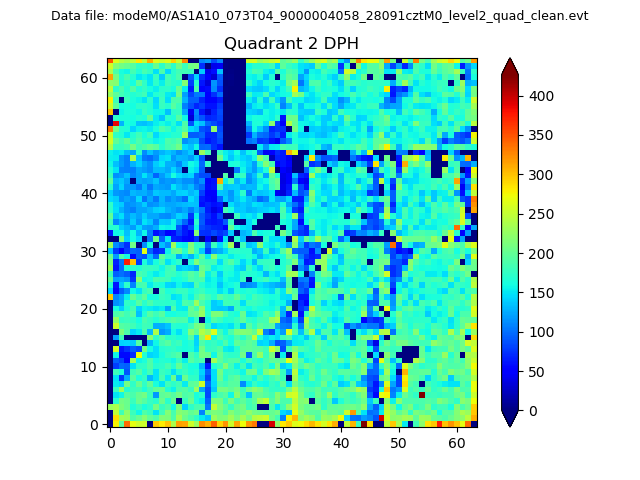 |
Quadrant C |
| Plot type | Count rate plots | Images |
|---|---|---|
| Comparison with Poisson distribution Blue bars denote a histogram of data divided into 1 sec bins. Red curve is a Poisson curve with rate = median count rate of data. |
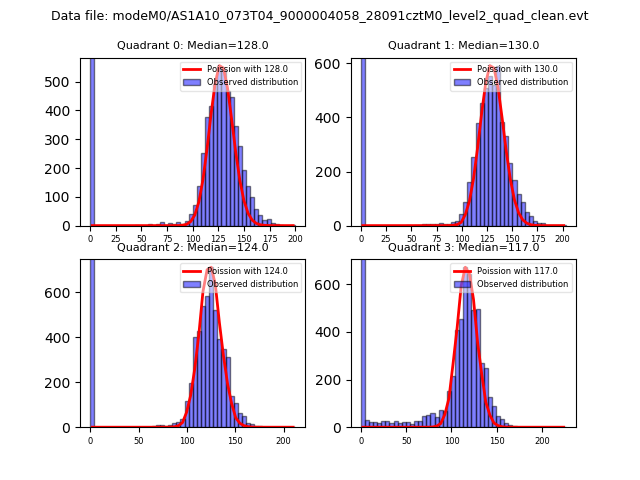 |
 |
| Quadrant-wise count rates Data is divided into 100 sec bins |
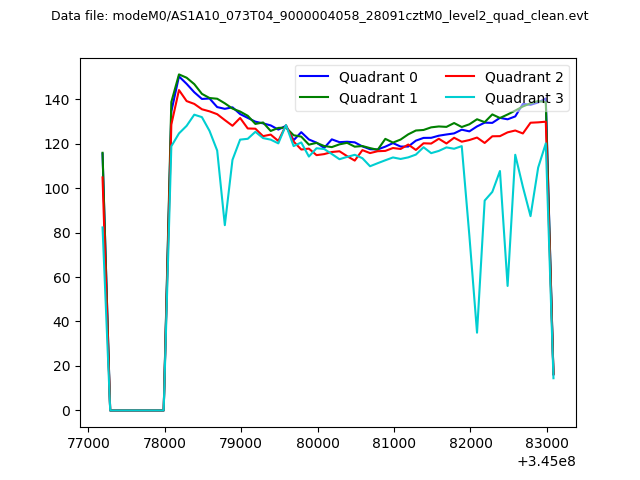 |
|
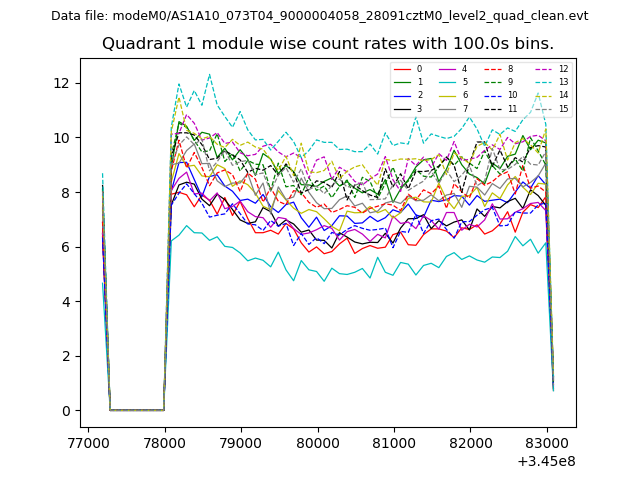
| Module-wise count rates for Quadrant A Data is divided into 100 sec bins |
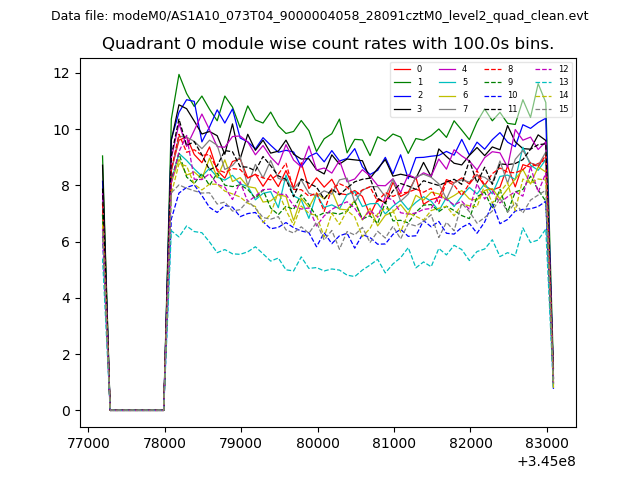 |
 |
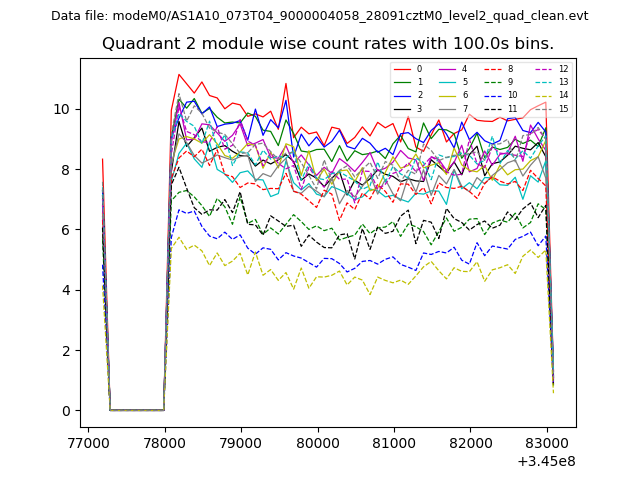
| Module-wise count rates for Quadrant B Data is divided into 100 sec bins |
 |
 |
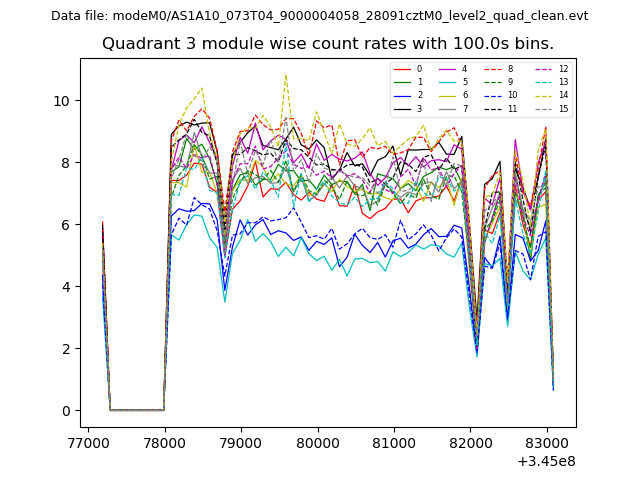
| Module-wise count rates for Quadrant C Data is divided into 100 sec bins |
 |
 |
| Module-wise count rates for Quadrant D Data is divided into 100 sec bins |
 |
 |
| Parameter | Plot |
|---|---|
| CZT HV Monitor | 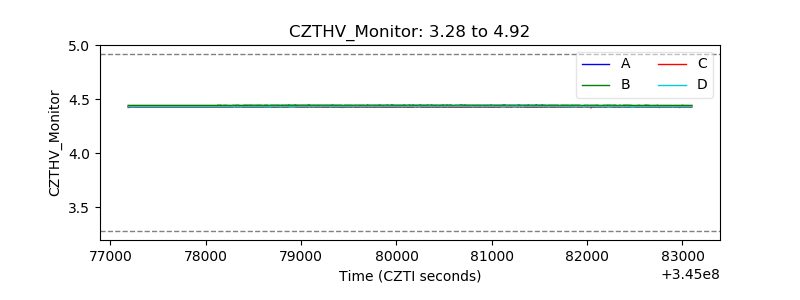 |
| D_VDD | 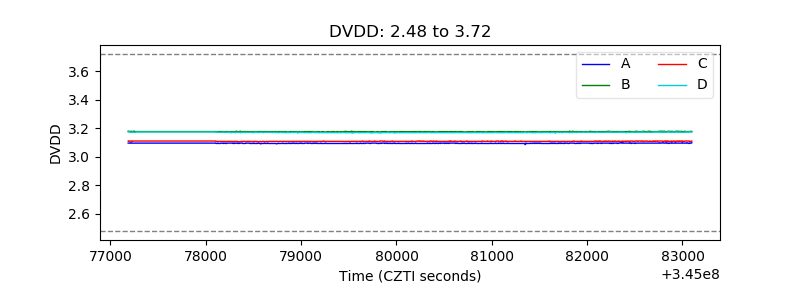 |
| Temperature 1 | 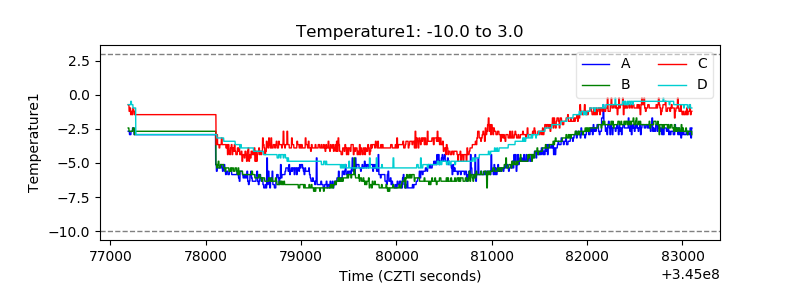 |
| Veto HV Monitor | 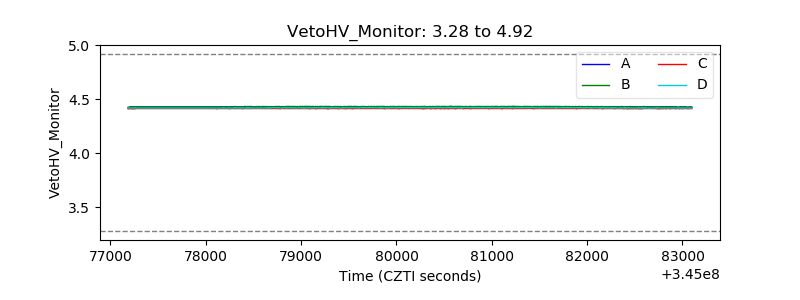 |
| Veto LLD | 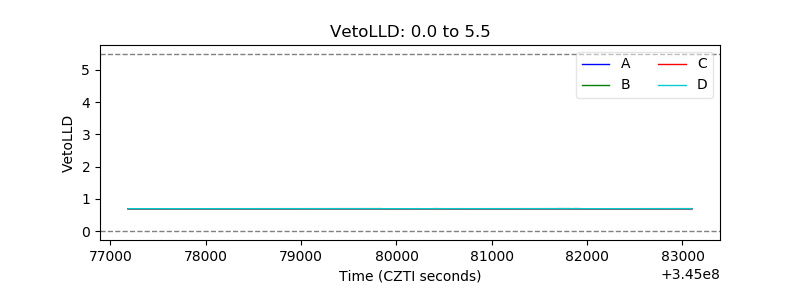 |
| Alpha Counter | 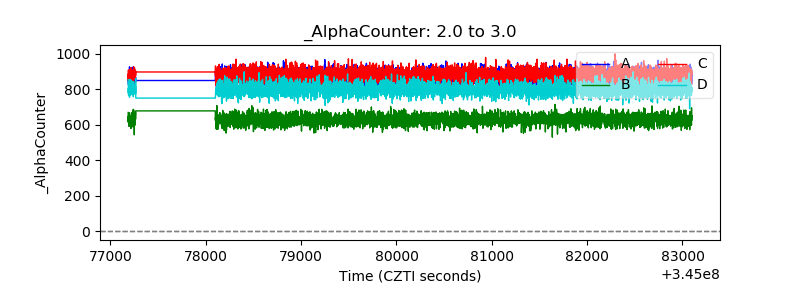 |
| _CPM_Rate | 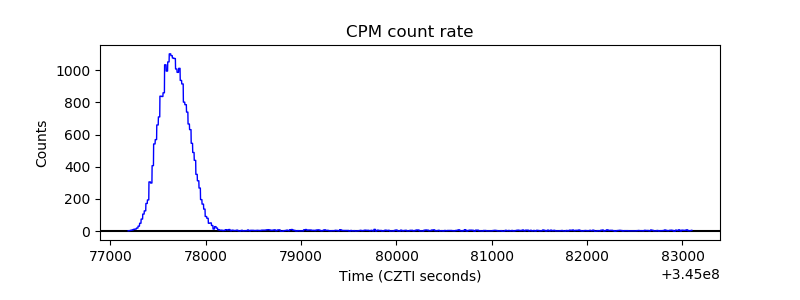 |
| CZT Counter | 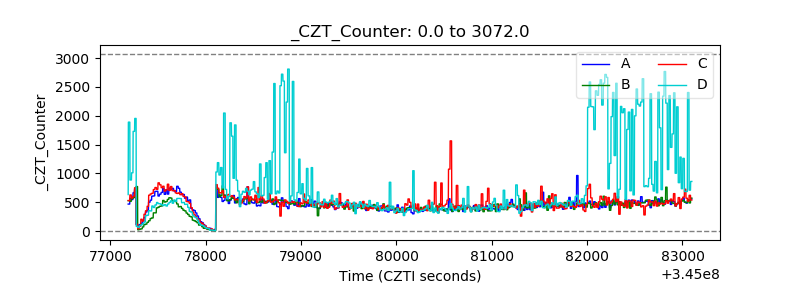 |
| +2.5 Volts monitor |  |
| +5 Volts monitor |  |
| _ROLL_ROT | 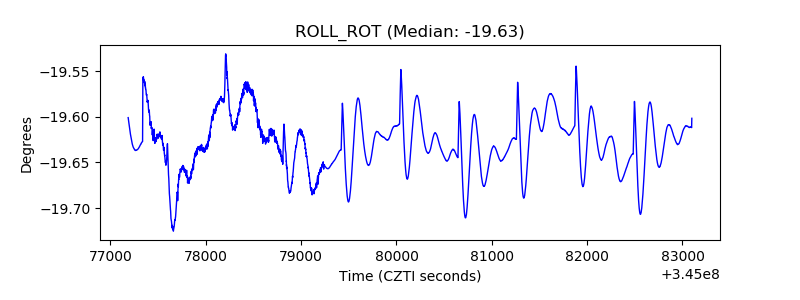 |
| _Roll_DEC |  |
| _Roll_RA | 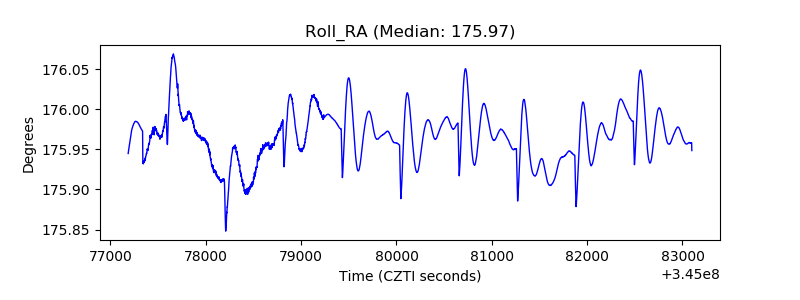 |
| Veto Counter | 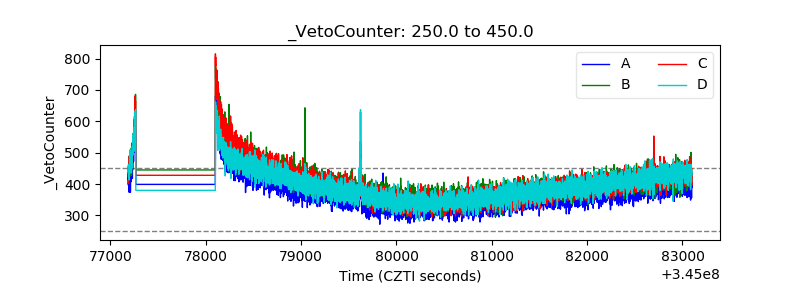 |