| Param | Original file | Final file |
|---|---|---|
| Filename | modeM0/AS1A10_057T05_9000004060cztM0_level2.fits | modeM0/AS1A10_057T05_9000004060cztM0_level2_quad_clean.evt |
| Size (bytes) | 758,344,320 | 631,255,680 |
| Size | 723.2 MB | 602.0 MB |
| Events in quadrant A | 4,788,088 | 3,728,734 |
| Events in quadrant B | 4,544,241 | 3,611,815 |
| Events in quadrant C | 4,614,594 | 3,414,979 |
| Events in quadrant D | 3,836,733 | 3,180,926 |
| Mode SS | |||
|---|---|---|---|
| Quadrant | BADHDUFLAG | Total packets | Discarded packets |
| A | 0 | 1540 | 0 |
| B | 0 | 1534 | 0 |
| C | 0 | 1530 | 0 |
| D | 0 | 1536 | 0 |
| Mode M0 | |||
|---|---|---|---|
| Quadrant | BADHDUFLAG | Total packets | Discarded packets |
| A | 0 | 159139 | 0 |
| B | 0 | 158288 | 0 |
| C | 0 | 162162 | 0 |
| D | 0 | 239900 | 0 |
| Mode M9 | |||
|---|---|---|---|
| Quadrant | BADHDUFLAG | Total packets | Discarded packets |
| A | 0 | 176 | 0 |
| B | 0 | 176 | 0 |
| C | 0 | 177 | 0 |
| D | 0 | 177 | 0 |
| Quadrant | Total seconds | Saturated seconds | Saturation percentage |
|---|---|---|---|
| A | 75610 | 781 | 1.032932% |
| B | 75583 | 942 | 1.246312% |
| C | 75584 | 1435 | 1.898550% |
| D | 75435 | 7220 | 9.571154% |
Noise dominated data is calculated using 1-second bins in cleaned event files. If a bin has >2000 counts, and if more than 50% of those come from <1% of pixels, then it is considered to be noise-dominated and hence unusable.
| Quadrant | # 1 sec bins | Bins with >0 counts | Bins with >2000 counts | High rate bins dominated by noise | Noise dominated (total time) | Noise dominated (detector-on time) | Marked lightcurve |
|---|---|---|---|---|---|---|---|
| A | 95758 | 75896 | 0 | 0 | 0.00% | 0.00% | 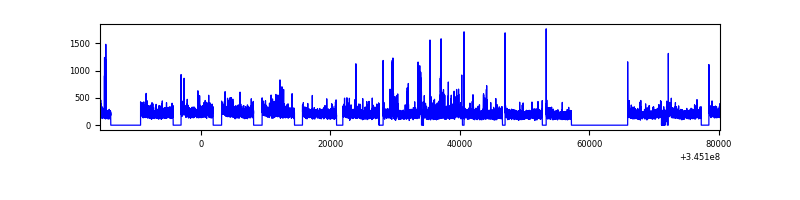 |
| B | 95758 | 75862 | 0 | 0 | 0.00% | 0.00% |  |
| C | 95757 | 75869 | 0 | 0 | 0.00% | 0.00% |  |
| D | 95756 | 75440 | 0 | 0 | 0.00% | 0.00% |  |
Top three noisy pixels from each quadrant. If the there are fewer than three noisy pixels in the level2.evt file, extra rows are filled as -1
| Pixel properties | Quadrant properties | ||||||
|---|---|---|---|---|---|---|---|
| Quadrant | DetID | PixID | Counts | Sigma | Mean | Median | Sigma |
| A | 0 | 29 | 3828 | 8.67 | 1251 | 1176 | 306.0 |
| A | 7 | 110 | 3784 | 8.52 | 1251 | 1176 | 306.0 |
| A | 9 | 19 | 3542 | 7.73 | 1251 | 1176 | 306.0 |
| B | 2 | 9 | 3678 | 10.74 | 1202 | 1149 | 235.3 |
| B | 2 | 8 | 3104 | 8.31 | 1202 | 1149 | 235.3 |
| B | 5 | 128 | 3086 | 8.23 | 1202 | 1149 | 235.3 |
| C | 1 | 81 | 3502 | 7.68 | 1218 | 1144 | 307.1 |
| C | 1 | 80 | 3501 | 7.68 | 1218 | 1144 | 307.1 |
| C | 12 | 241 | 3207 | 6.72 | 1218 | 1144 | 307.1 |
| D | 6 | 67 | 2788 | 6.17 | 1094 | 998 | 290.1 |
| D | 7 | 3 | 2698 | 5.86 | 1094 | 998 | 290.1 |
| D | 6 | 38 | 2689 | 5.83 | 1094 | 998 | 290.1 |
Histogram calculated using DETX and DETY for each event in the final _common_clean file
| Quadrant A |  |
 |
Quadrant B |
|---|---|---|---|
| Quadrant D | 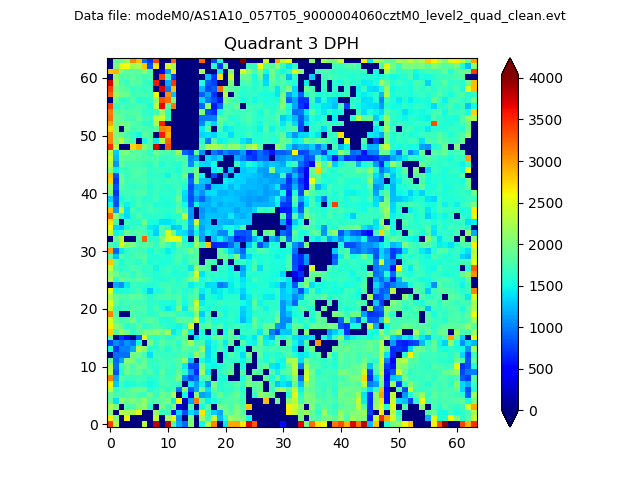 |
 |
Quadrant C |
| Plot type | Count rate plots | Images |
|---|---|---|
| Comparison with Poisson distribution Blue bars denote a histogram of data divided into 1 sec bins. Red curve is a Poisson curve with rate = median count rate of data. |
 |
 |
| Quadrant-wise count rates Data is divided into 100 sec bins |
 |
|
| Module-wise count rates for Quadrant A Data is divided into 100 sec bins |
 |
 |
| Module-wise count rates for Quadrant B Data is divided into 100 sec bins |
 |
 |
| Module-wise count rates for Quadrant C Data is divided into 100 sec bins |
 |
 |
| Module-wise count rates for Quadrant D Data is divided into 100 sec bins |
 |
 |
| Parameter | Plot |
|---|---|
| CZT HV Monitor |  |
| D_VDD |  |
| Temperature 1 |  |
| Veto HV Monitor |  |
| Veto LLD |  |
| Alpha Counter |  |
| _CPM_Rate |  |
| CZT Counter |  |
| +2.5 Volts monitor |  |
| +5 Volts monitor |  |
| _ROLL_ROT |  |
| _Roll_DEC |  |
| _Roll_RA |  |
| Veto Counter |  |