| Param | Original file | Final file |
|---|---|---|
| Filename | modeM0/AS1A10_057T05_9000004060_28091cztM0_level2.evt | modeM0/AS1A10_057T05_9000004060_28091cztM0_level2_quad_clean.evt |
| Size (bytes) | 126,475,200 | 34,741,440 |
| Size | 120.6 MB | 33.1 MB |
| Events in quadrant A | 812,017 | 242,644 |
| Events in quadrant B | 813,228 | 239,333 |
| Events in quadrant C | 812,318 | 226,294 |
| Events in quadrant D | 1,278,075 | 222,189 |
| Mode M0 | |||
|---|---|---|---|
| Quadrant | BADHDUFLAG | Total packets | Discarded packets |
| A | 0 | 3465 | 0 |
| B | 0 | 3462 | 0 |
| C | 0 | 3452 | 0 |
| D | 0 | 4922 | 0 |
| Mode M9 | |||
|---|---|---|---|
| Quadrant | BADHDUFLAG | Total packets | Discarded packets |
| A | 0 | 6 | 0 |
| B | 0 | 6 | 0 |
| C | 0 | 6 | 0 |
| D | 0 | 6 | 0 |
| Quadrant | Total seconds | Saturated seconds | Saturation percentage |
|---|---|---|---|
| A | 1651 | 3 | 0.181708% |
| B | 1651 | 6 | 0.363416% |
| C | 1651 | 3 | 0.181708% |
| D | 1651 | 69 | 4.179285% |
Noise dominated data is calculated using 1-second bins in cleaned event files. If a bin has >2000 counts, and if more than 50% of those come from <1% of pixels, then it is considered to be noise-dominated and hence unusable.
| Quadrant | # 1 sec bins | Bins with >0 counts | Bins with >2000 counts | High rate bins dominated by noise | Noise dominated (total time) | Noise dominated (detector-on time) | Marked lightcurve |
|---|---|---|---|---|---|---|---|
| A | 1651 | 1651 | 1 | 1 | 0.06% | 0.06% | 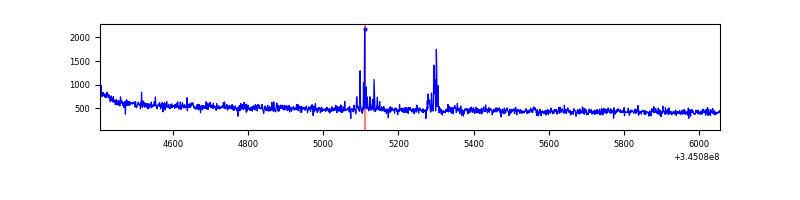 |
| B | 1651 | 1651 | 0 | 0 | 0.00% | 0.00% | 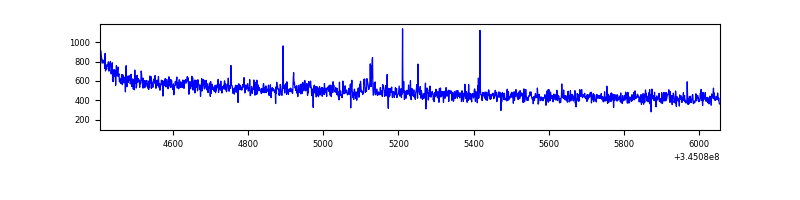 |
| C | 1651 | 1651 | 0 | 0 | 0.00% | 0.00% | 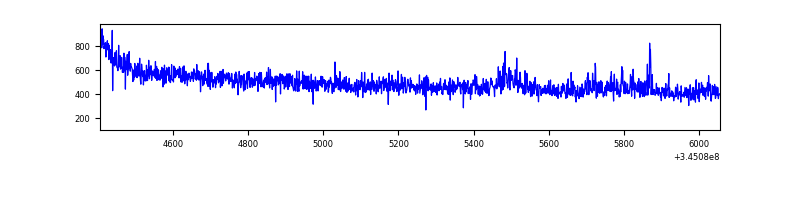 |
| D | 1651 | 1651 | 55 | 55 | 3.33% | 3.33% | 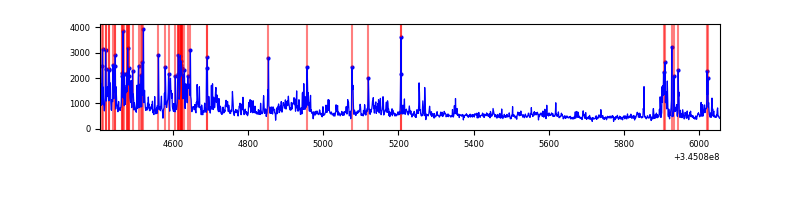 |
Top three noisy pixels from each quadrant. If the there are fewer than three noisy pixels in the level2.evt file, extra rows are filled as -1
| Pixel properties | Quadrant properties | ||||||
|---|---|---|---|---|---|---|---|
| Quadrant | DetID | PixID | Counts | Sigma | Mean | Median | Sigma |
| A | 13 | 170 | 9932 | 230.09 | 204 | 201 | 42.3 |
| A | 12 | 96 | 8053 | 185.66 | 204 | 201 | 42.3 |
| A | 0 | 13 | 4476 | 101.08 | 204 | 201 | 42.3 |
| B | 4 | 52 | 6284 | 147.3 | 205 | 201 | 41.3 |
| B | 12 | 111 | 4776 | 110.78 | 205 | 201 | 41.3 |
| B | 11 | 111 | 4304 | 99.36 | 205 | 201 | 41.3 |
| C | 14 | 238 | 31718 | 662.87 | 194 | 194 | 47.6 |
| C | 3 | 233 | 22276 | 464.33 | 194 | 194 | 47.6 |
| C | 13 | 61 | 1290 | 23.05 | 194 | 194 | 47.6 |
| D | 12 | 1 | 232060 | 4964.39 | 191 | 186 | 46.7 |
| D | 5 | 222 | 99494 | 2126.17 | 191 | 186 | 46.7 |
| D | 8 | 195 | 87626 | 1872.08 | 191 | 186 | 46.7 |
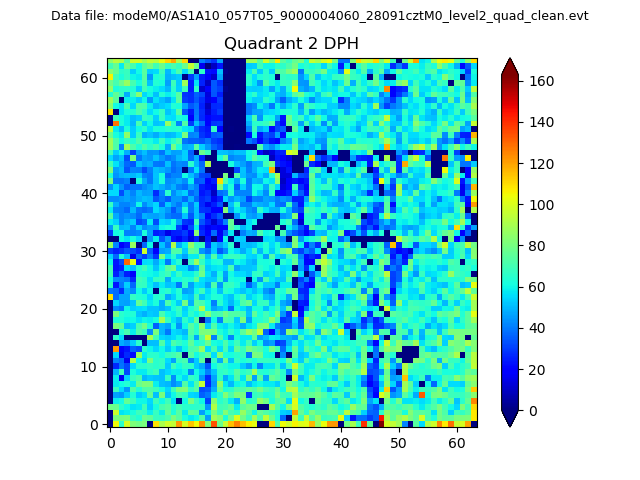
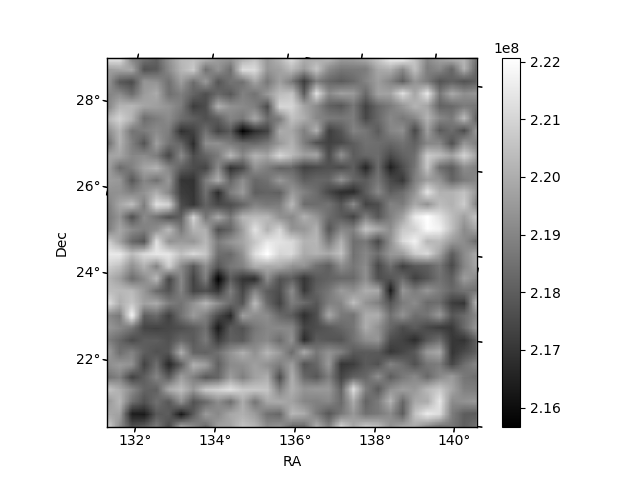
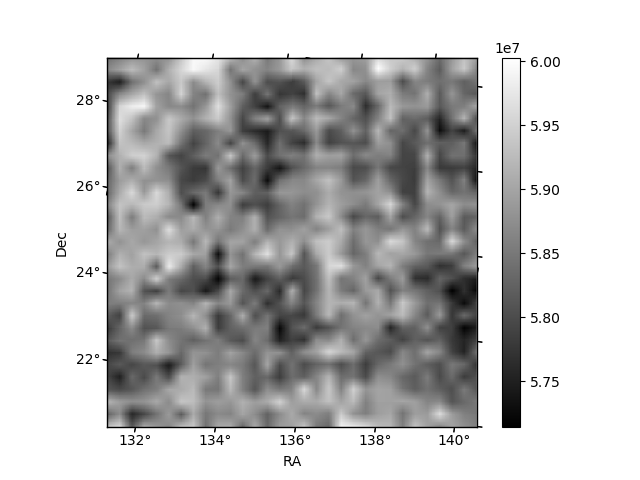
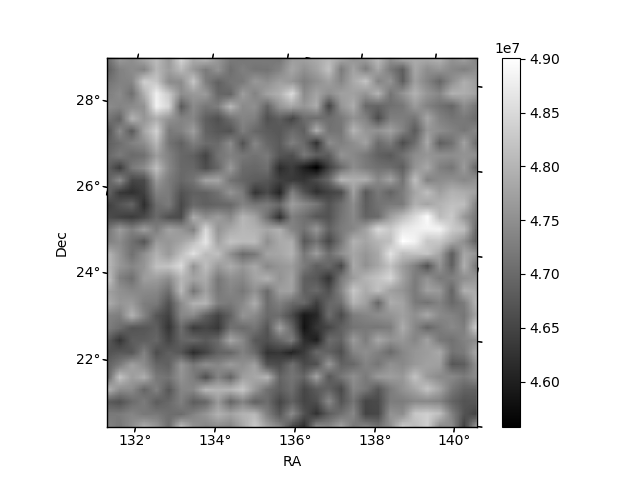
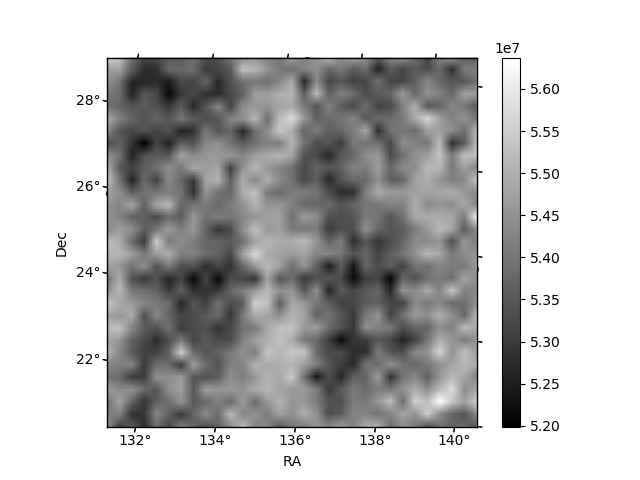
Histogram calculated using DETX and DETY for each event in the final _common_clean file
| Quadrant A | 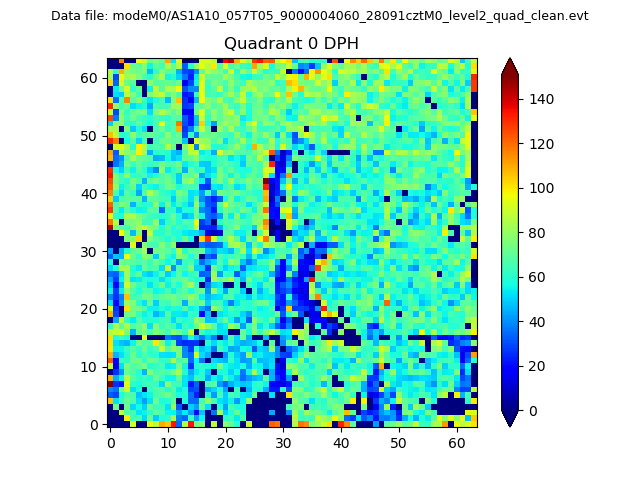 |
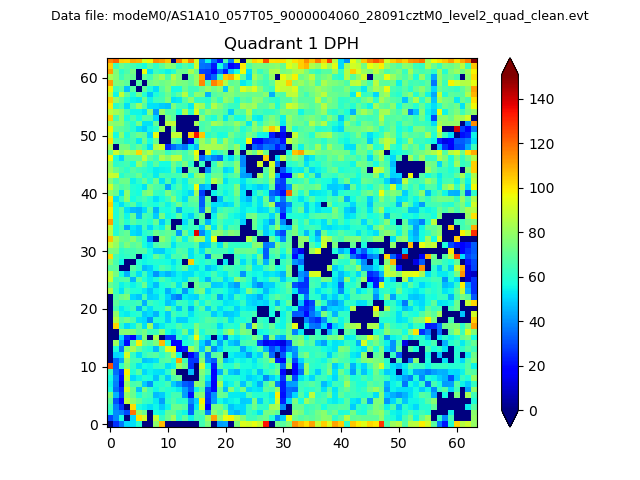 |
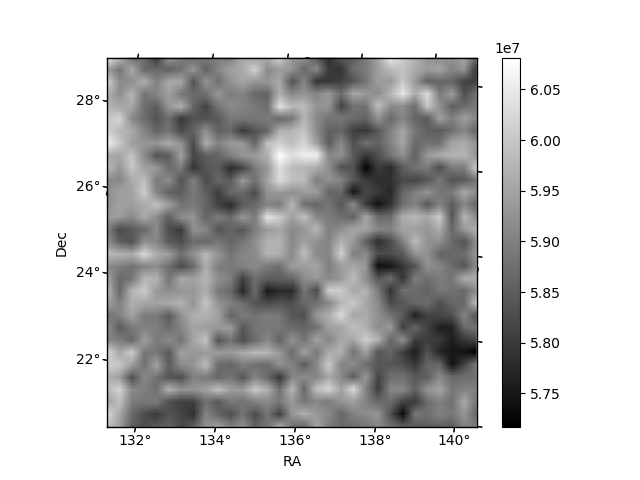
Quadrant B |
|---|---|---|---|
| Quadrant D | 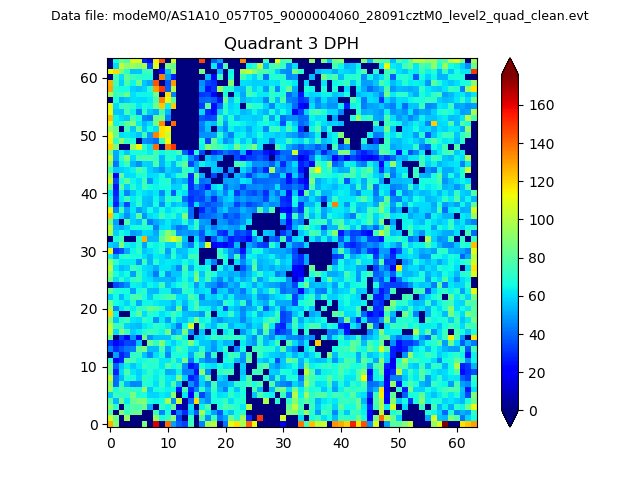 |
 |
Quadrant C |
| Plot type | Count rate plots | Images |
|---|---|---|
| Comparison with Poisson distribution Blue bars denote a histogram of data divided into 1 sec bins. Red curve is a Poisson curve with rate = median count rate of data. |
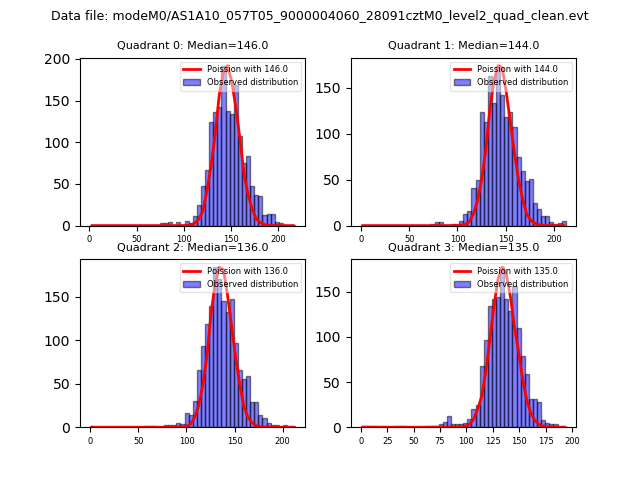 |
 |
| Quadrant-wise count rates Data is divided into 100 sec bins |
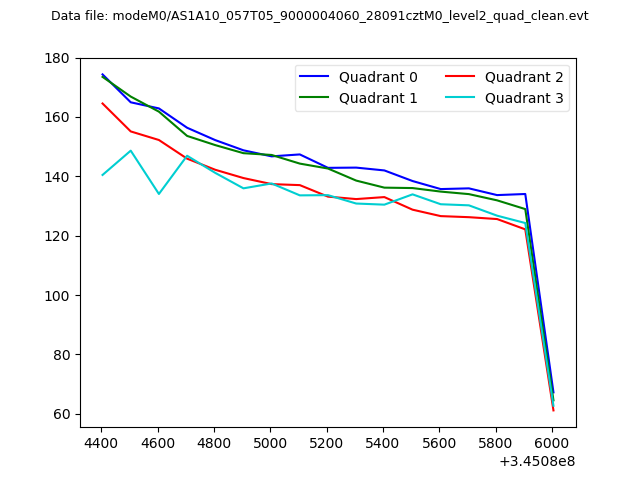 |
|
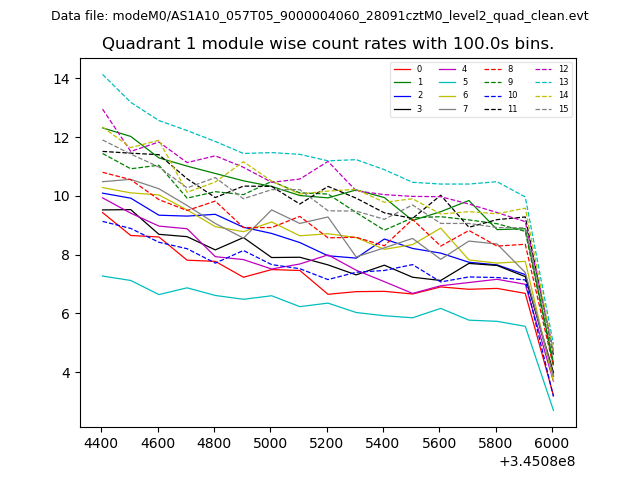
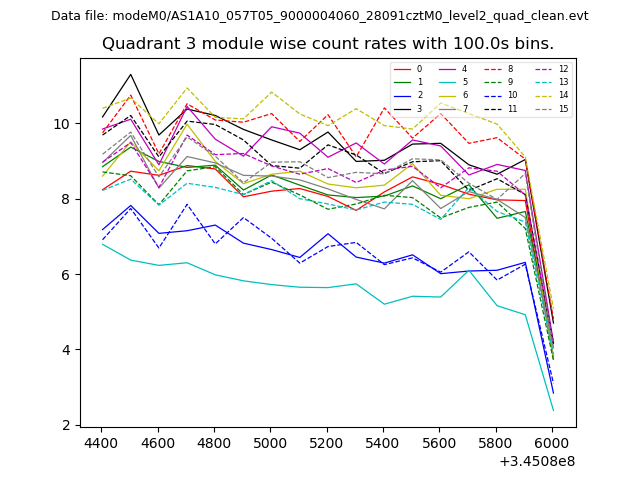
| Module-wise count rates for Quadrant A Data is divided into 100 sec bins |
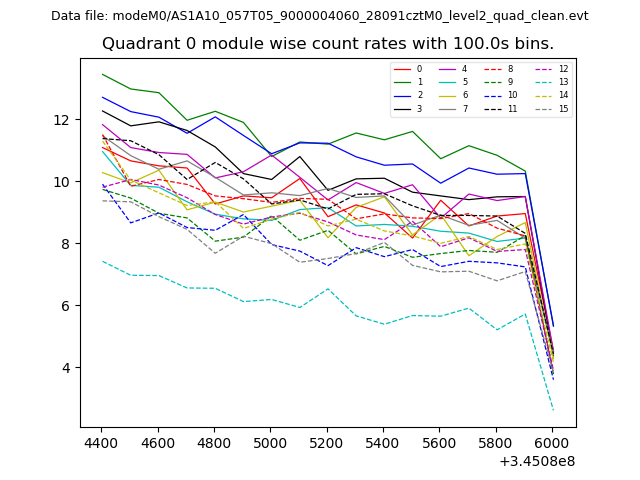 |
 |
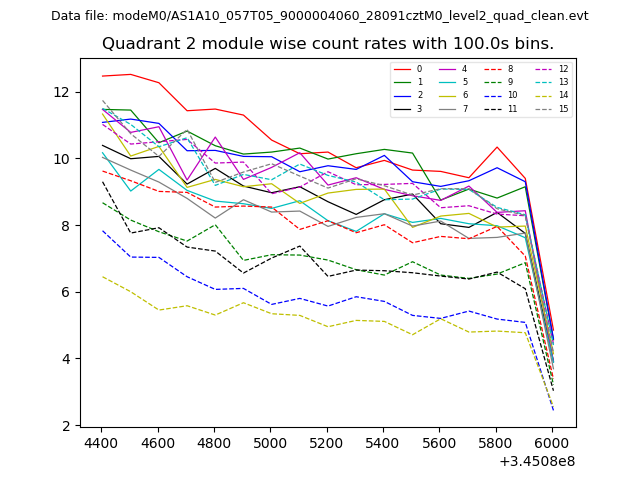
| Module-wise count rates for Quadrant B Data is divided into 100 sec bins |
 |
 |
| Module-wise count rates for Quadrant C Data is divided into 100 sec bins |
 |
 |
| Module-wise count rates for Quadrant D Data is divided into 100 sec bins |
 |
 |
| Parameter | Plot |
|---|---|
| CZT HV Monitor | 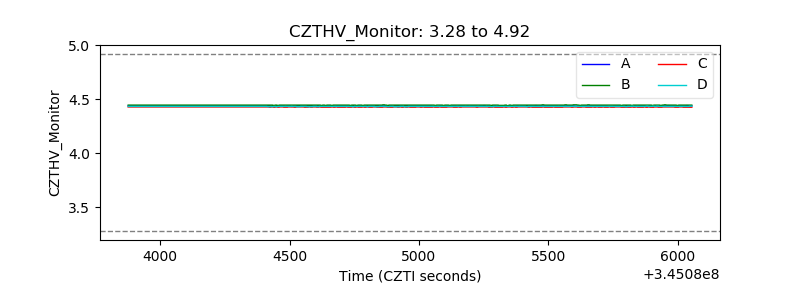 |
| D_VDD |  |
| Temperature 1 | 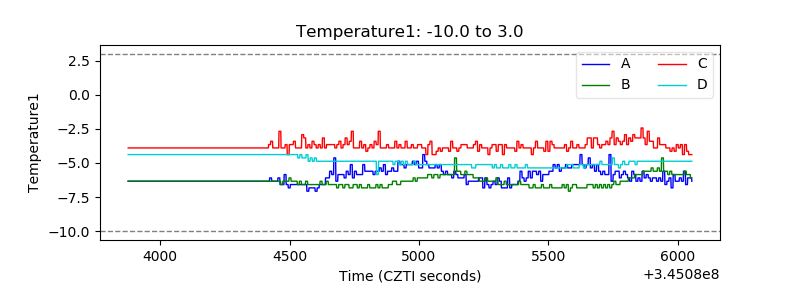 |
| Veto HV Monitor | 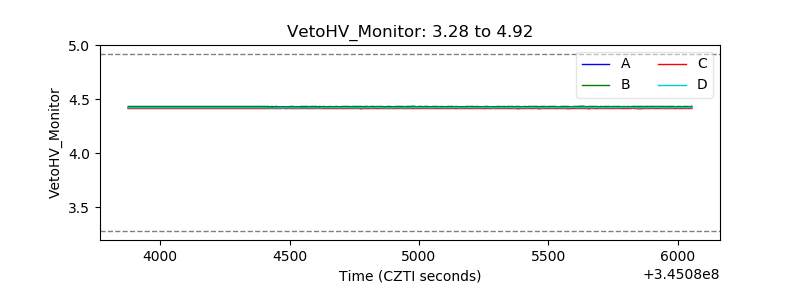 |
| Veto LLD | 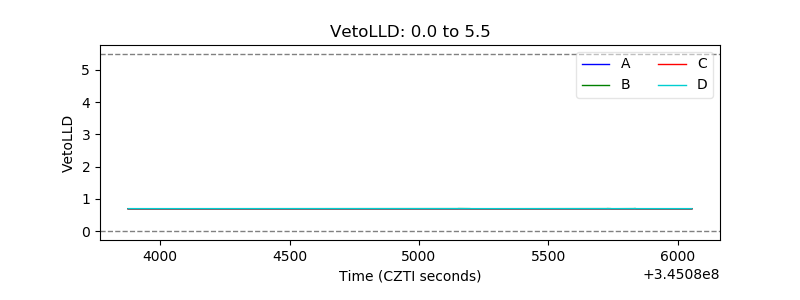 |
| Alpha Counter | 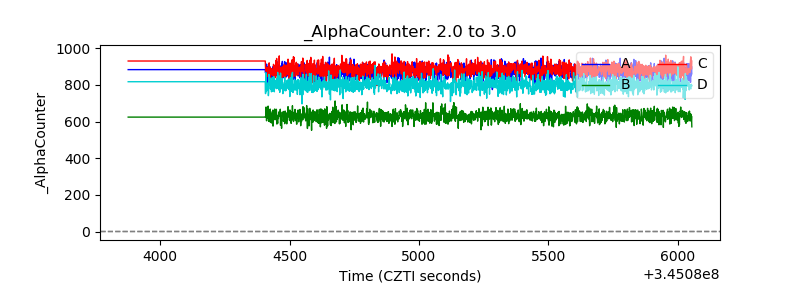 |
| _CPM_Rate | 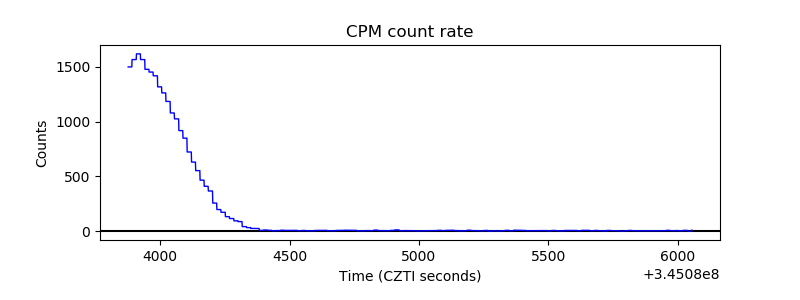 |
| CZT Counter | 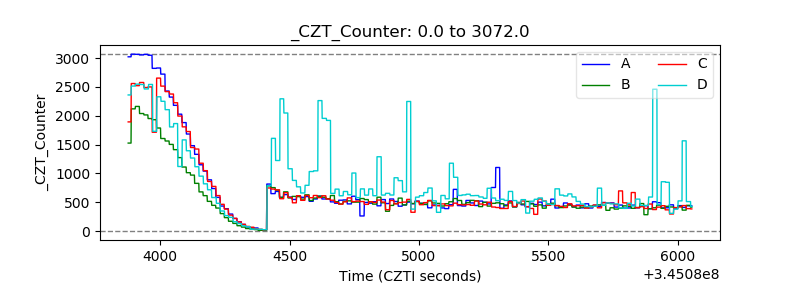 |
| +2.5 Volts monitor |  |
| +5 Volts monitor |  |
| _ROLL_ROT | 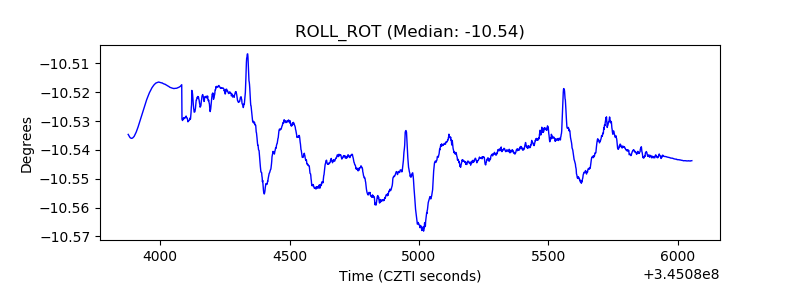 |
| _Roll_DEC | 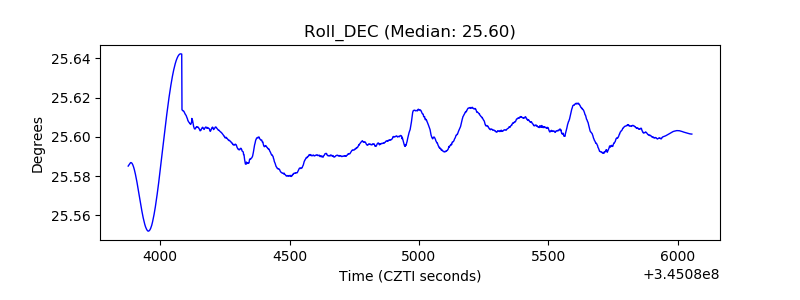 |
| _Roll_RA | 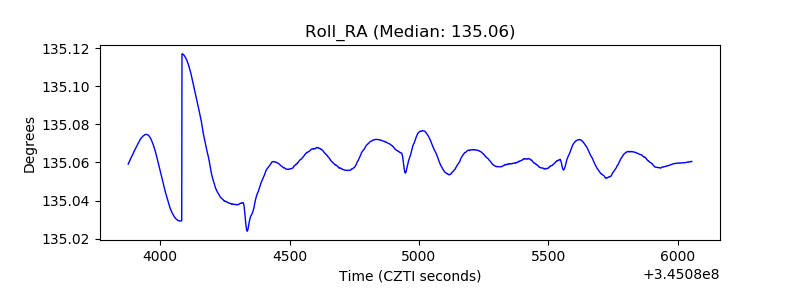 |
| Veto Counter | 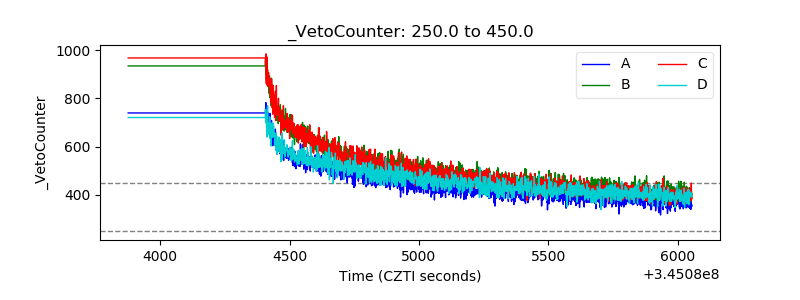 |