| Param | Original file | Final file |
|---|---|---|
| Filename | modeM0/AS1A10_057T05_9000004060_28094cztM0_level2.evt | modeM0/AS1A10_057T05_9000004060_28094cztM0_level2_quad_clean.evt |
| Size (bytes) | 562,069,440 | 103,106,880 |
| Size | 536.0 MB | 98.3 MB |
| Events in quadrant A | 3,447,219 | 698,690 |
| Events in quadrant B | 3,374,092 | 696,597 |
| Events in quadrant C | 3,460,098 | 656,594 |
| Events in quadrant D | 6,295,841 | 612,625 |
| Mode M0 | |||
|---|---|---|---|
| Quadrant | BADHDUFLAG | Total packets | Discarded packets |
| A | 0 | 14038 | 0 |
| B | 0 | 13886 | 0 |
| C | 0 | 14156 | 0 |
| D | 0 | 23116 | 0 |
| Mode M9 | |||
|---|---|---|---|
| Quadrant | BADHDUFLAG | Total packets | Discarded packets |
| A | 0 | 15 | 0 |
| B | 0 | 15 | 0 |
| C | 0 | 16 | 0 |
| D | 0 | 16 | 0 |
| Quadrant | Total seconds | Saturated seconds | Saturation percentage |
|---|---|---|---|
| A | 6566 | 36 | 0.548279% |
| B | 6566 | 46 | 0.700579% |
| C | 6566 | 72 | 1.096558% |
| D | 6566 | 814 | 12.397198% |
Noise dominated data is calculated using 1-second bins in cleaned event files. If a bin has >2000 counts, and if more than 50% of those come from <1% of pixels, then it is considered to be noise-dominated and hence unusable.
| Quadrant | # 1 sec bins | Bins with >0 counts | Bins with >2000 counts | High rate bins dominated by noise | Noise dominated (total time) | Noise dominated (detector-on time) | Marked lightcurve |
|---|---|---|---|---|---|---|---|
| A | 7796 | 6567 | 0 | 0 | 0.00% | 0.00% | 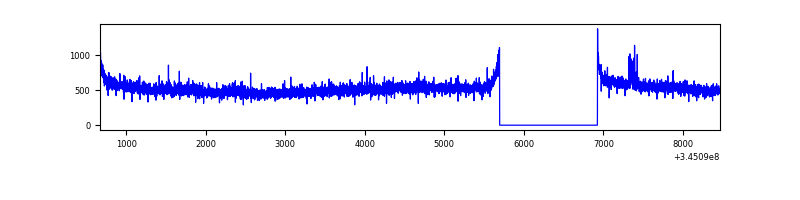 |
| B | 7796 | 6567 | 1 | 1 | 0.01% | 0.02% | 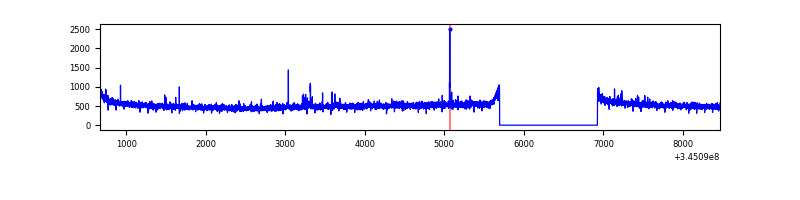 |
| C | 7796 | 6567 | 2 | 2 | 0.03% | 0.03% | 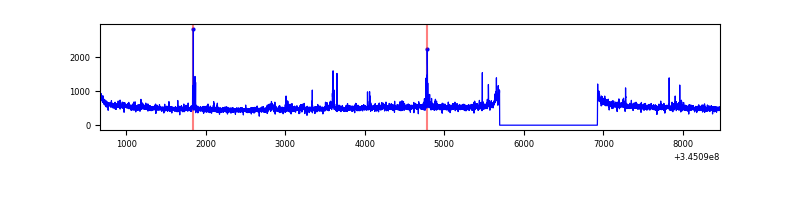 |
| D | 7796 | 6566 | 701 | 701 | 8.99% | 10.68% | 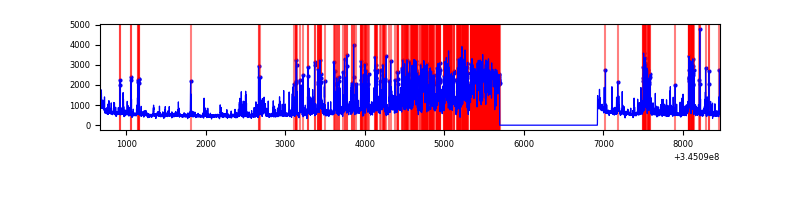 |
Top three noisy pixels from each quadrant. If the there are fewer than three noisy pixels in the level2.evt file, extra rows are filled as -1
| Pixel properties | Quadrant properties | ||||||
|---|---|---|---|---|---|---|---|
| Quadrant | DetID | PixID | Counts | Sigma | Mean | Median | Sigma |
| A | 0 | 13 | 68989 | 396.98 | 869 | 854 | 171.6 |
| A | 15 | 174 | 21989 | 123.14 | 869 | 854 | 171.6 |
| A | 13 | 254 | 11253 | 60.59 | 869 | 854 | 171.6 |
| B | 12 | 111 | 18942 | 113.63 | 851 | 829 | 159.4 |
| B | 11 | 111 | 17251 | 103.03 | 851 | 829 | 159.4 |
| B | 0 | 190 | 16431 | 97.88 | 851 | 829 | 159.4 |
| C | 14 | 238 | 136193 | 716.72 | 817 | 823 | 188.9 |
| C | 3 | 233 | 116783 | 613.95 | 817 | 823 | 188.9 |
| C | 15 | 208 | 24738 | 126.62 | 817 | 823 | 188.9 |
| D | 12 | 1 | 2026501 | 11000.71 | 781 | 763 | 184.1 |
| D | 1 | 52 | 788633 | 4278.51 | 781 | 763 | 184.1 |
| D | 8 | 195 | 334423 | 1811.93 | 781 | 763 | 184.1 |
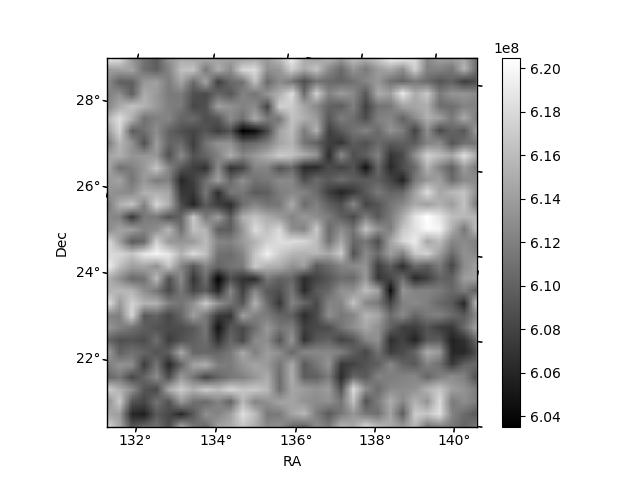
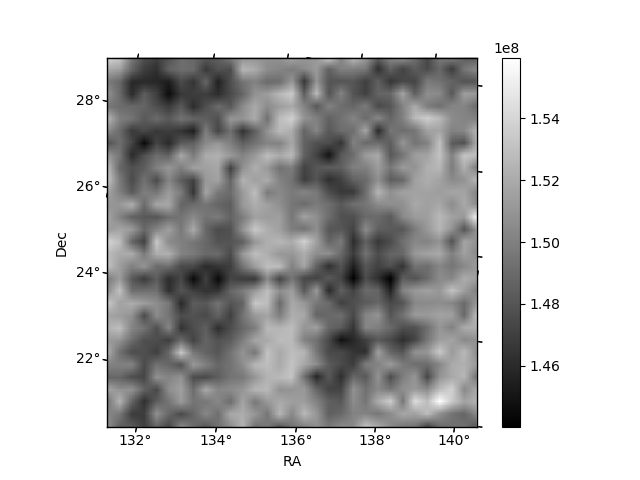
Histogram calculated using DETX and DETY for each event in the final _common_clean file
| Quadrant A | 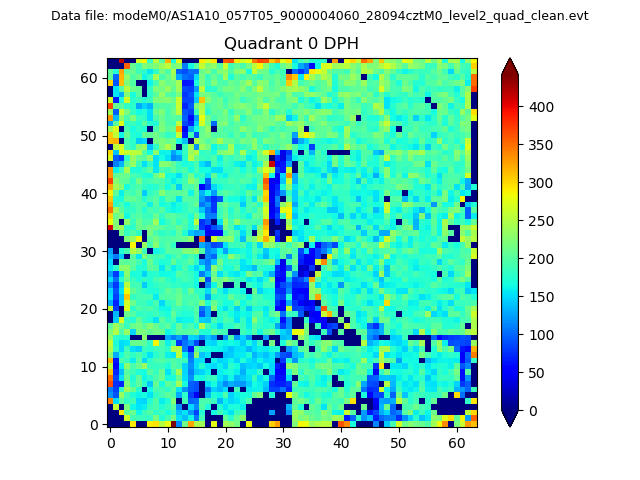 |
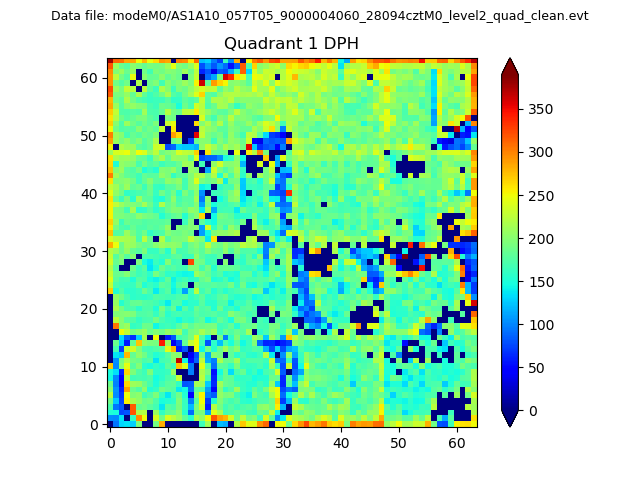 |
Quadrant B |
|---|---|---|---|
| Quadrant D | 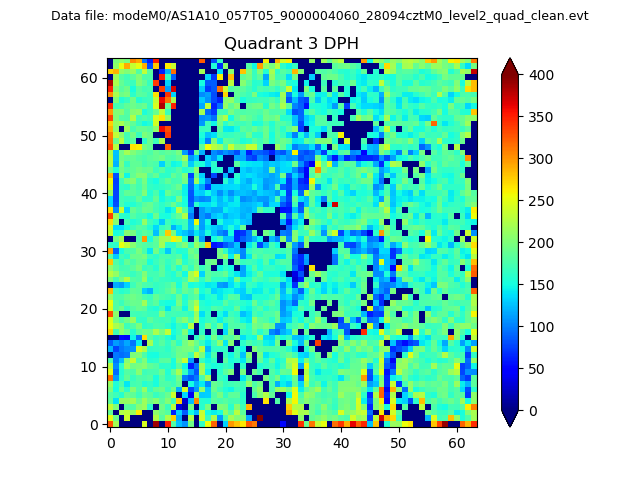 |
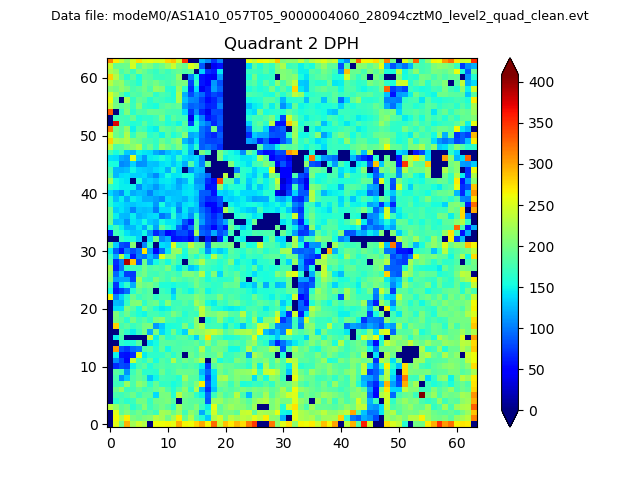 |
Quadrant C |
| Plot type | Count rate plots | Images |
|---|---|---|
| Comparison with Poisson distribution Blue bars denote a histogram of data divided into 1 sec bins. Red curve is a Poisson curve with rate = median count rate of data. |
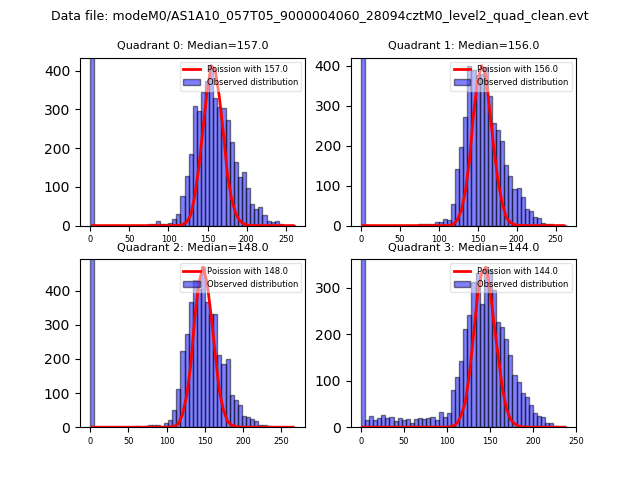 |
 |
| Quadrant-wise count rates Data is divided into 100 sec bins |
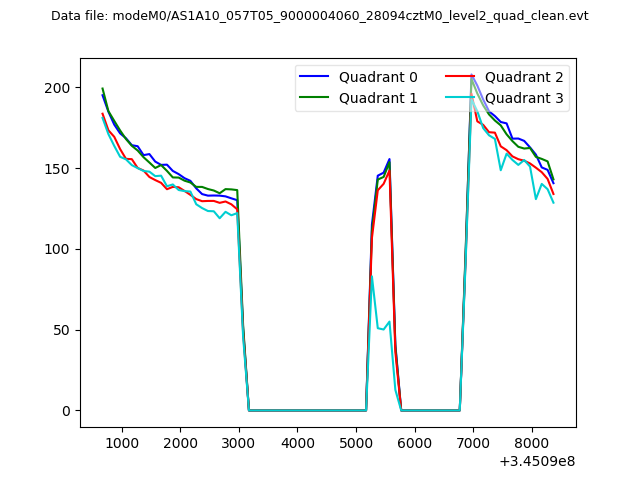 |
|
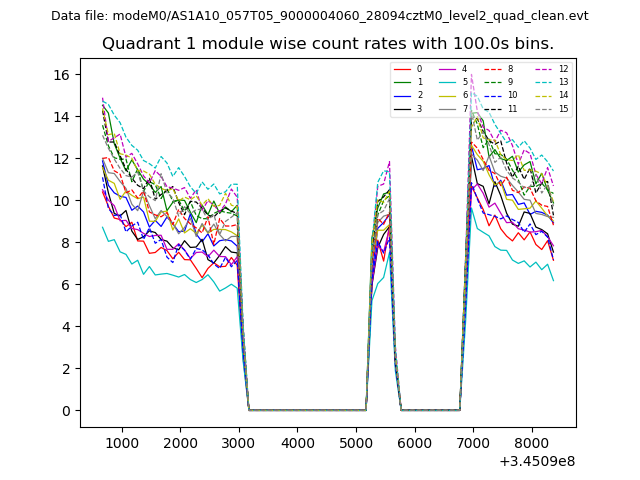
| Module-wise count rates for Quadrant A Data is divided into 100 sec bins |
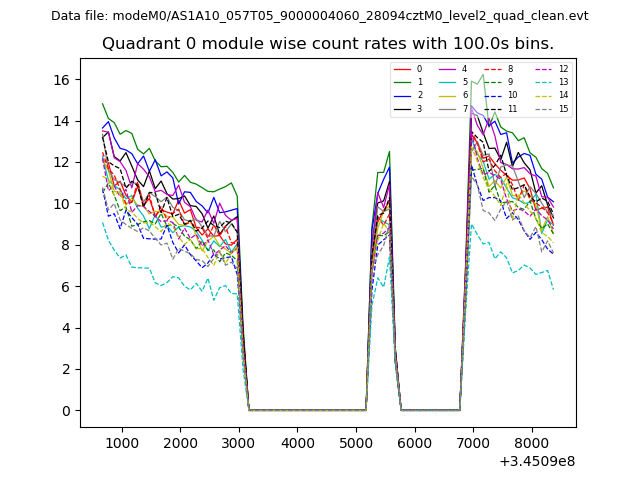 |
 |
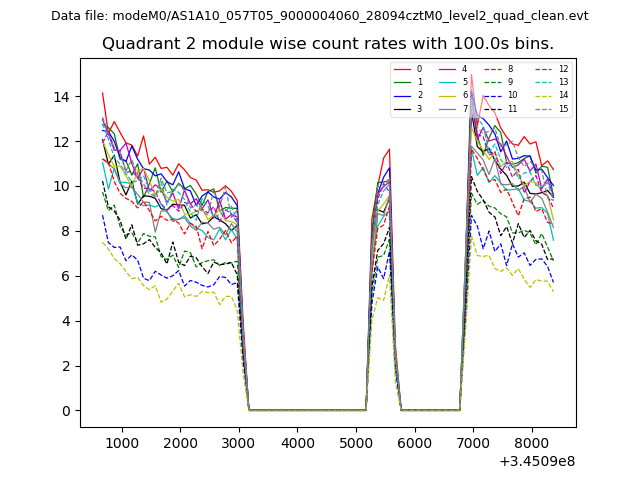
| Module-wise count rates for Quadrant B Data is divided into 100 sec bins |
 |
 |
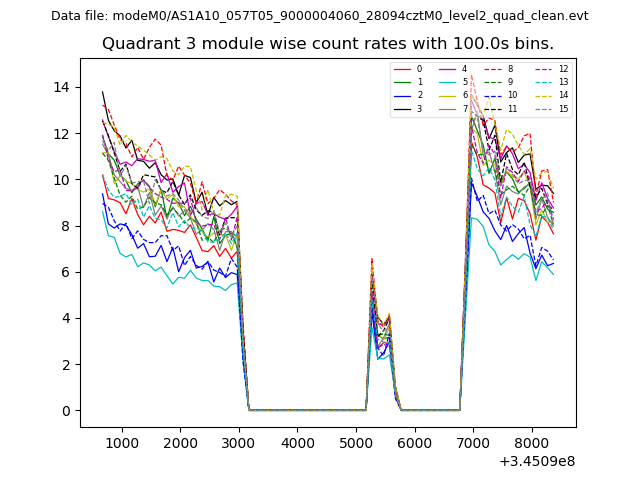
| Module-wise count rates for Quadrant C Data is divided into 100 sec bins |
 |
 |
| Module-wise count rates for Quadrant D Data is divided into 100 sec bins |
 |
 |
| Parameter | Plot |
|---|---|
| CZT HV Monitor | 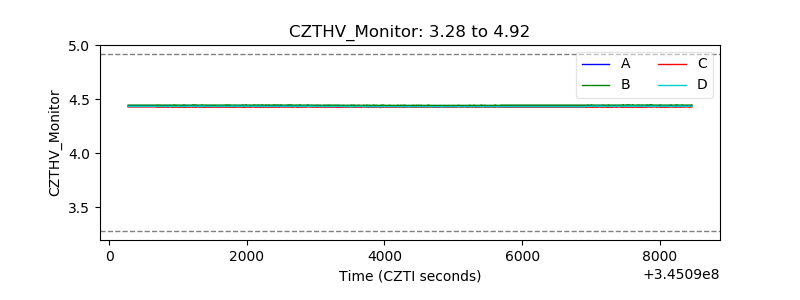 |
| D_VDD | 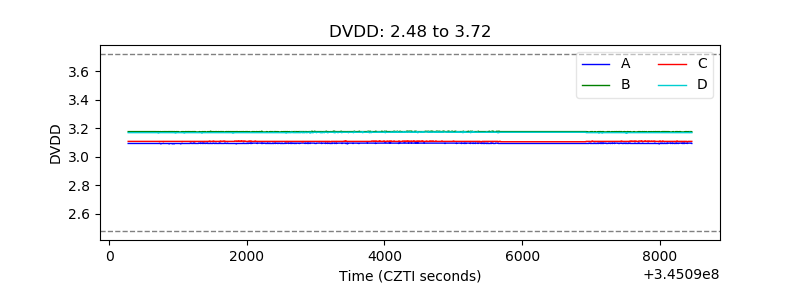 |
| Temperature 1 | 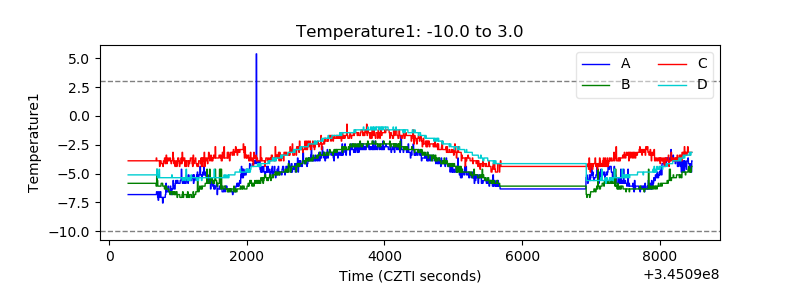 |
| Veto HV Monitor | 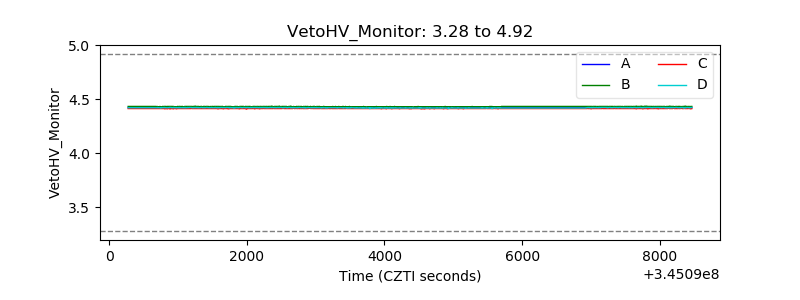 |
| Veto LLD | 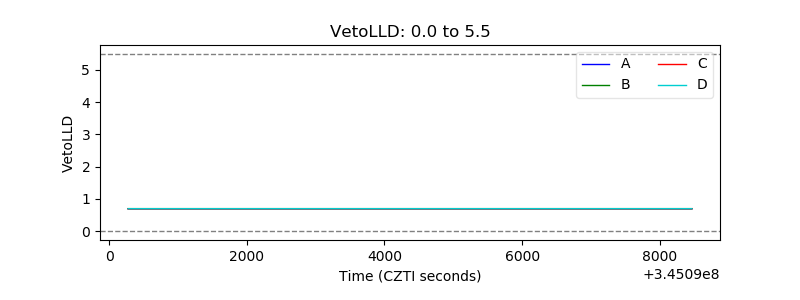 |
| Alpha Counter | 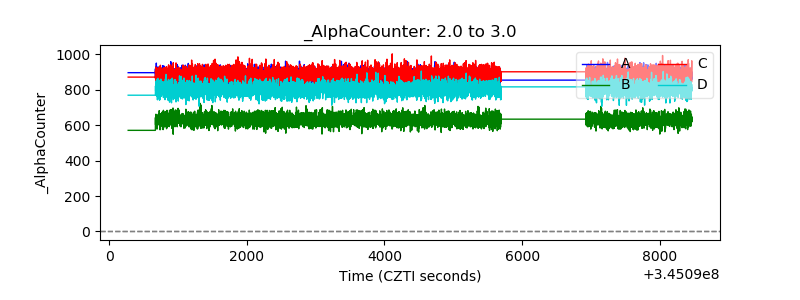 |
| _CPM_Rate | 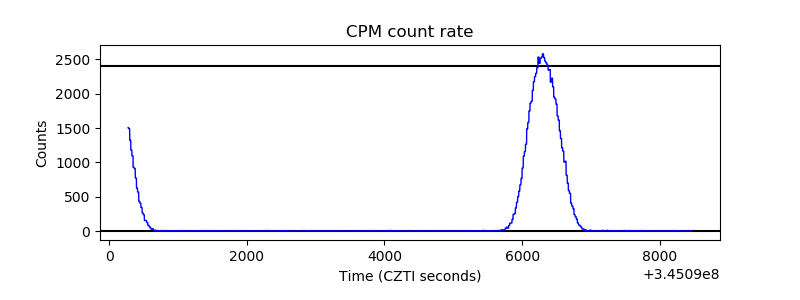 |
| CZT Counter | 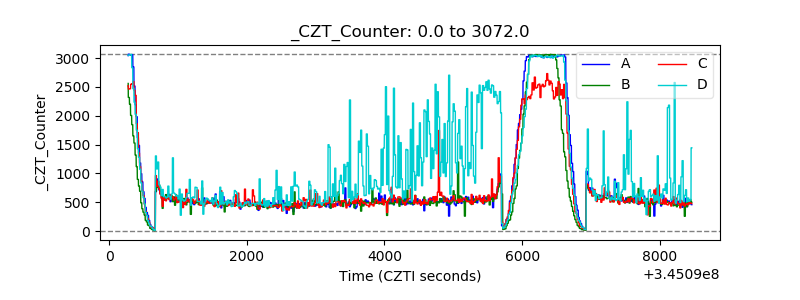 |
| +2.5 Volts monitor |  |
| +5 Volts monitor |  |
| _ROLL_ROT | 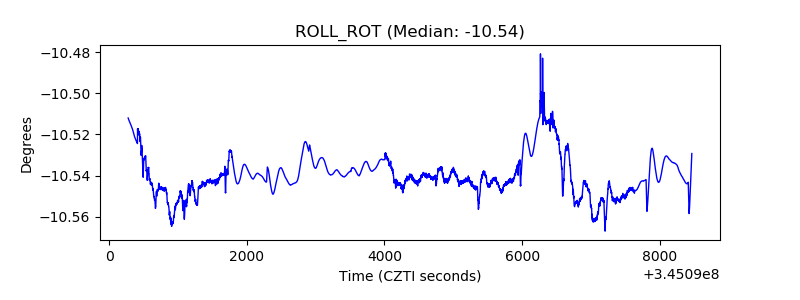 |
| _Roll_DEC | 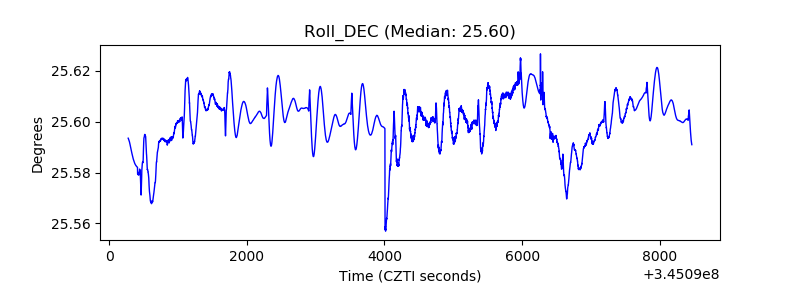 |
| _Roll_RA | 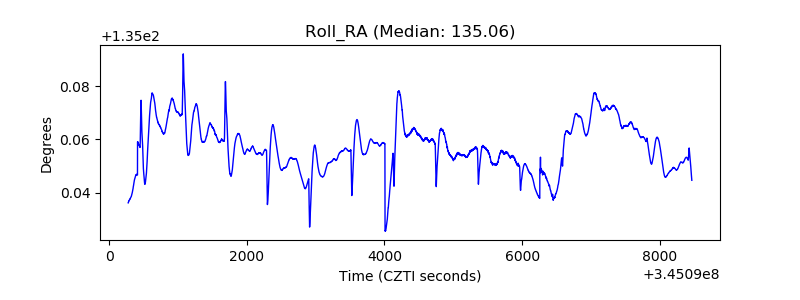 |
| Veto Counter | 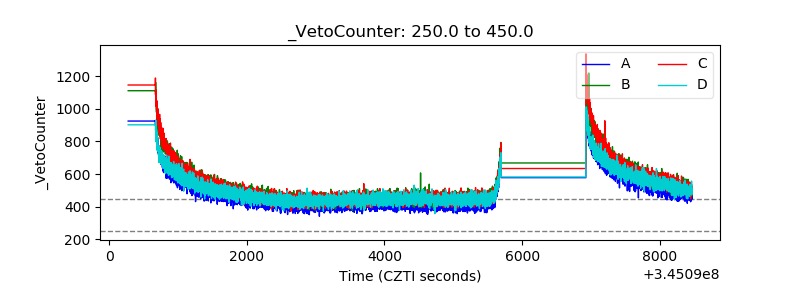 |