| Param | Original file | Final file |
|---|---|---|
| Filename | modeM0/AS1A10_057T05_9000004060_28095cztM0_level2.evt | modeM0/AS1A10_057T05_9000004060_28095cztM0_level2_quad_clean.evt |
| Size (bytes) | 630,262,080 | 100,442,880 |
| Size | 601.1 MB | 95.8 MB |
| Events in quadrant A | 3,433,210 | 697,768 |
| Events in quadrant B | 3,340,936 | 692,335 |
| Events in quadrant C | 3,363,996 | 653,716 |
| Events in quadrant D | 8,522,676 | 558,188 |
| Mode M0 | |||
|---|---|---|---|
| Quadrant | BADHDUFLAG | Total packets | Discarded packets |
| A | 0 | 13837 | 0 |
| B | 0 | 13456 | 0 |
| C | 0 | 13577 | 0 |
| D | 0 | 29590 | 0 |
| Mode M9 | |||
|---|---|---|---|
| Quadrant | BADHDUFLAG | Total packets | Discarded packets |
| A | 0 | 15 | 0 |
| B | 0 | 16 | 0 |
| C | 0 | 16 | 0 |
| D | 0 | 16 | 0 |
| Quadrant | Total seconds | Saturated seconds | Saturation percentage |
|---|---|---|---|
| A | 6298 | 38 | 0.603366% |
| B | 6298 | 51 | 0.809781% |
| C | 6298 | 79 | 1.254366% |
| D | 6297 | 2272 | 36.080673% |
Noise dominated data is calculated using 1-second bins in cleaned event files. If a bin has >2000 counts, and if more than 50% of those come from <1% of pixels, then it is considered to be noise-dominated and hence unusable.
| Quadrant | # 1 sec bins | Bins with >0 counts | Bins with >2000 counts | High rate bins dominated by noise | Noise dominated (total time) | Noise dominated (detector-on time) | Marked lightcurve |
|---|---|---|---|---|---|---|---|
| A | 7608 | 6299 | 0 | 0 | 0.00% | 0.00% | 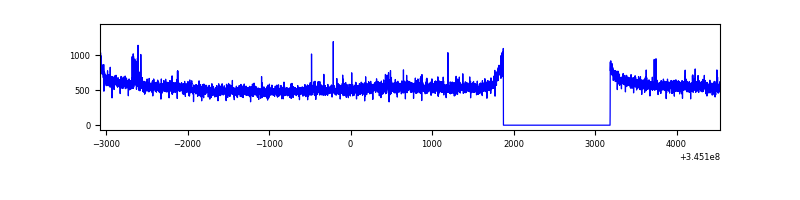 |
| B | 7608 | 6299 | 0 | 0 | 0.00% | 0.00% | 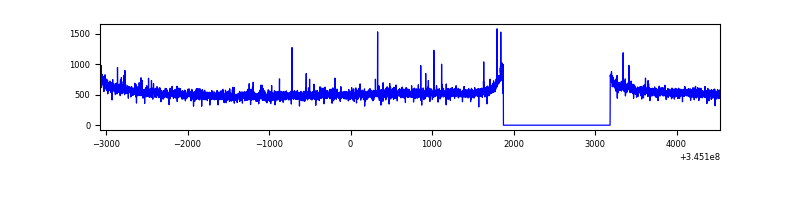 |
| C | 7608 | 6299 | 0 | 0 | 0.00% | 0.00% | 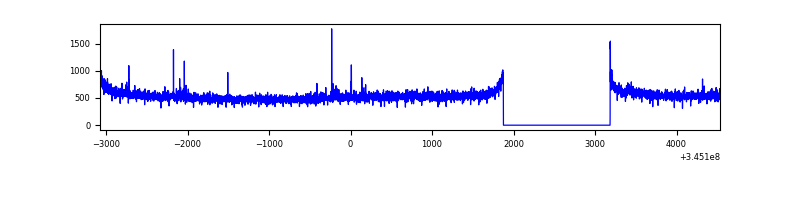 |
| D | 7607 | 6297 | 2010 | 2010 | 26.42% | 31.92% | 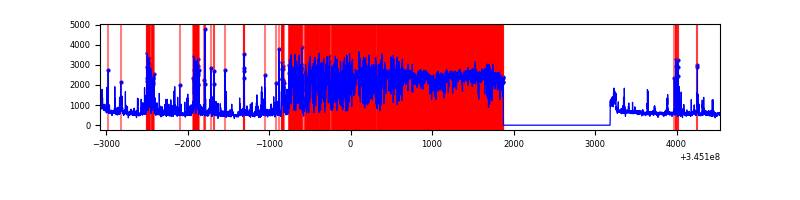 |
Top three noisy pixels from each quadrant. If the there are fewer than three noisy pixels in the level2.evt file, extra rows are filled as -1
| Pixel properties | Quadrant properties | ||||||
|---|---|---|---|---|---|---|---|
| Quadrant | DetID | PixID | Counts | Sigma | Mean | Median | Sigma |
| A | 0 | 13 | 60925 | 352.07 | 868 | 854 | 170.6 |
| A | 15 | 174 | 23081 | 130.27 | 868 | 854 | 170.6 |
| A | 13 | 254 | 10152 | 54.49 | 868 | 854 | 170.6 |
| B | 12 | 111 | 18559 | 112.71 | 845 | 825 | 157.3 |
| B | 11 | 111 | 16824 | 101.68 | 845 | 825 | 157.3 |
| B | 14 | 111 | 15882 | 95.7 | 845 | 825 | 157.3 |
| C | 14 | 238 | 134088 | 707.02 | 814 | 821 | 188.5 |
| C | 3 | 233 | 37864 | 196.52 | 814 | 821 | 188.5 |
| C | 15 | 208 | 20019 | 101.85 | 814 | 821 | 188.5 |
| D | 12 | 1 | 5132251 | 34057.8 | 644 | 630 | 150.7 |
| D | 1 | 52 | 414802 | 2748.8 | 644 | 630 | 150.7 |
| D | 8 | 195 | 266487 | 1764.45 | 644 | 630 | 150.7 |
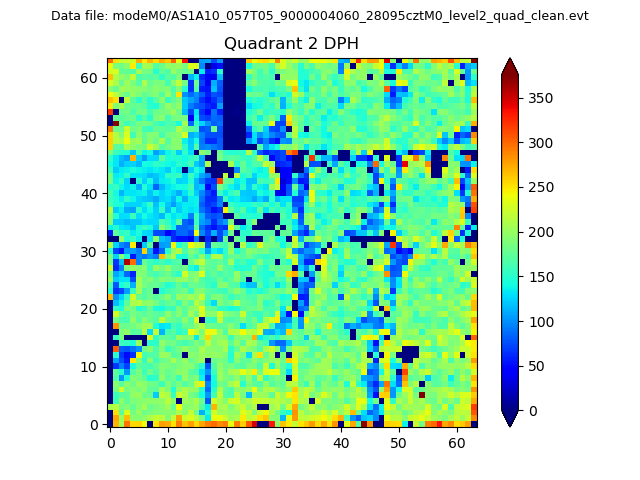
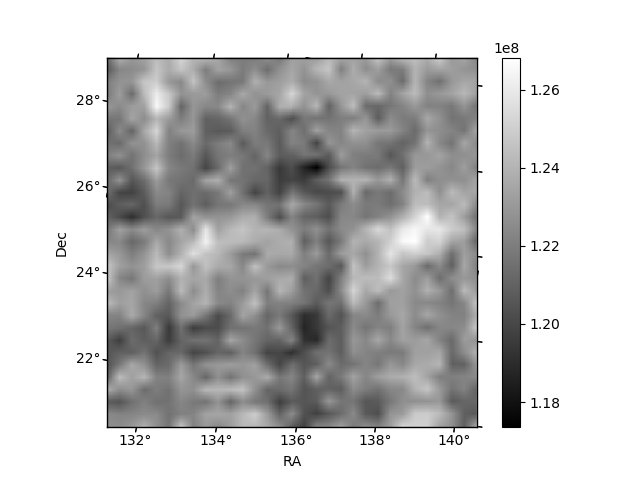
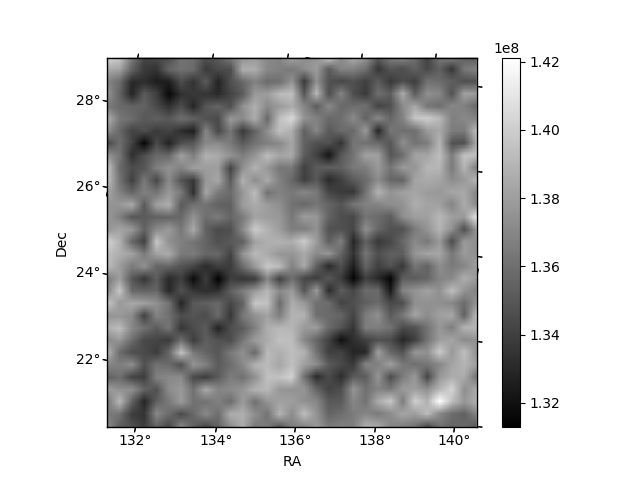
Histogram calculated using DETX and DETY for each event in the final _common_clean file
| Quadrant A | 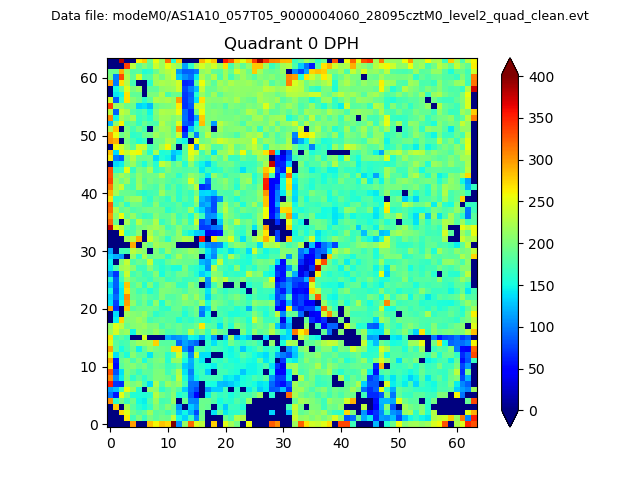 |
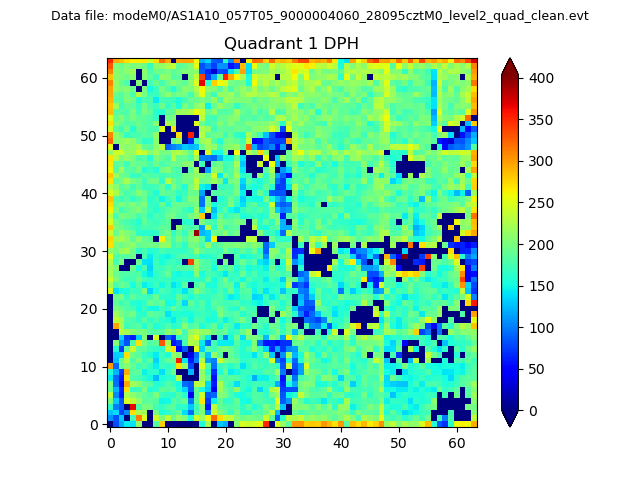 |
Quadrant B |
|---|---|---|---|
| Quadrant D | 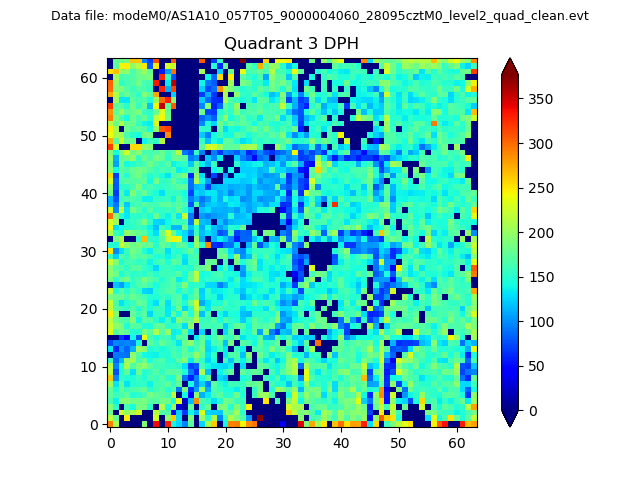 |
 |
Quadrant C |
| Plot type | Count rate plots | Images |
|---|---|---|
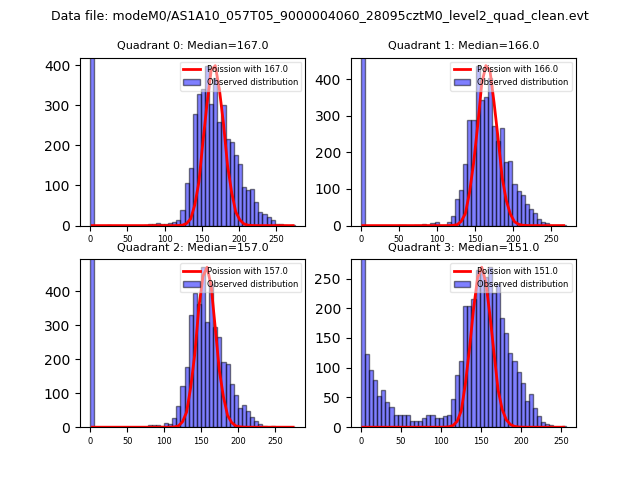
| Comparison with Poisson distribution Blue bars denote a histogram of data divided into 1 sec bins. Red curve is a Poisson curve with rate = median count rate of data. |
 |
 |
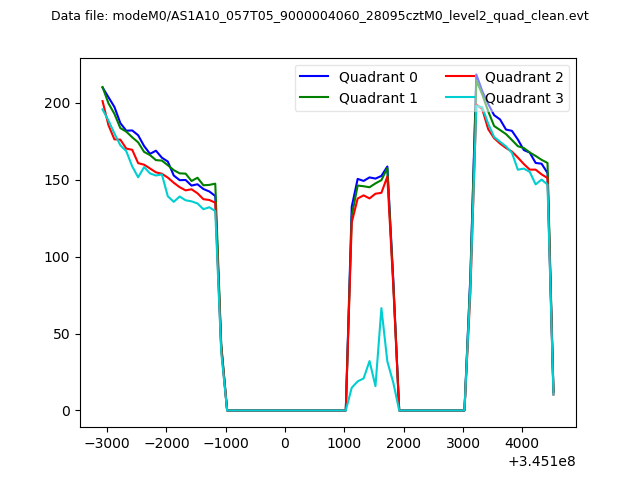
| Quadrant-wise count rates Data is divided into 100 sec bins |
 |
|
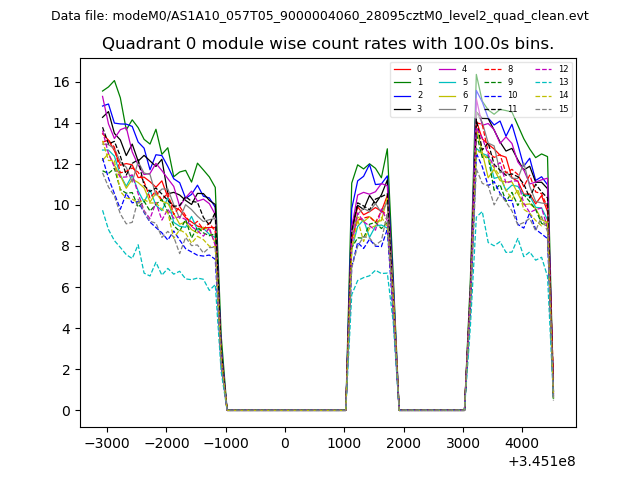
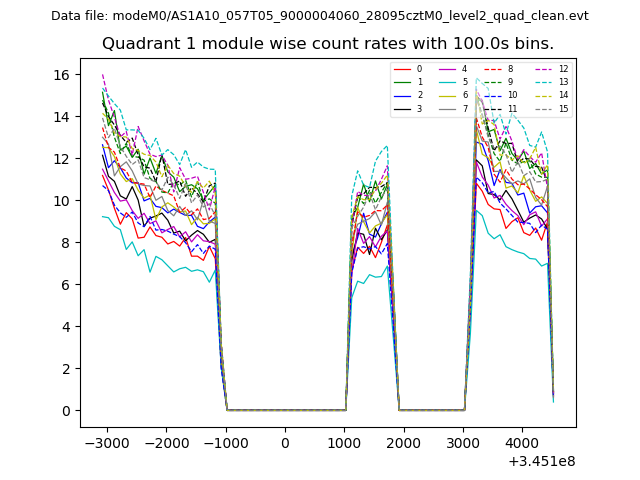
| Module-wise count rates for Quadrant A Data is divided into 100 sec bins |
 |
 |
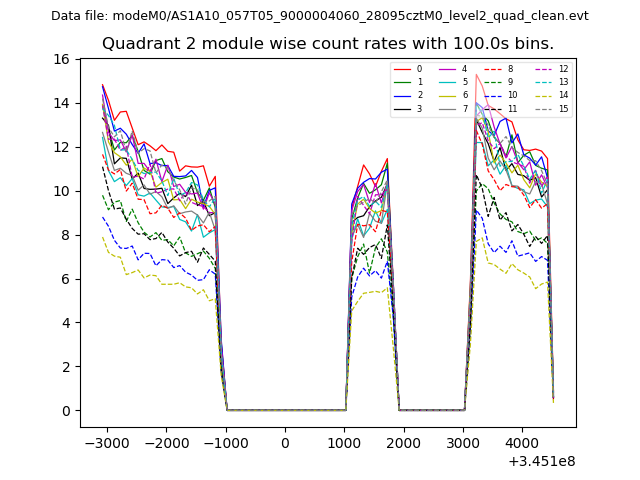
| Module-wise count rates for Quadrant B Data is divided into 100 sec bins |
 |
 |
| Module-wise count rates for Quadrant C Data is divided into 100 sec bins |
 |
 |
| Module-wise count rates for Quadrant D Data is divided into 100 sec bins |
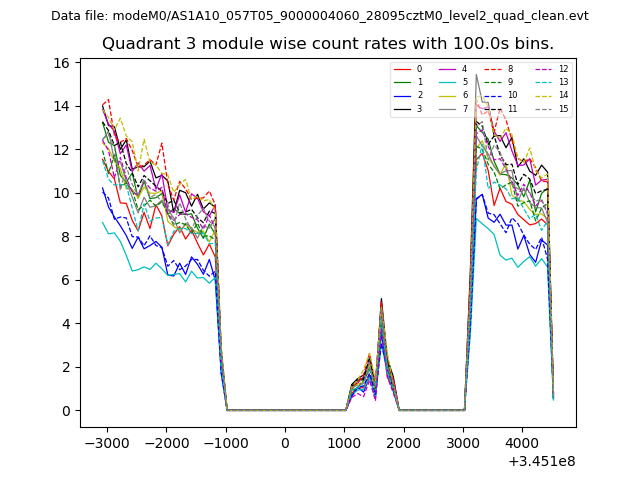 |
 |
| Parameter | Plot |
|---|---|
| CZT HV Monitor | 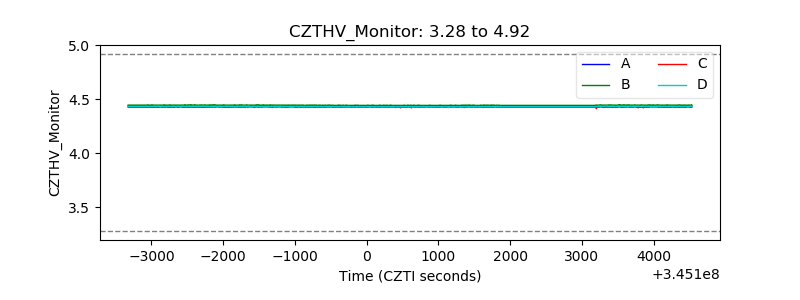 |
| D_VDD | 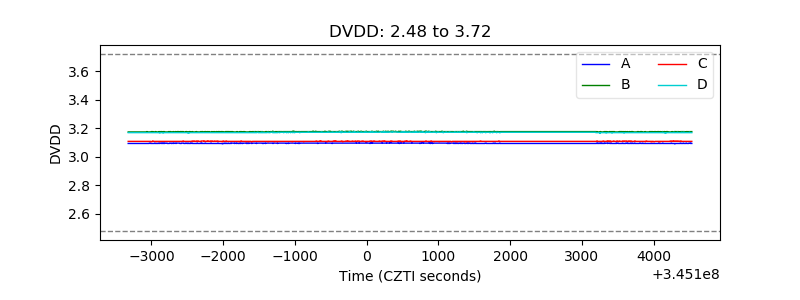 |
| Temperature 1 | 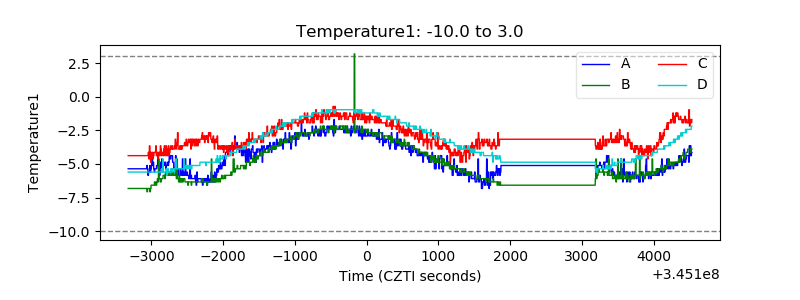 |
| Veto HV Monitor | 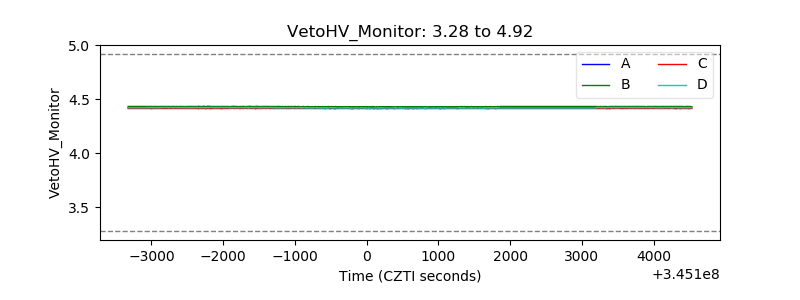 |
| Veto LLD | 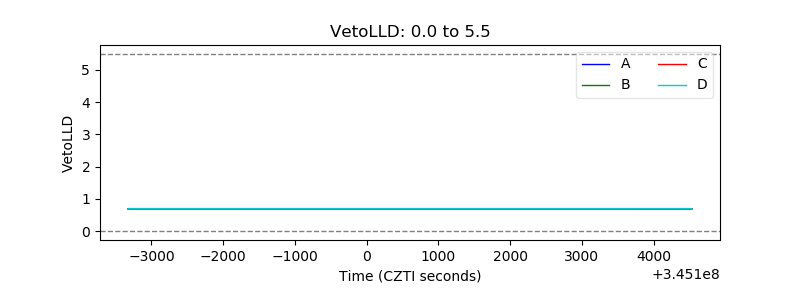 |
| Alpha Counter | 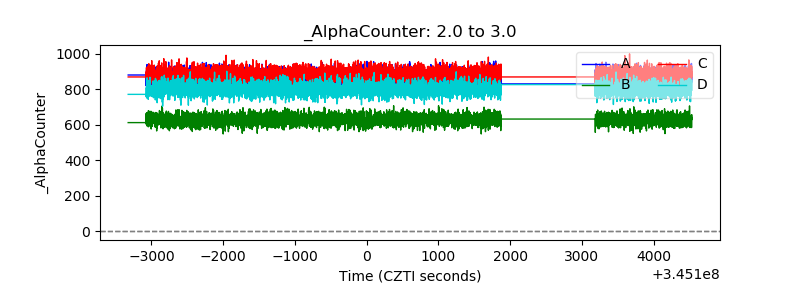 |
| _CPM_Rate | 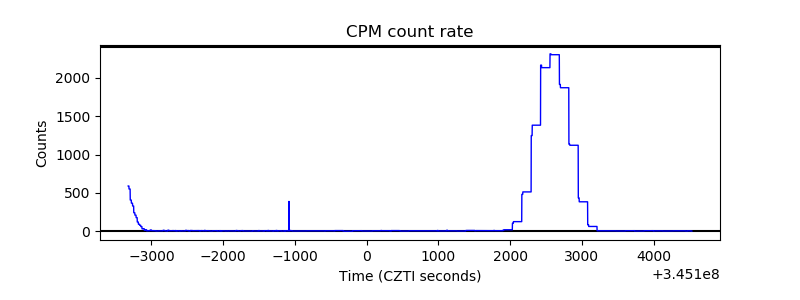 |
| CZT Counter | 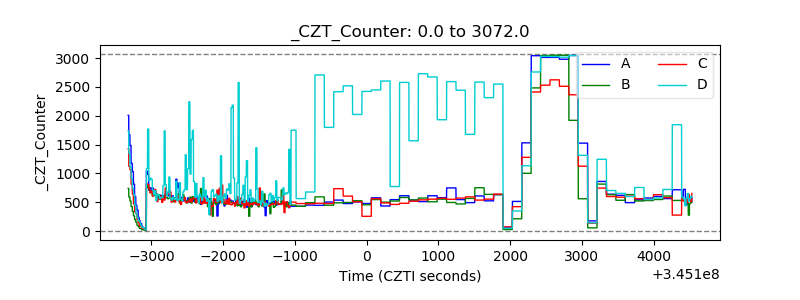 |
| +2.5 Volts monitor |  |
| +5 Volts monitor | 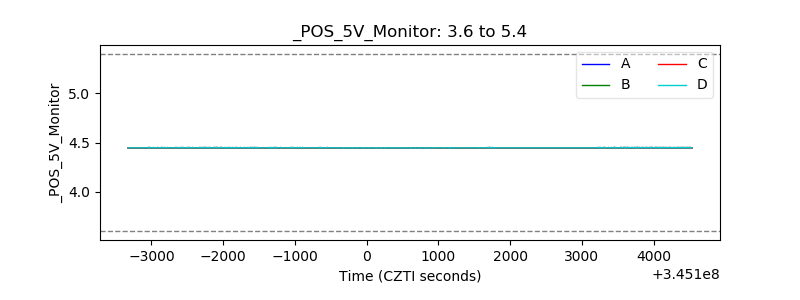 |
| _ROLL_ROT | 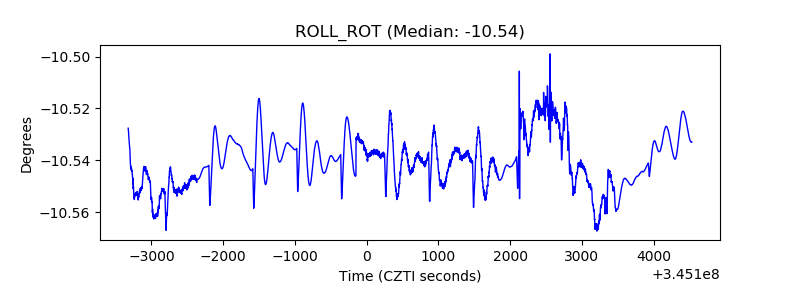 |
| _Roll_DEC | 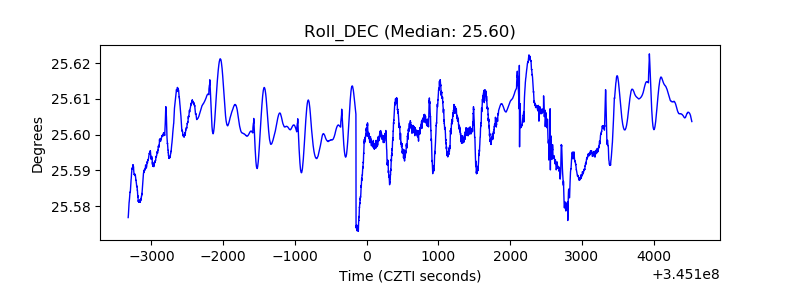 |
| _Roll_RA | 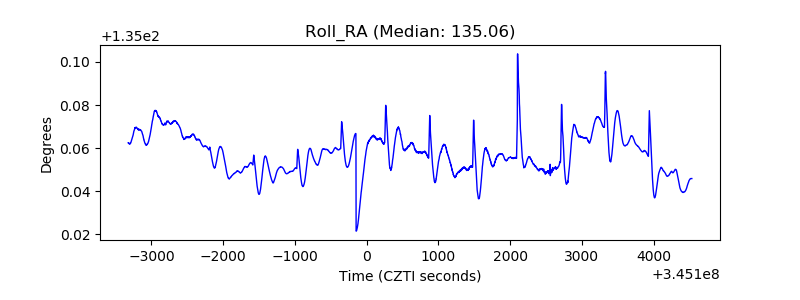 |
| Veto Counter | 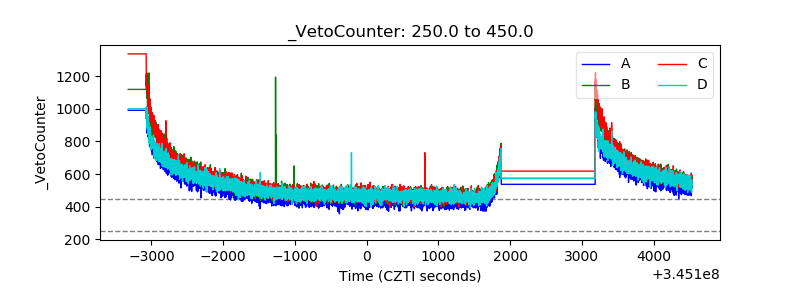 |