| Param | Original file | Final file |
|---|---|---|
| Filename | modeM0/AS1A10_057T05_9000004060_28096cztM0_level2.evt | modeM0/AS1A10_057T05_9000004060_28096cztM0_level2_quad_clean.evt |
| Size (bytes) | 615,795,840 | 99,391,680 |
| Size | 587.3 MB | 94.8 MB |
| Events in quadrant A | 3,427,051 | 672,332 |
| Events in quadrant B | 3,310,864 | 669,018 |
| Events in quadrant C | 3,368,105 | 633,007 |
| Events in quadrant D | 8,124,588 | 603,865 |
| Mode M0 | |||
|---|---|---|---|
| Quadrant | BADHDUFLAG | Total packets | Discarded packets |
| A | 0 | 13697 | 0 |
| B | 0 | 13224 | 0 |
| C | 0 | 13465 | 0 |
| D | 0 | 28458 | 0 |
| Mode M9 | |||
|---|---|---|---|
| Quadrant | BADHDUFLAG | Total packets | Discarded packets |
| A | 0 | 16 | 0 |
| B | 0 | 17 | 0 |
| C | 0 | 17 | 0 |
| D | 0 | 17 | 0 |
| Quadrant | Total seconds | Saturated seconds | Saturation percentage |
|---|---|---|---|
| A | 6184 | 58 | 0.937904% |
| B | 6184 | 61 | 0.986417% |
| C | 6184 | 85 | 1.374515% |
| D | 6184 | 1934 | 31.274256% |
Noise dominated data is calculated using 1-second bins in cleaned event files. If a bin has >2000 counts, and if more than 50% of those come from <1% of pixels, then it is considered to be noise-dominated and hence unusable.
| Quadrant | # 1 sec bins | Bins with >0 counts | Bins with >2000 counts | High rate bins dominated by noise | Noise dominated (total time) | Noise dominated (detector-on time) | Marked lightcurve |
|---|---|---|---|---|---|---|---|
| A | 7504 | 6185 | 0 | 0 | 0.00% | 0.00% | 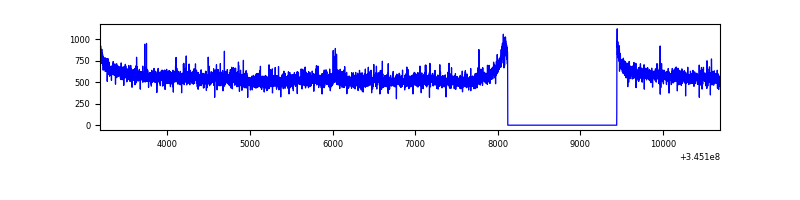 |
| B | 7504 | 6184 | 0 | 0 | 0.00% | 0.00% | 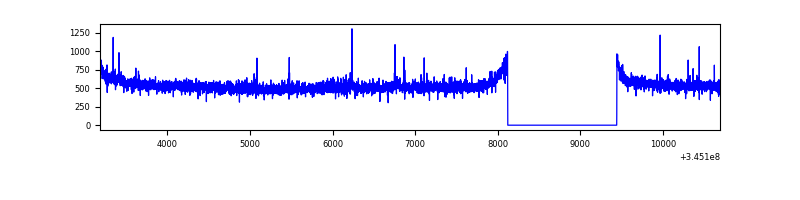 |
| C | 7504 | 6185 | 0 | 0 | 0.00% | 0.00% | 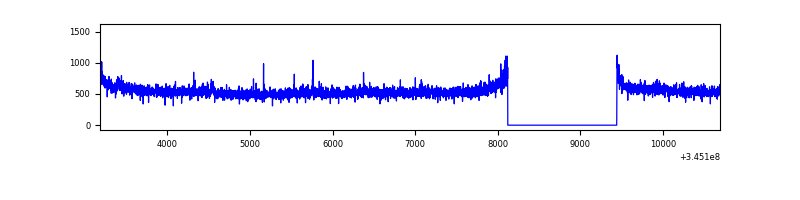 |
| D | 7504 | 6185 | 1759 | 1759 | 23.44% | 28.44% | 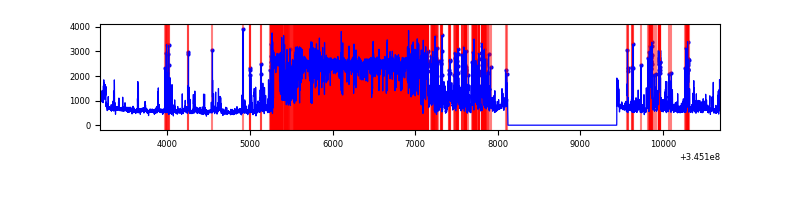 |
Top three noisy pixels from each quadrant. If the there are fewer than three noisy pixels in the level2.evt file, extra rows are filled as -1
| Pixel properties | Quadrant properties | ||||||
|---|---|---|---|---|---|---|---|
| Quadrant | DetID | PixID | Counts | Sigma | Mean | Median | Sigma |
| A | 0 | 13 | 76295 | 441.68 | 869 | 855 | 170.8 |
| A | 13 | 254 | 10553 | 56.78 | 869 | 855 | 170.8 |
| A | 0 | 226 | 7629 | 39.66 | 869 | 855 | 170.8 |
| B | 12 | 111 | 18345 | 112.42 | 839 | 818 | 155.9 |
| B | 11 | 111 | 16754 | 102.22 | 839 | 818 | 155.9 |
| B | 14 | 111 | 15913 | 96.82 | 839 | 818 | 155.9 |
| C | 14 | 238 | 135193 | 711.35 | 815 | 822 | 188.9 |
| C | 3 | 233 | 48411 | 251.93 | 815 | 822 | 188.9 |
| C | 15 | 208 | 10863 | 53.16 | 815 | 822 | 188.9 |
| D | 12 | 1 | 3791734 | 23321.14 | 687 | 671 | 162.6 |
| D | 1 | 52 | 865811 | 5322.0 | 687 | 671 | 162.6 |
| D | 8 | 195 | 360103 | 2211.09 | 687 | 671 | 162.6 |
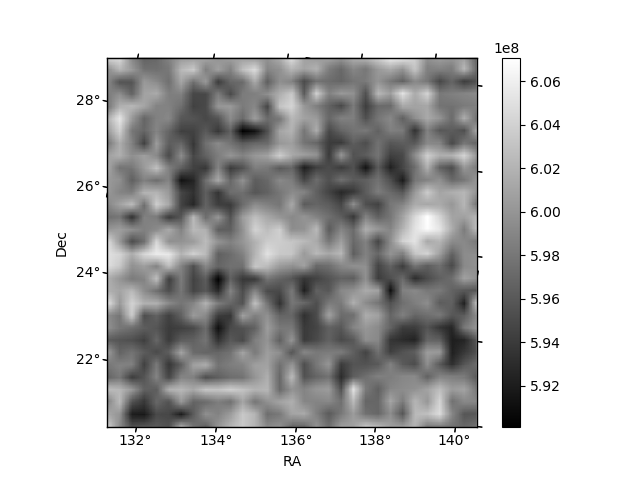
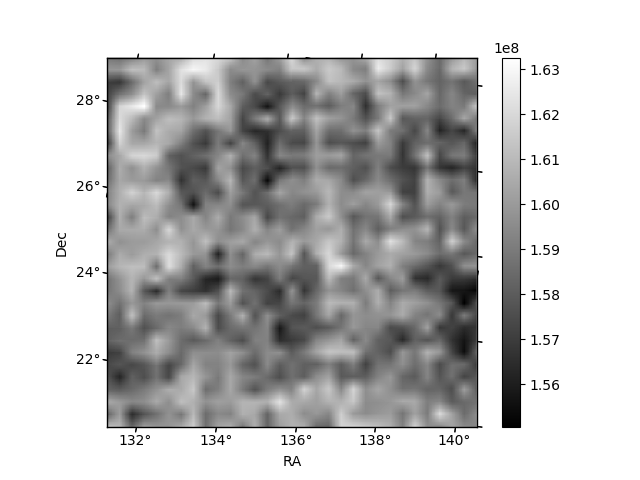
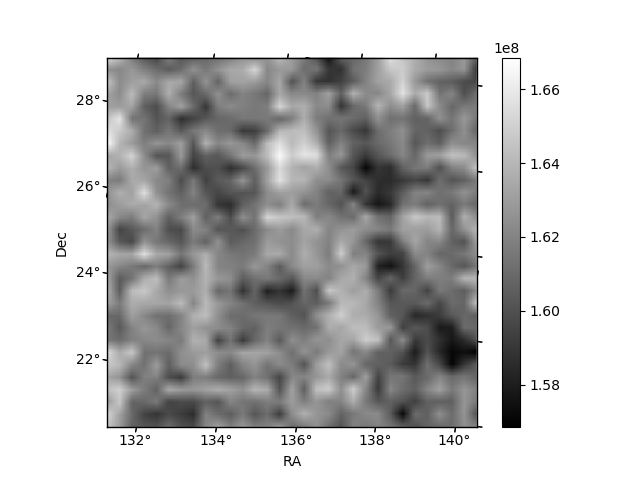
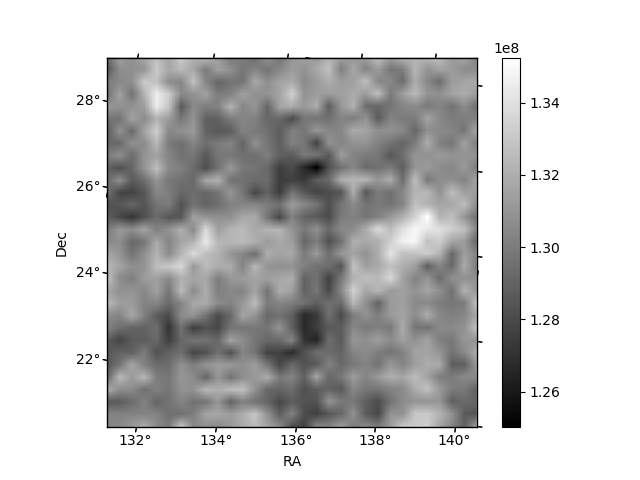
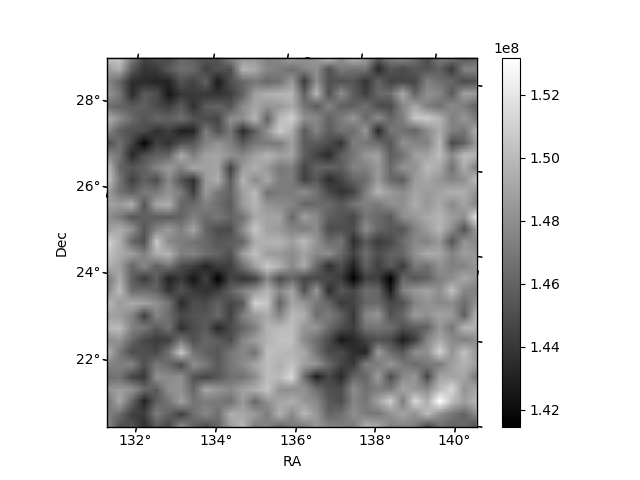
Histogram calculated using DETX and DETY for each event in the final _common_clean file
| Quadrant A | 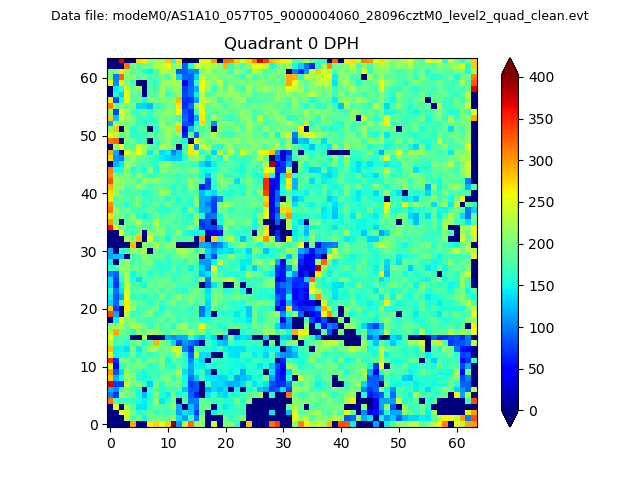 |
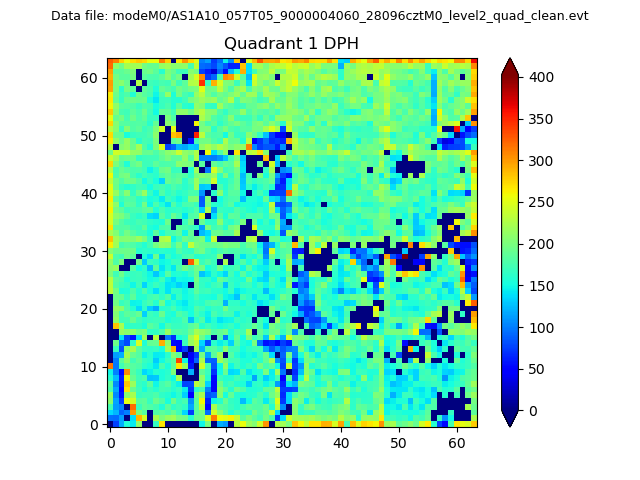 |
Quadrant B |
|---|---|---|---|
| Quadrant D | 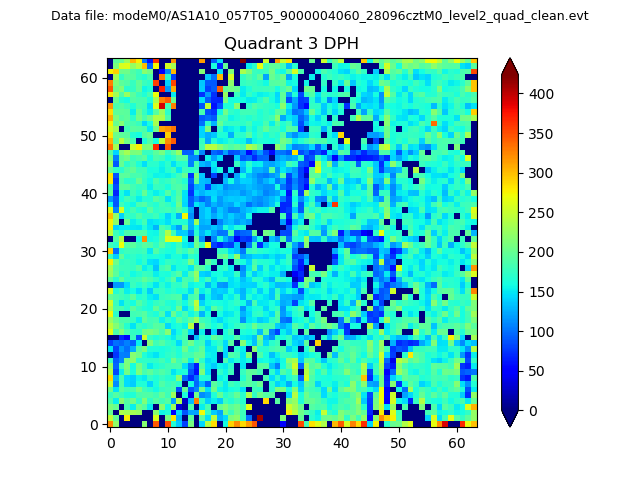 |
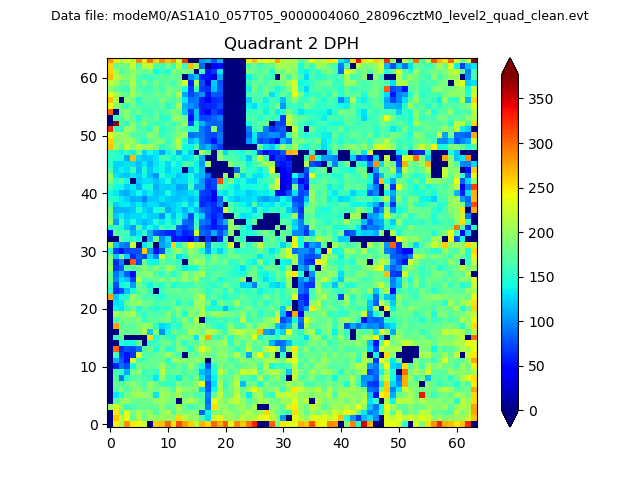 |
Quadrant C |
| Plot type | Count rate plots | Images |
|---|---|---|
| Comparison with Poisson distribution Blue bars denote a histogram of data divided into 1 sec bins. Red curve is a Poisson curve with rate = median count rate of data. |
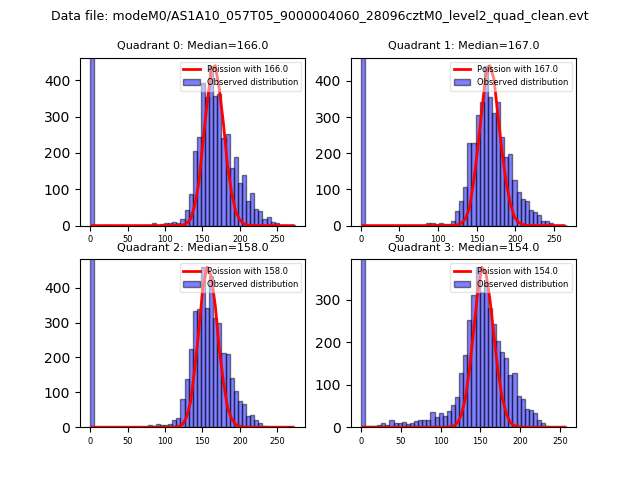 |
 |
| Quadrant-wise count rates Data is divided into 100 sec bins |
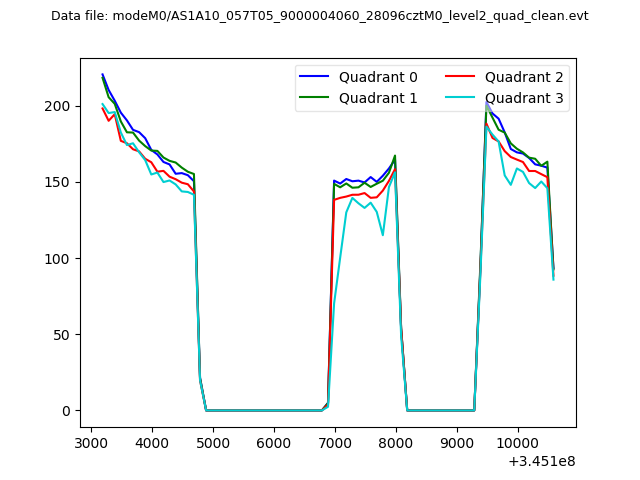 |
|
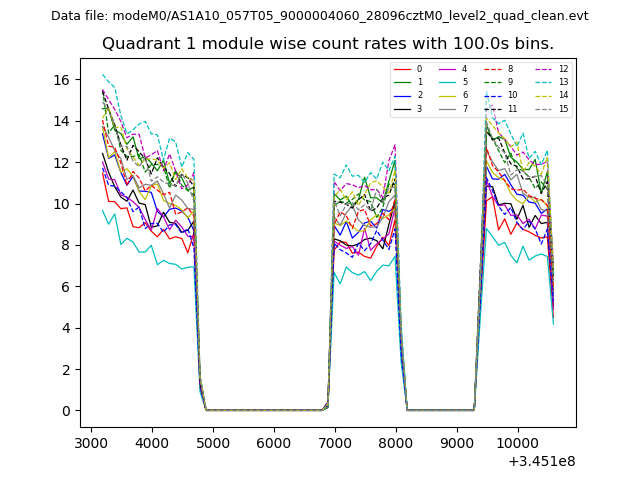
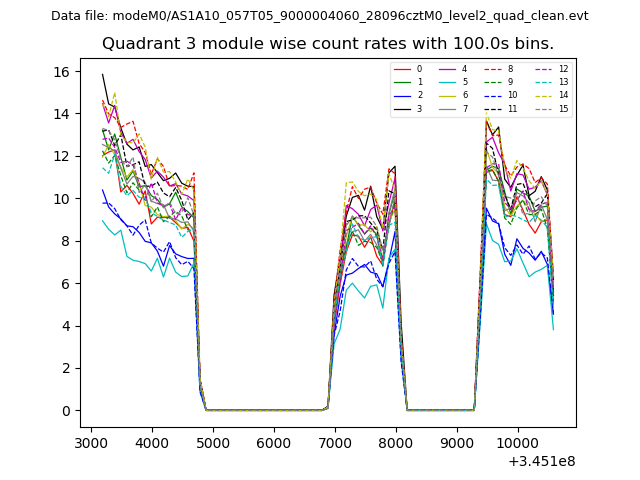
| Module-wise count rates for Quadrant A Data is divided into 100 sec bins |
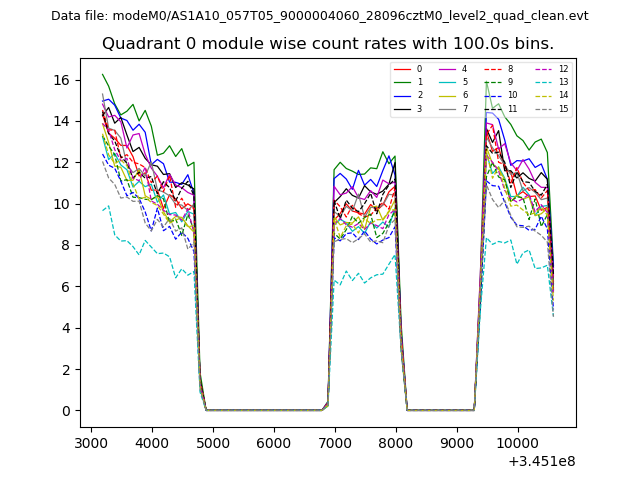 |
 |
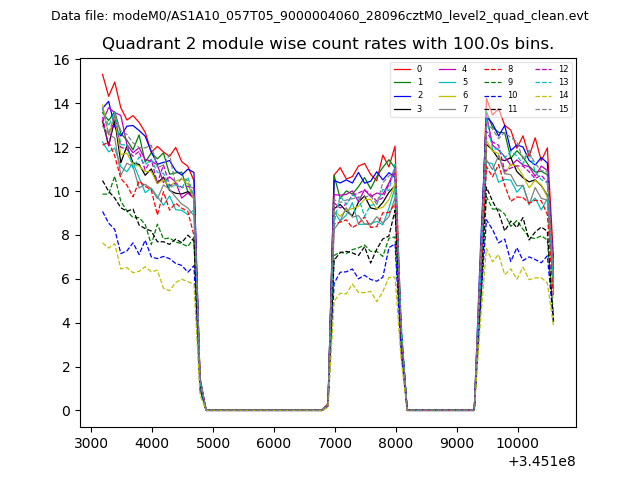
| Module-wise count rates for Quadrant B Data is divided into 100 sec bins |
 |
 |
| Module-wise count rates for Quadrant C Data is divided into 100 sec bins |
 |
 |
| Module-wise count rates for Quadrant D Data is divided into 100 sec bins |
 |
 |
| Parameter | Plot |
|---|---|
| CZT HV Monitor | 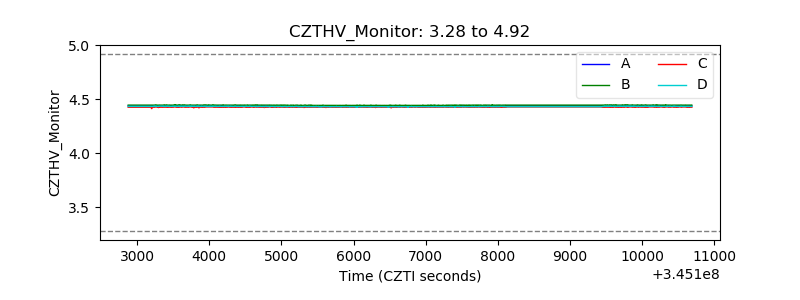 |
| D_VDD | 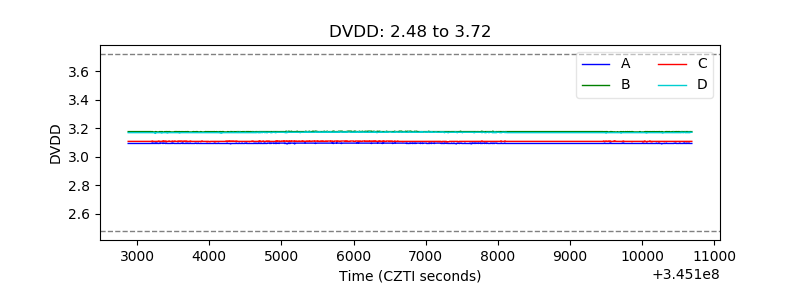 |
| Temperature 1 |  |
| Veto HV Monitor | 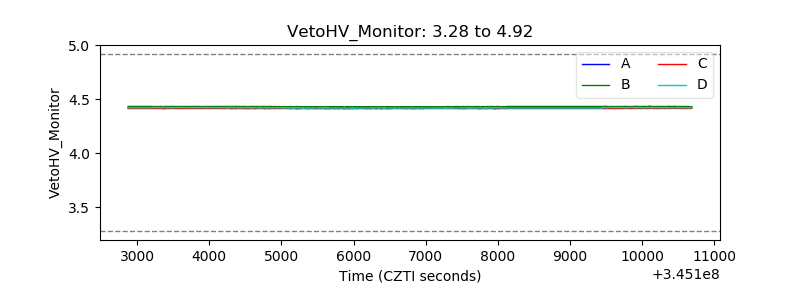 |
| Veto LLD | 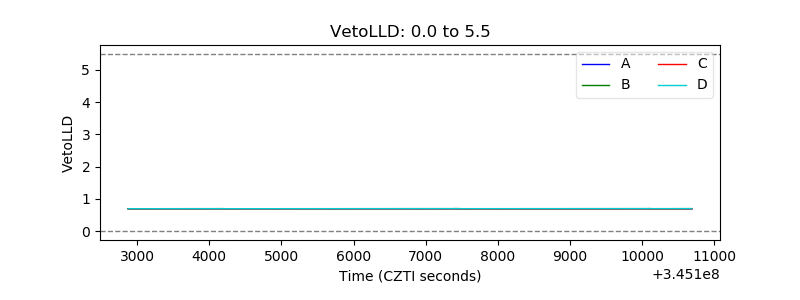 |
| Alpha Counter | 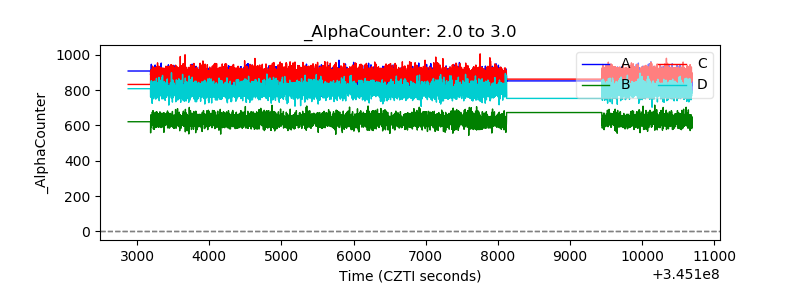 |
| _CPM_Rate | 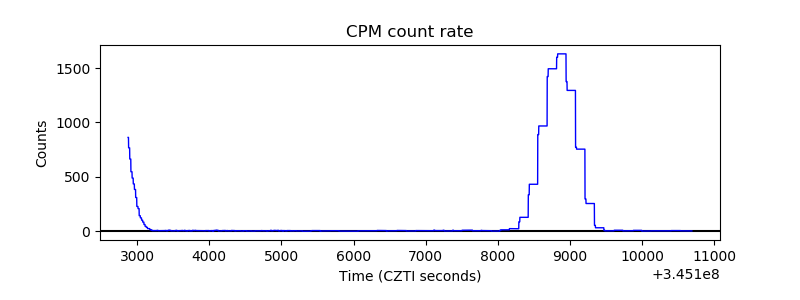 |
| CZT Counter | 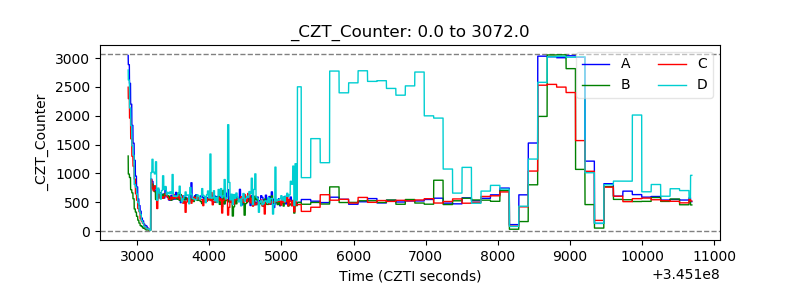 |
| +2.5 Volts monitor |  |
| +5 Volts monitor |  |
| _ROLL_ROT | 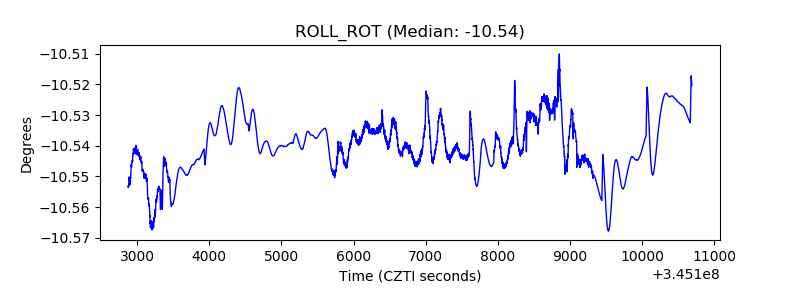 |
| _Roll_DEC |  |
| _Roll_RA | 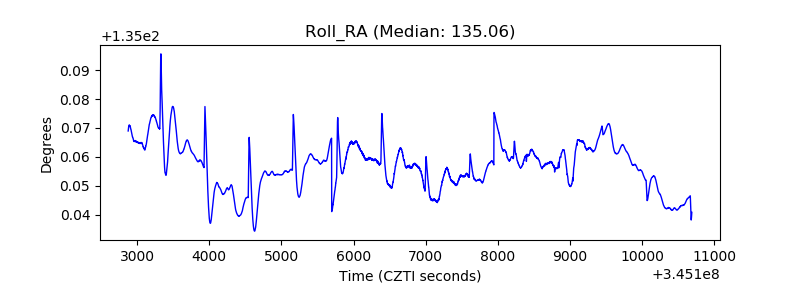 |
| Veto Counter | 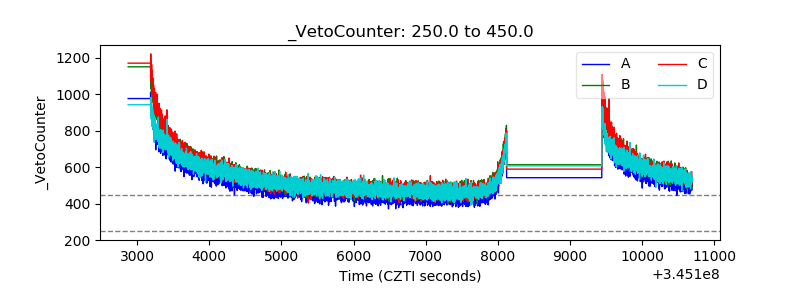 |