| Param | Original file | Final file |
|---|---|---|
| Filename | modeM0/AS1A10_057T05_9000004060_28097cztM0_level2.evt | modeM0/AS1A10_057T05_9000004060_28097cztM0_level2_quad_clean.evt |
| Size (bytes) | 568,391,040 | 89,095,680 |
| Size | 542.1 MB | 85.0 MB |
| Events in quadrant A | 3,494,282 | 585,408 |
| Events in quadrant B | 3,468,052 | 579,739 |
| Events in quadrant C | 3,564,604 | 553,381 |
| Events in quadrant D | 6,255,610 | 535,262 |
| Mode M0 | |||
|---|---|---|---|
| Quadrant | BADHDUFLAG | Total packets | Discarded packets |
| A | 0 | 13978 | 0 |
| B | 0 | 13850 | 0 |
| C | 0 | 14206 | 0 |
| D | 0 | 23144 | 0 |
| Mode M9 | |||
|---|---|---|---|
| Quadrant | BADHDUFLAG | Total packets | Discarded packets |
| A | 0 | 13 | 0 |
| B | 0 | 13 | 0 |
| C | 0 | 13 | 0 |
| D | 0 | 13 | 0 |
| Quadrant | Total seconds | Saturated seconds | Saturation percentage |
|---|---|---|---|
| A | 6371 | 83 | 1.302778% |
| B | 6372 | 111 | 1.741996% |
| C | 6372 | 129 | 2.024482% |
| D | 6372 | 678 | 10.640301% |
Noise dominated data is calculated using 1-second bins in cleaned event files. If a bin has >2000 counts, and if more than 50% of those come from <1% of pixels, then it is considered to be noise-dominated and hence unusable.
| Quadrant | # 1 sec bins | Bins with >0 counts | Bins with >2000 counts | High rate bins dominated by noise | Noise dominated (total time) | Noise dominated (detector-on time) | Marked lightcurve |
|---|---|---|---|---|---|---|---|
| A | 7611 | 6372 | 0 | 0 | 0.00% | 0.00% | 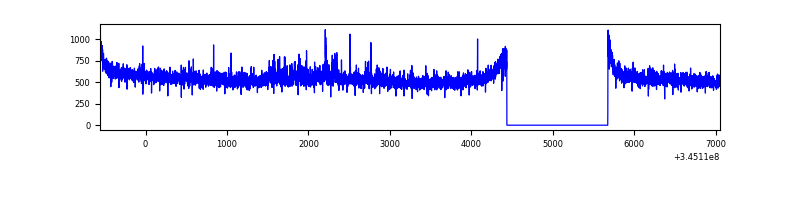 |
| B | 7612 | 6373 | 21 | 21 | 0.28% | 0.33% | 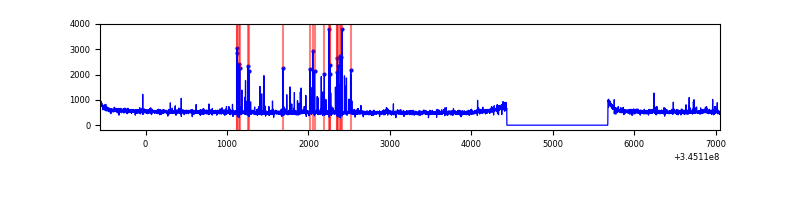 |
| C | 7612 | 6373 | 7 | 7 | 0.09% | 0.11% | 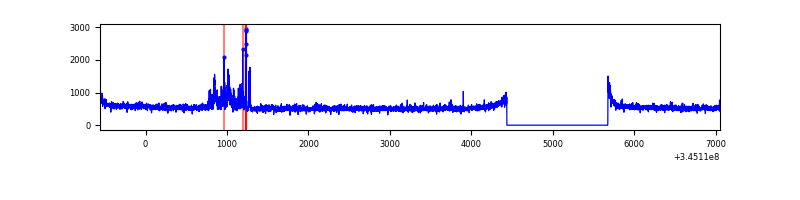 |
| D | 7612 | 6373 | 562 | 562 | 7.38% | 8.82% | 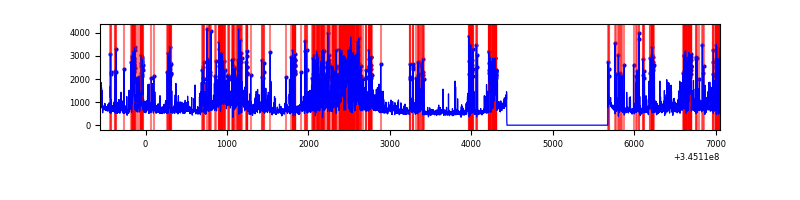 |
Top three noisy pixels from each quadrant. If the there are fewer than three noisy pixels in the level2.evt file, extra rows are filled as -1
| Pixel properties | Quadrant properties | ||||||
|---|---|---|---|---|---|---|---|
| Quadrant | DetID | PixID | Counts | Sigma | Mean | Median | Sigma |
| A | 0 | 13 | 110315 | 634.99 | 877 | 864 | 172.4 |
| A | 13 | 254 | 11355 | 60.86 | 877 | 864 | 172.4 |
| A | 3 | 137 | 7891 | 40.77 | 877 | 864 | 172.4 |
| B | 5 | 255 | 98127 | 611.19 | 848 | 828 | 159.2 |
| B | 0 | 183 | 19969 | 120.23 | 848 | 828 | 159.2 |
| B | 12 | 111 | 18810 | 112.95 | 848 | 828 | 159.2 |
| C | 3 | 233 | 209898 | 1088.69 | 825 | 830 | 192.0 |
| C | 14 | 238 | 137293 | 710.61 | 825 | 830 | 192.0 |
| C | 13 | 61 | 5606 | 24.87 | 825 | 830 | 192.0 |
| D | 1 | 52 | 1843967 | 9549.26 | 813 | 792 | 193.0 |
| D | 8 | 195 | 597443 | 3091.17 | 813 | 792 | 193.0 |
| D | 12 | 1 | 471481 | 2438.58 | 813 | 792 | 193.0 |
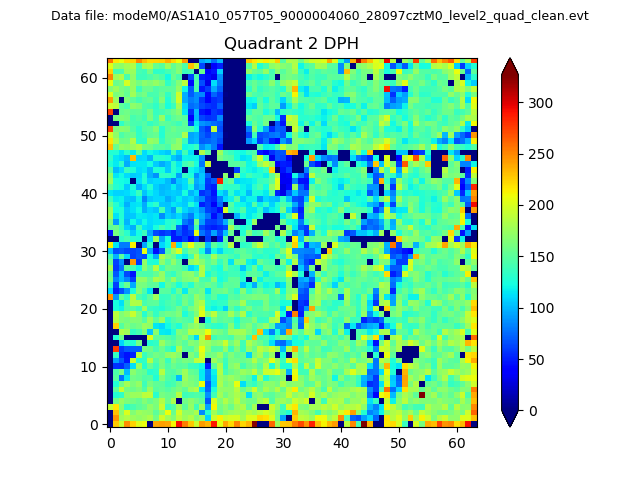
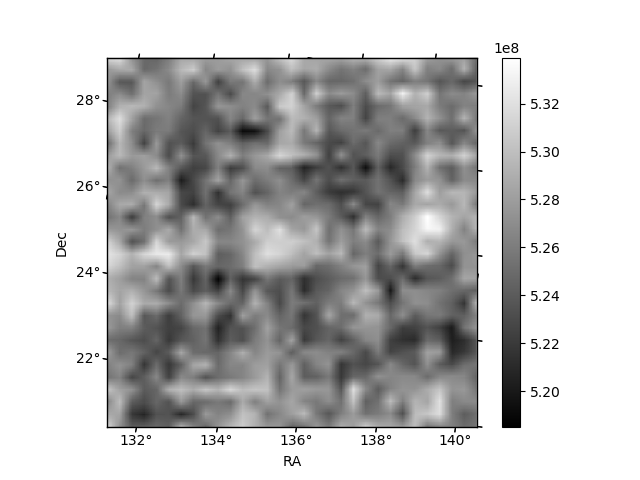
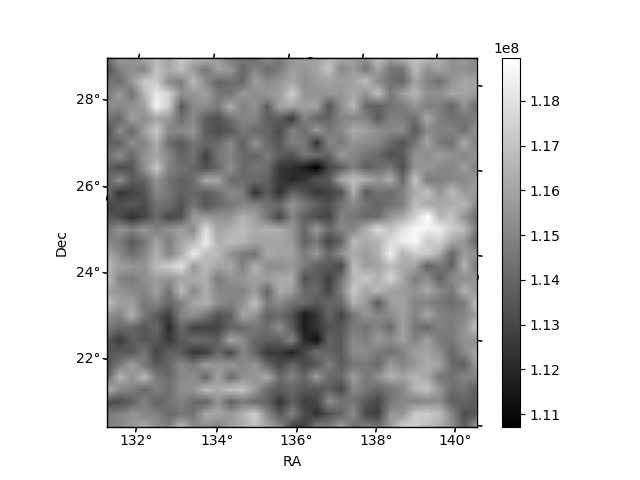
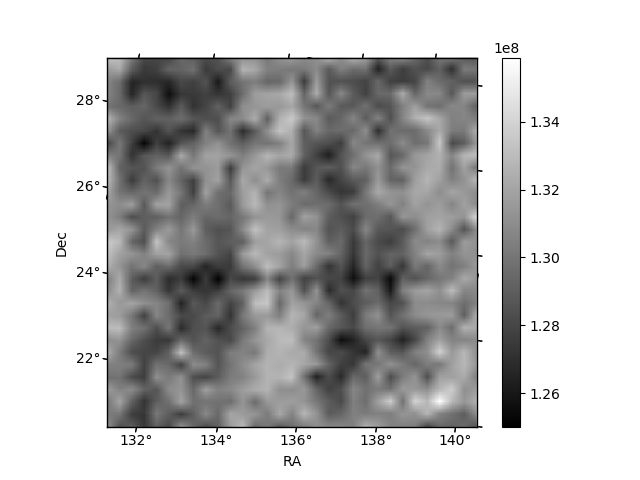
Histogram calculated using DETX and DETY for each event in the final _common_clean file
| Quadrant A | 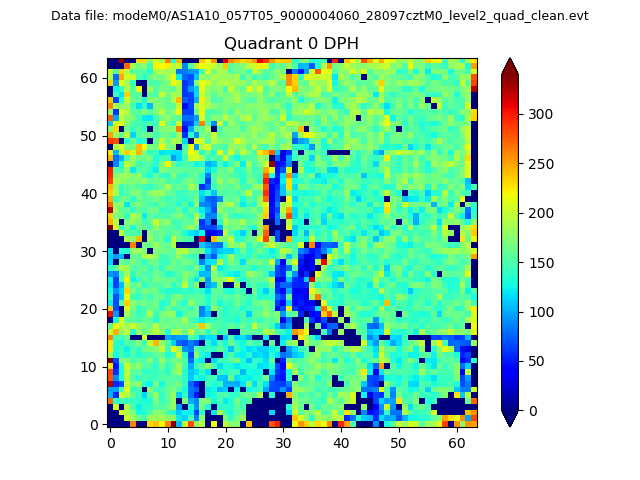 |
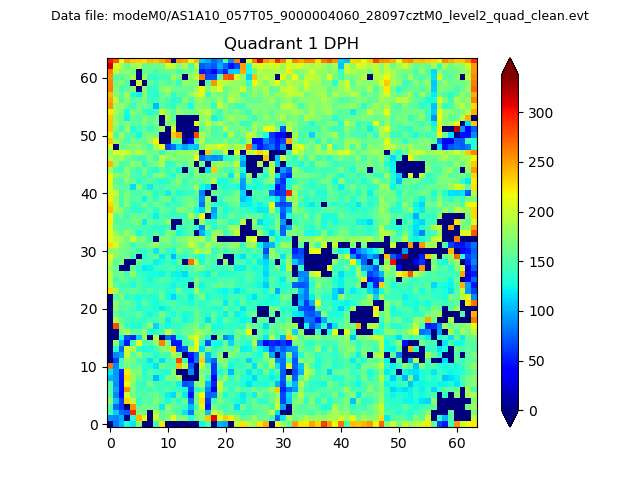 |
Quadrant B |
|---|---|---|---|
| Quadrant D | 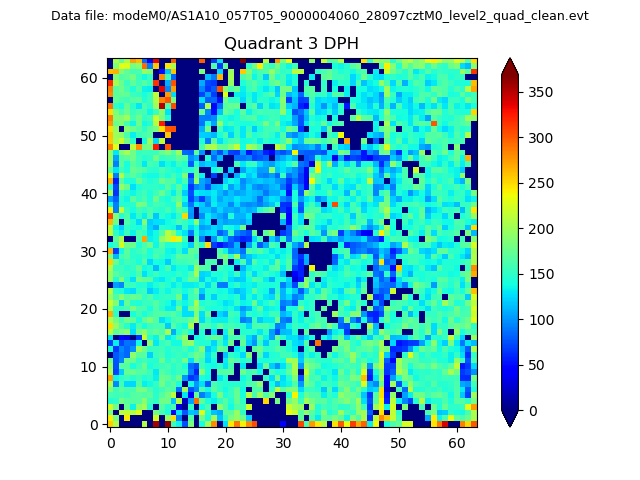 |
 |
Quadrant C |
| Plot type | Count rate plots | Images |
|---|---|---|
| Comparison with Poisson distribution Blue bars denote a histogram of data divided into 1 sec bins. Red curve is a Poisson curve with rate = median count rate of data. |
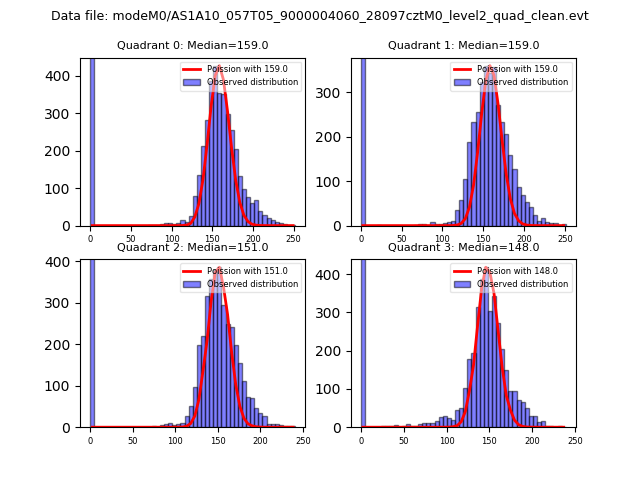 |
 |
| Quadrant-wise count rates Data is divided into 100 sec bins |
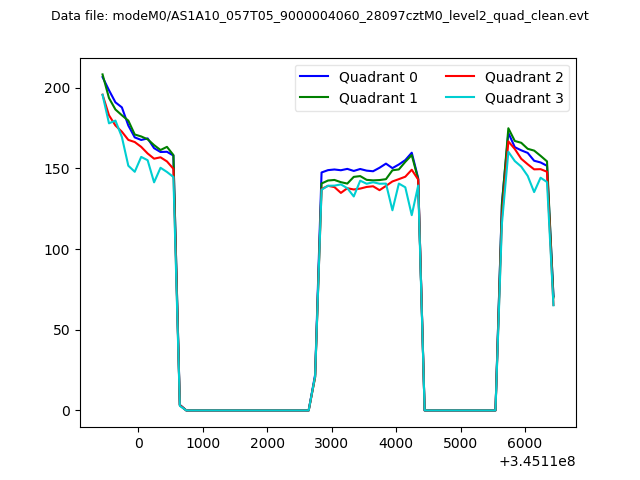 |
|
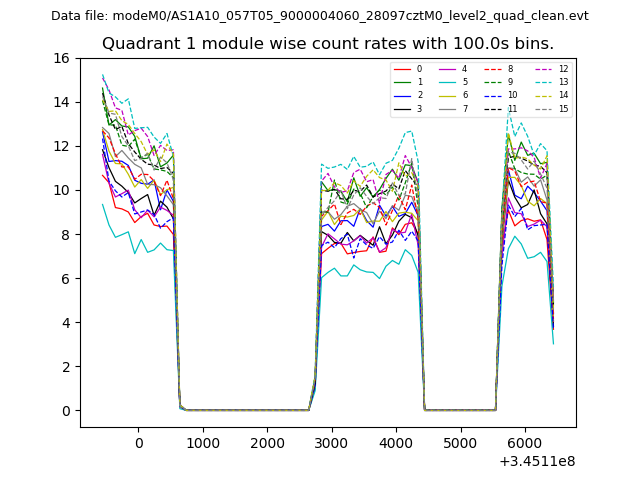
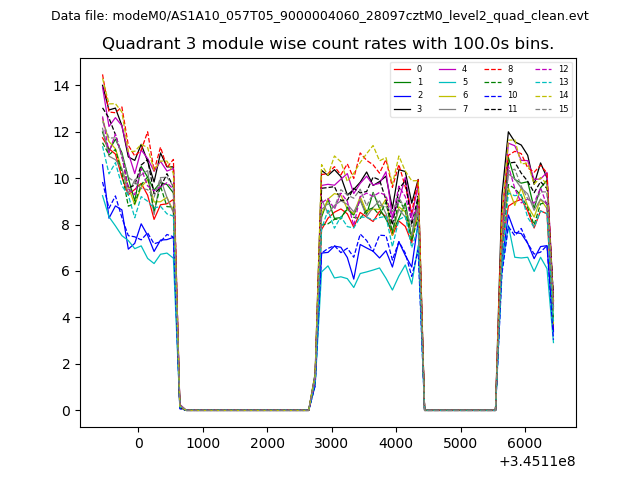
| Module-wise count rates for Quadrant A Data is divided into 100 sec bins |
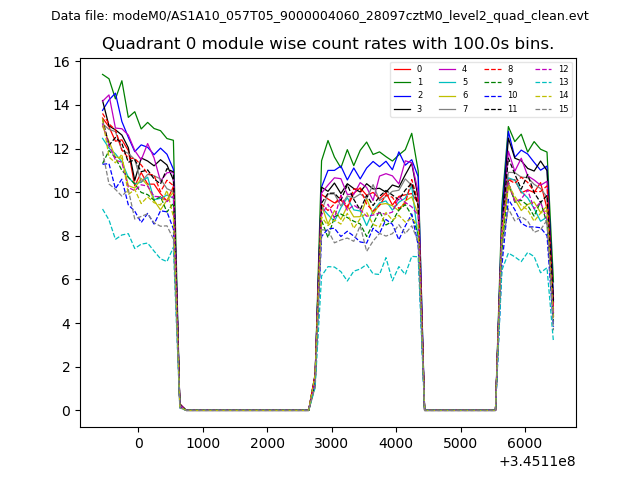 |
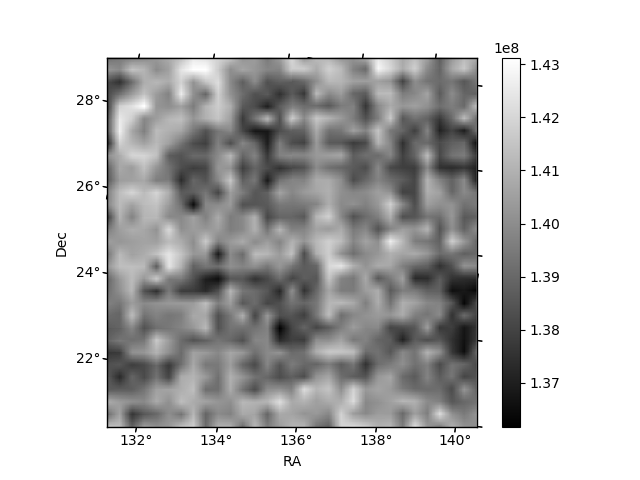 |
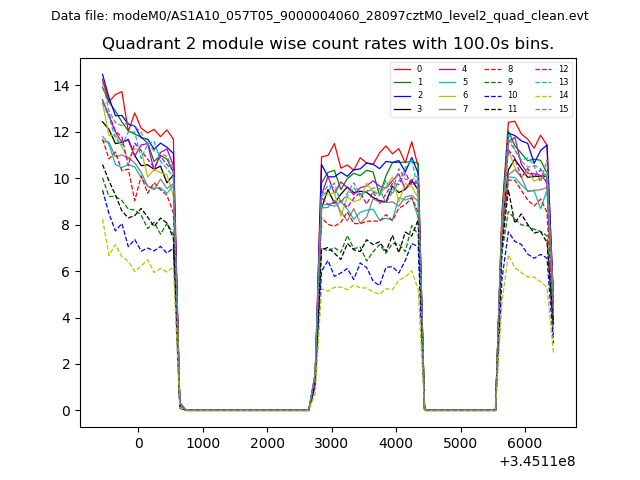
| Module-wise count rates for Quadrant B Data is divided into 100 sec bins |
 |
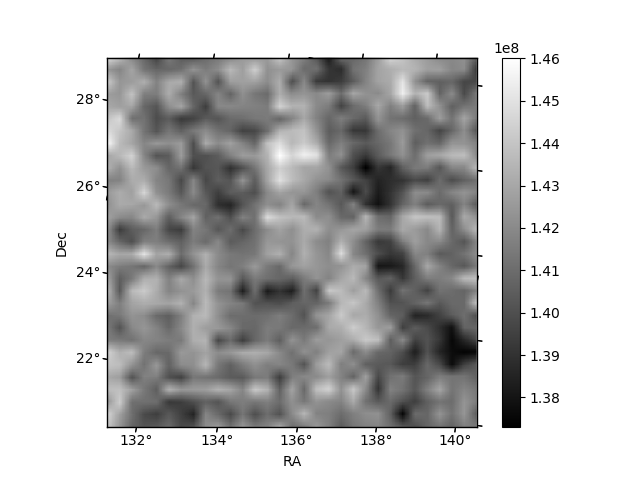 |
| Module-wise count rates for Quadrant C Data is divided into 100 sec bins |
 |
 |
| Module-wise count rates for Quadrant D Data is divided into 100 sec bins |
 |
 |
| Parameter | Plot |
|---|---|
| CZT HV Monitor | 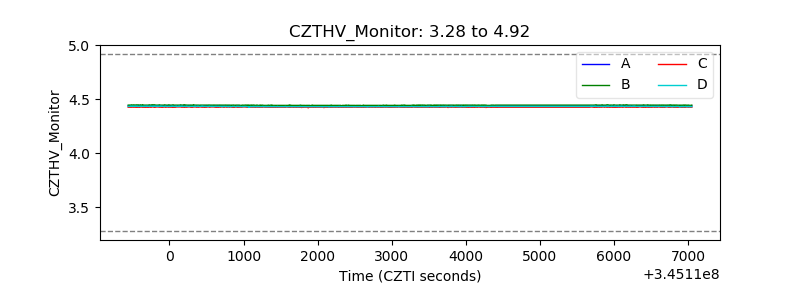 |
| D_VDD | 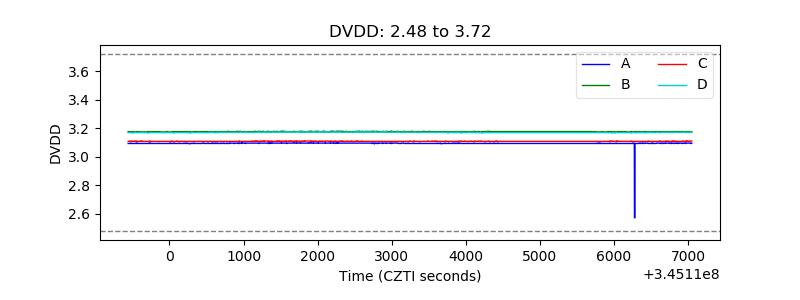 |
| Temperature 1 | 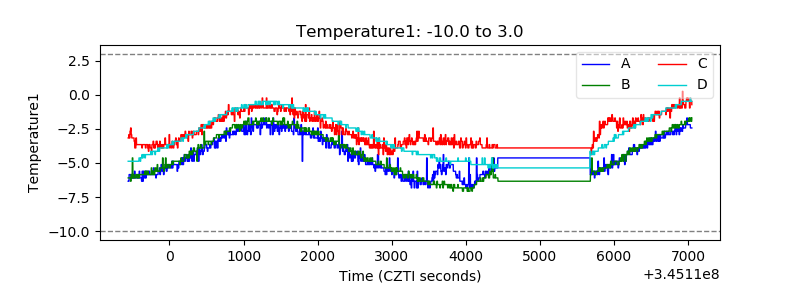 |
| Veto HV Monitor | 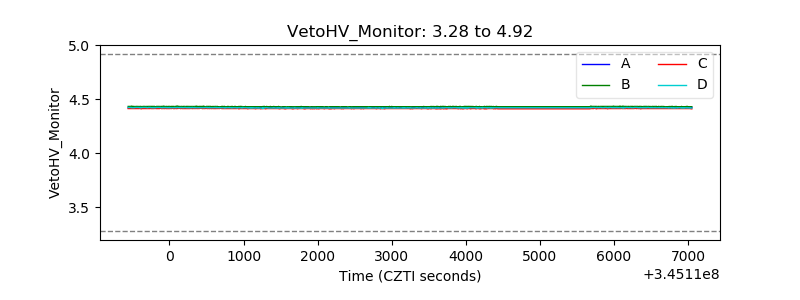 |
| Veto LLD | 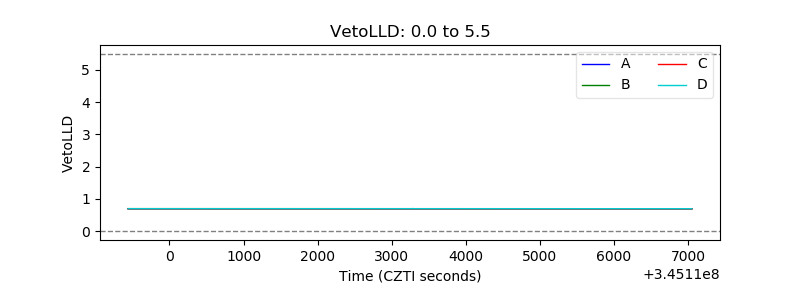 |
| Alpha Counter | 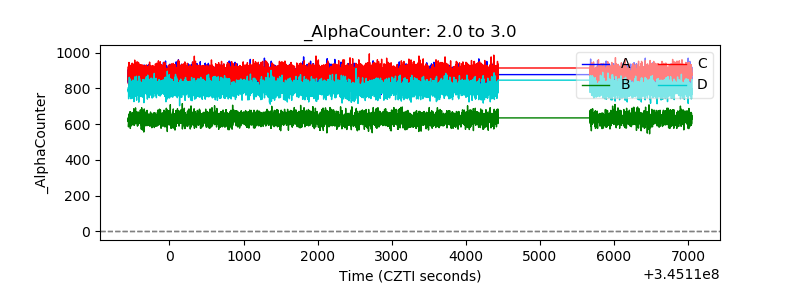 |
| _CPM_Rate | 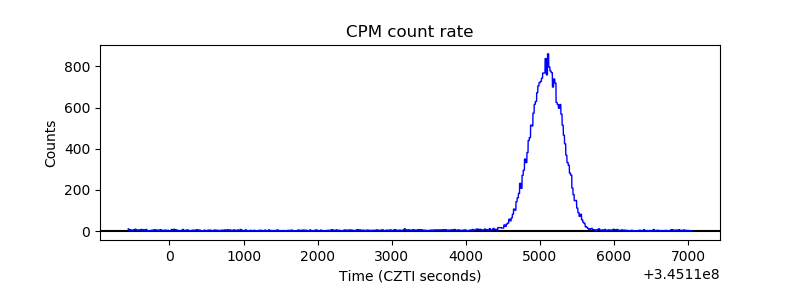 |
| CZT Counter | 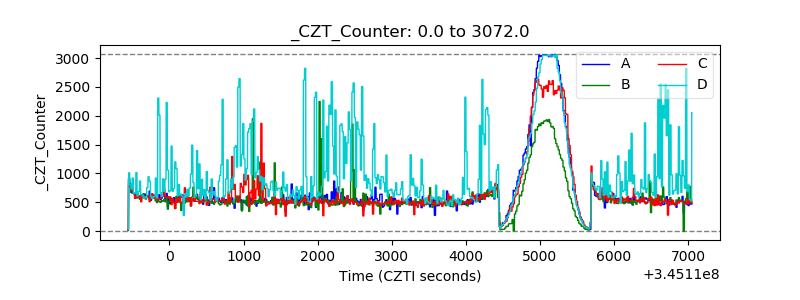 |
| +2.5 Volts monitor |  |
| +5 Volts monitor | 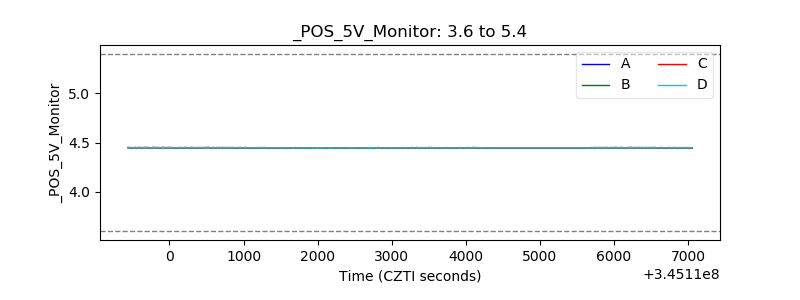 |
| _ROLL_ROT | 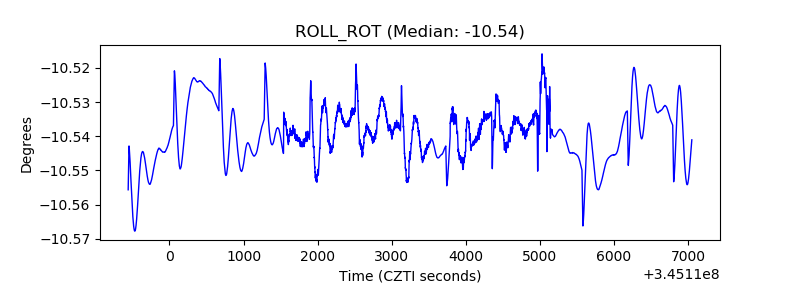 |
| _Roll_DEC | 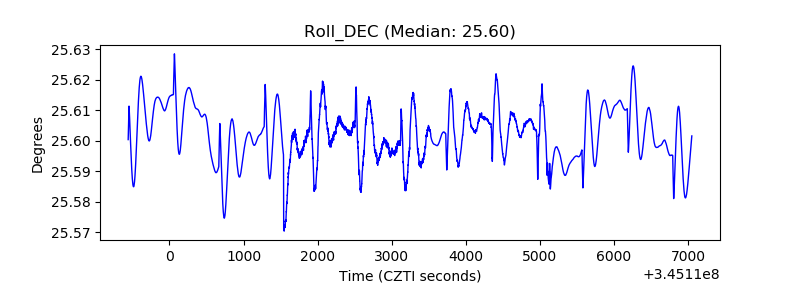 |
| _Roll_RA | 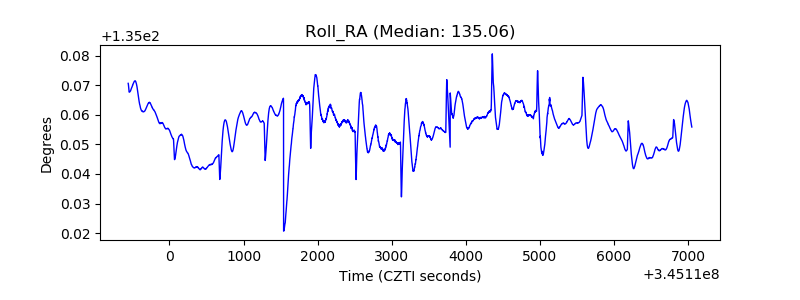 |
| Veto Counter | 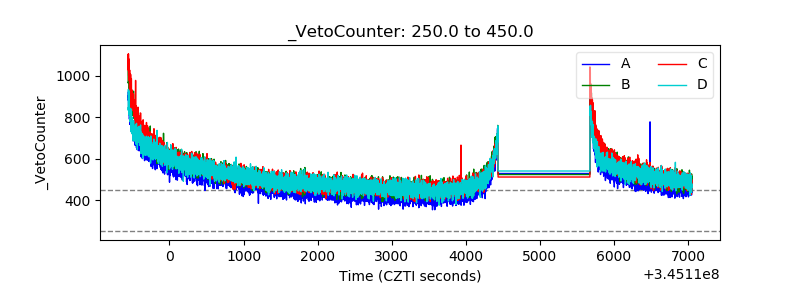 |