| Param | Original file | Final file |
|---|---|---|
| Filename | modeM0/AS1A10_057T05_9000004060_28098cztM0_level2.evt | modeM0/AS1A10_057T05_9000004060_28098cztM0_level2_quad_clean.evt |
| Size (bytes) | 549,745,920 | 80,913,600 |
| Size | 524.3 MB | 77.2 MB |
| Events in quadrant A | 3,414,256 | 514,374 |
| Events in quadrant B | 3,438,270 | 507,528 |
| Events in quadrant C | 3,429,769 | 485,618 |
| Events in quadrant D | 5,915,209 | 477,958 |
| Mode M0 | |||
|---|---|---|---|
| Quadrant | BADHDUFLAG | Total packets | Discarded packets |
| A | 0 | 13949 | 0 |
| B | 0 | 14046 | 0 |
| C | 0 | 13944 | 0 |
| D | 0 | 22225 | 0 |
| Mode M9 | |||
|---|---|---|---|
| Quadrant | BADHDUFLAG | Total packets | Discarded packets |
| A | 0 | 10 | 0 |
| B | 0 | 10 | 0 |
| C | 0 | 10 | 0 |
| D | 0 | 10 | 0 |
| Quadrant | Total seconds | Saturated seconds | Saturation percentage |
|---|---|---|---|
| A | 6668 | 104 | 1.559688% |
| B | 6669 | 99 | 1.484480% |
| C | 6668 | 123 | 1.844631% |
| D | 6668 | 475 | 7.123575% |
Noise dominated data is calculated using 1-second bins in cleaned event files. If a bin has >2000 counts, and if more than 50% of those come from <1% of pixels, then it is considered to be noise-dominated and hence unusable.
| Quadrant | # 1 sec bins | Bins with >0 counts | Bins with >2000 counts | High rate bins dominated by noise | Noise dominated (total time) | Noise dominated (detector-on time) | Marked lightcurve |
|---|---|---|---|---|---|---|---|
| A | 7643 | 6668 | 0 | 0 | 0.00% | 0.00% | 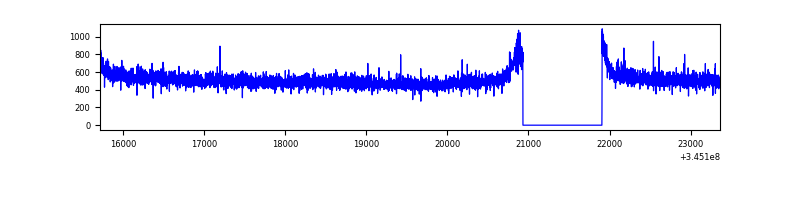 |
| B | 7644 | 6669 | 1 | 1 | 0.01% | 0.01% | 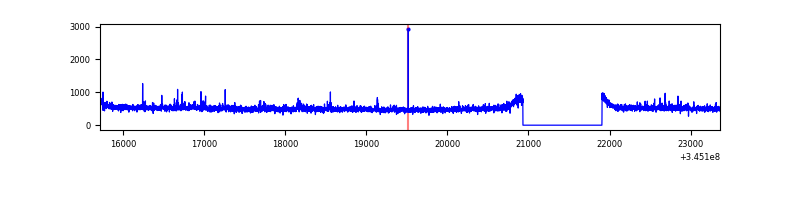 |
| C | 7643 | 6668 | 0 | 0 | 0.00% | 0.00% | 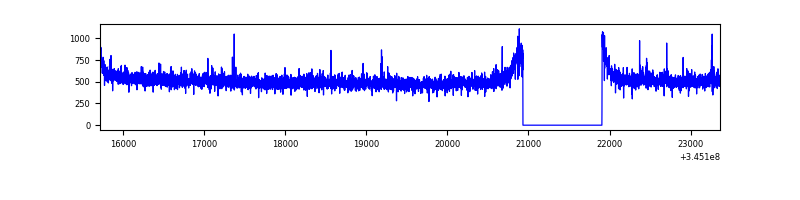 |
| D | 7643 | 6668 | 345 | 345 | 4.51% | 5.17% | 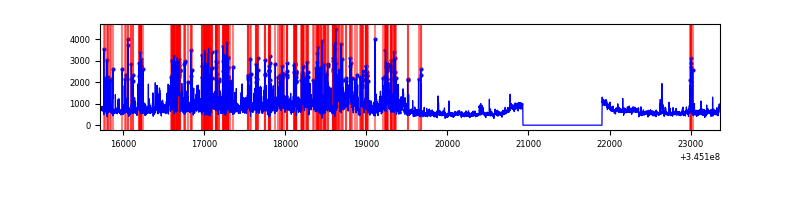 |
Top three noisy pixels from each quadrant. If the there are fewer than three noisy pixels in the level2.evt file, extra rows are filled as -1
| Pixel properties | Quadrant properties | ||||||
|---|---|---|---|---|---|---|---|
| Quadrant | DetID | PixID | Counts | Sigma | Mean | Median | Sigma |
| A | 5 | 98 | 12425 | 65.68 | 880 | 863 | 176.0 |
| A | 13 | 254 | 11502 | 60.44 | 880 | 863 | 176.0 |
| A | 3 | 137 | 8275 | 42.1 | 880 | 863 | 176.0 |
| B | 0 | 183 | 23617 | 139.17 | 858 | 836 | 163.7 |
| B | 15 | 32 | 21297 | 125.0 | 858 | 836 | 163.7 |
| B | 12 | 111 | 19917 | 116.57 | 858 | 836 | 163.7 |
| C | 14 | 238 | 135129 | 692.92 | 833 | 837 | 193.8 |
| C | 3 | 233 | 34123 | 171.75 | 833 | 837 | 193.8 |
| C | 2 | 16 | 13476 | 65.21 | 833 | 837 | 193.8 |
| D | 1 | 52 | 1754350 | 8676.77 | 837 | 814 | 202.1 |
| D | 8 | 195 | 620572 | 3066.66 | 837 | 814 | 202.1 |
| D | 2 | 250 | 271943 | 1341.59 | 837 | 814 | 202.1 |
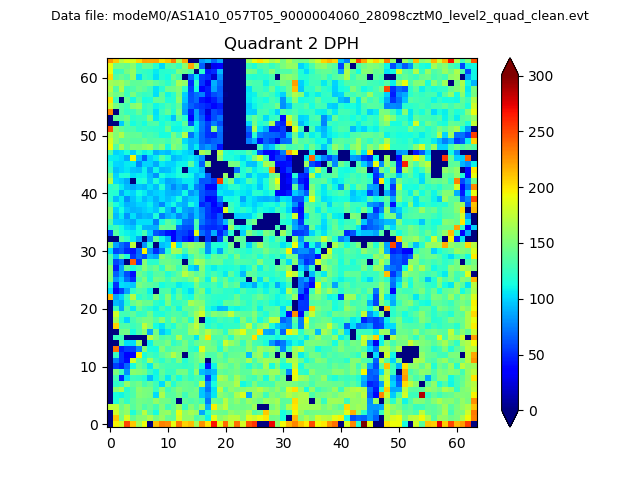
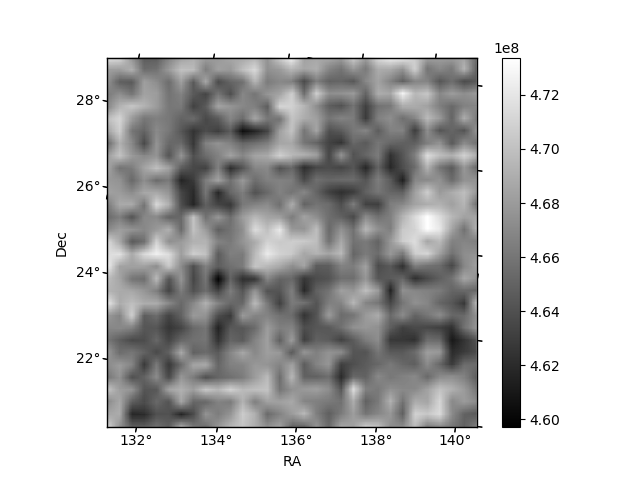
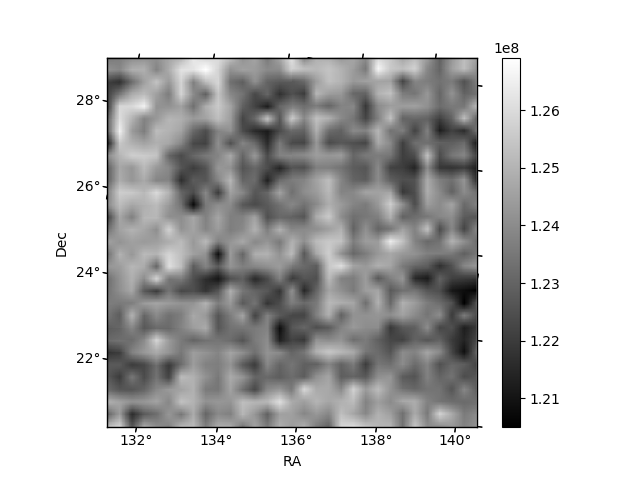
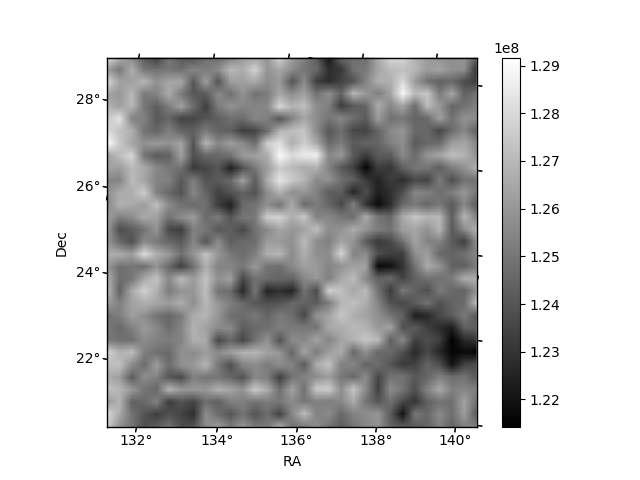
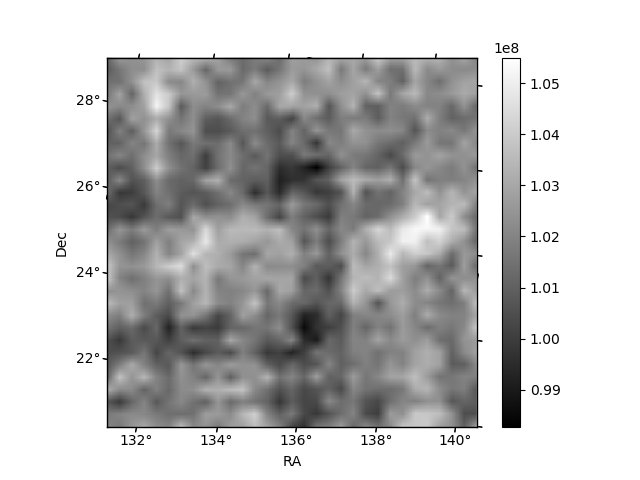
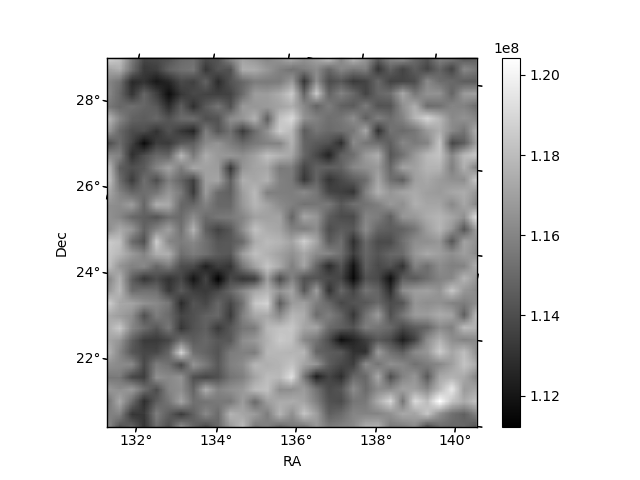
Histogram calculated using DETX and DETY for each event in the final _common_clean file
| Quadrant A | 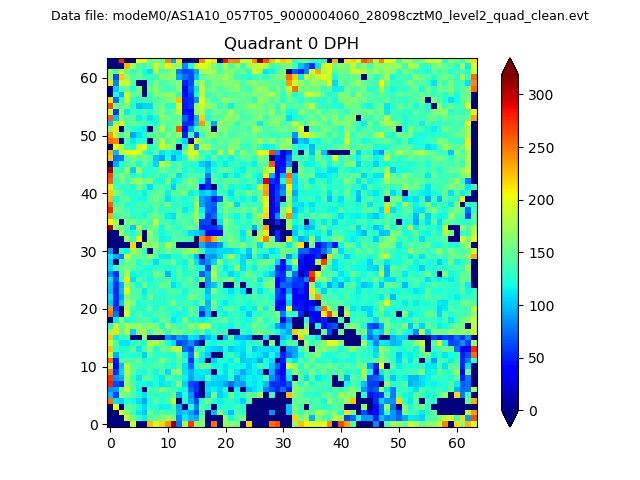 |
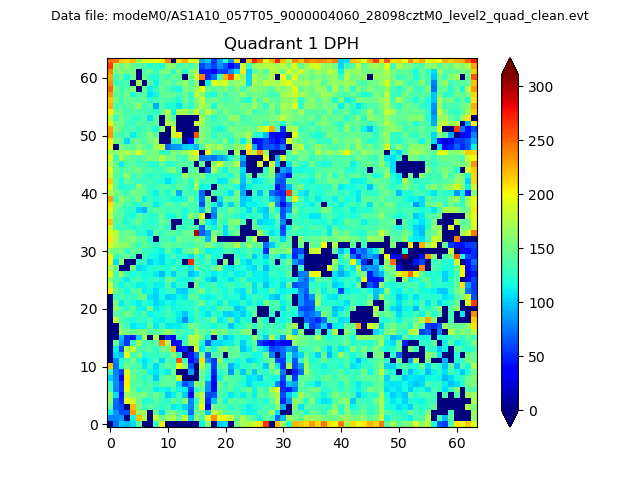 |
Quadrant B |
|---|---|---|---|
| Quadrant D | 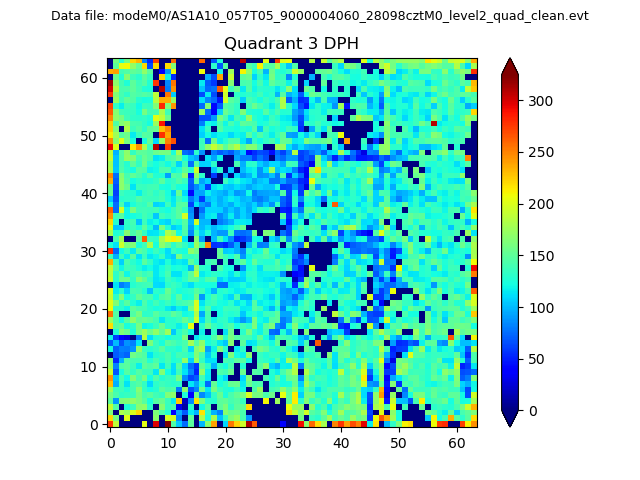 |
 |
Quadrant C |
| Plot type | Count rate plots | Images |
|---|---|---|
| Comparison with Poisson distribution Blue bars denote a histogram of data divided into 1 sec bins. Red curve is a Poisson curve with rate = median count rate of data. |
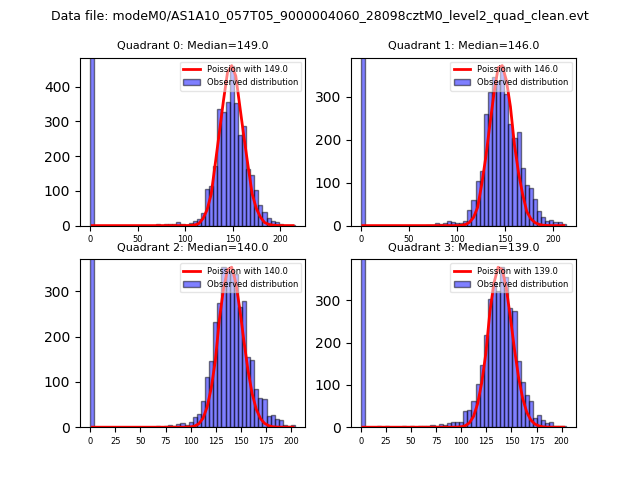 |
 |
| Quadrant-wise count rates Data is divided into 100 sec bins |
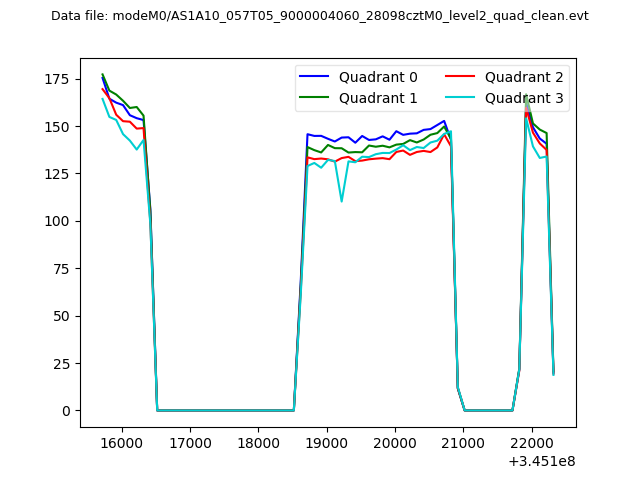 |
|
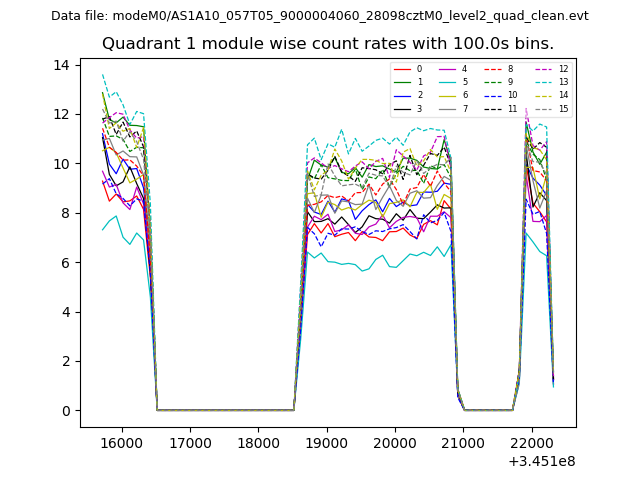
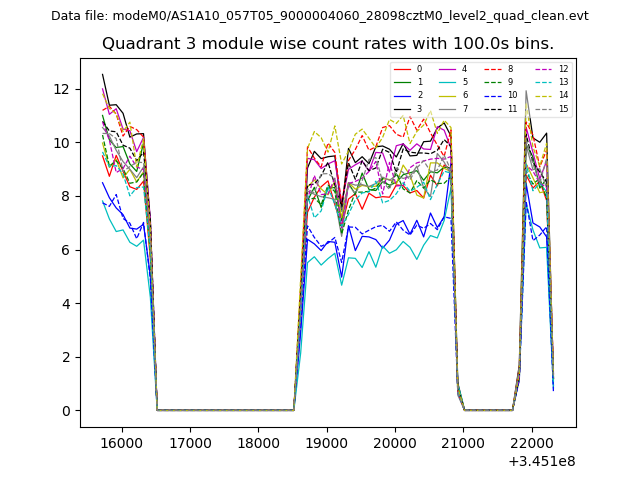
| Module-wise count rates for Quadrant A Data is divided into 100 sec bins |
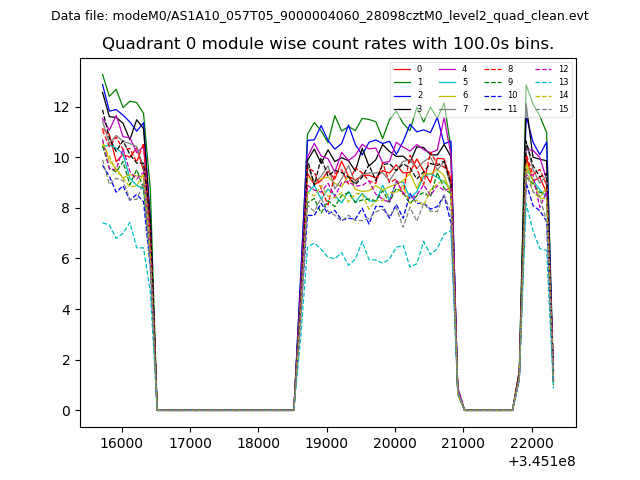 |
 |
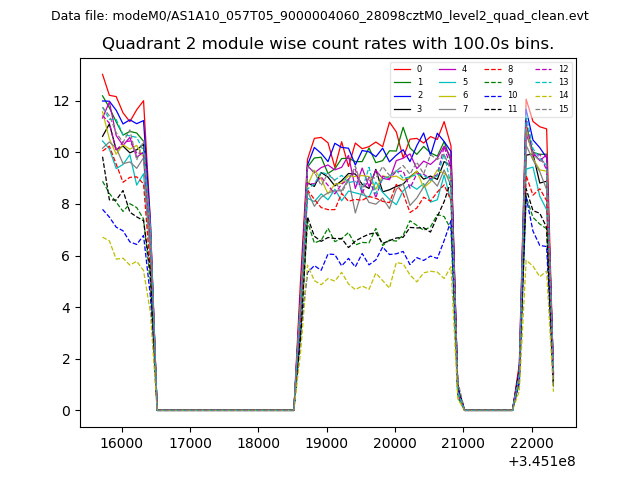
| Module-wise count rates for Quadrant B Data is divided into 100 sec bins |
 |
 |
| Module-wise count rates for Quadrant C Data is divided into 100 sec bins |
 |
 |
| Module-wise count rates for Quadrant D Data is divided into 100 sec bins |
 |
 |
| Parameter | Plot |
|---|---|
| CZT HV Monitor | 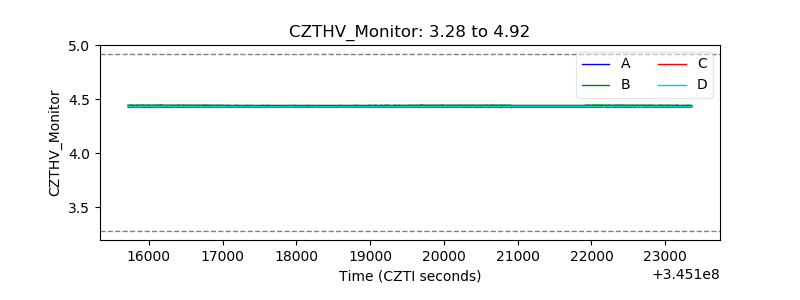 |
| D_VDD | 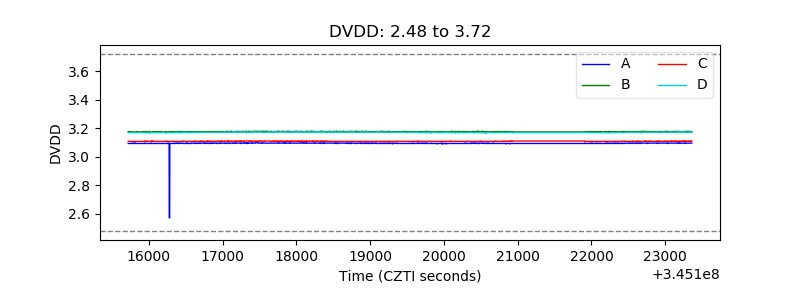 |
| Temperature 1 | 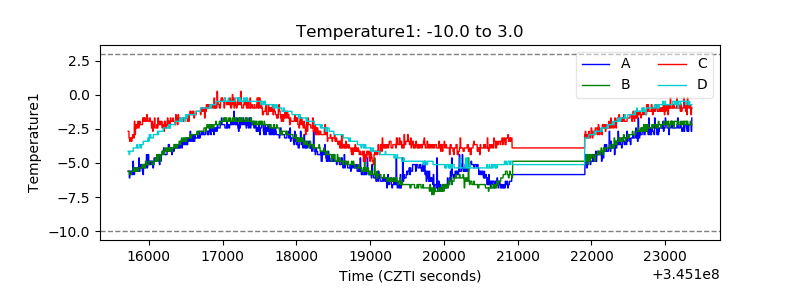 |
| Veto HV Monitor | 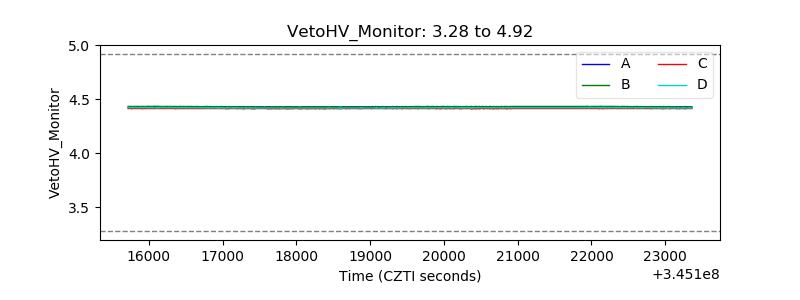 |
| Veto LLD | 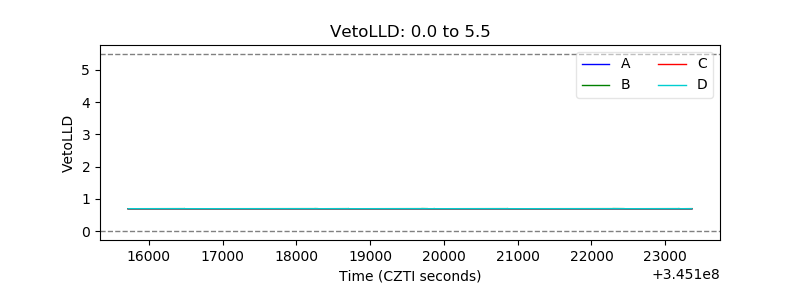 |
| Alpha Counter | 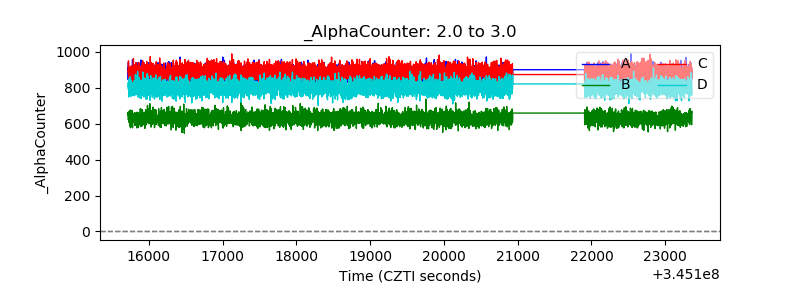 |
| _CPM_Rate | 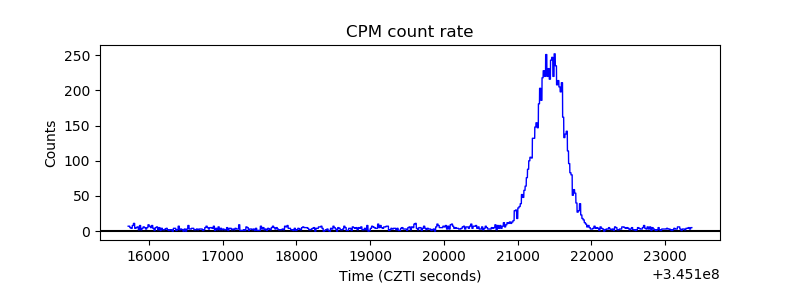 |
| CZT Counter | 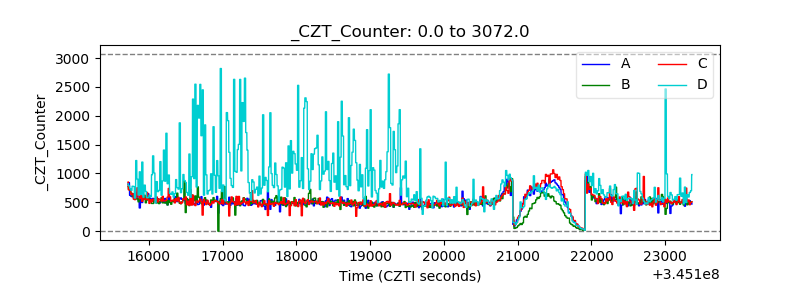 |
| +2.5 Volts monitor |  |
| +5 Volts monitor |  |
| _ROLL_ROT | 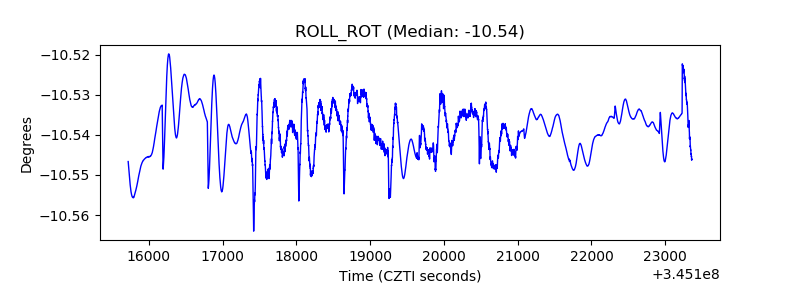 |
| _Roll_DEC | 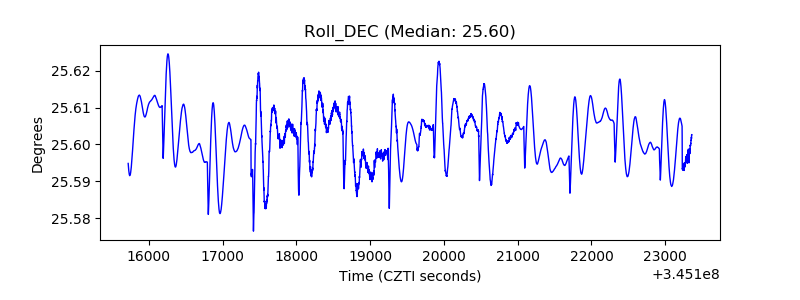 |
| _Roll_RA | 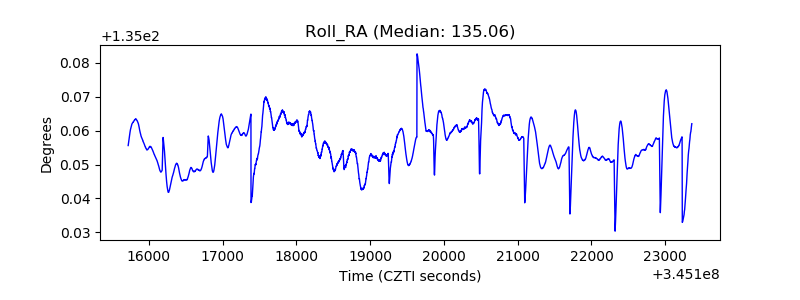 |
| Veto Counter | 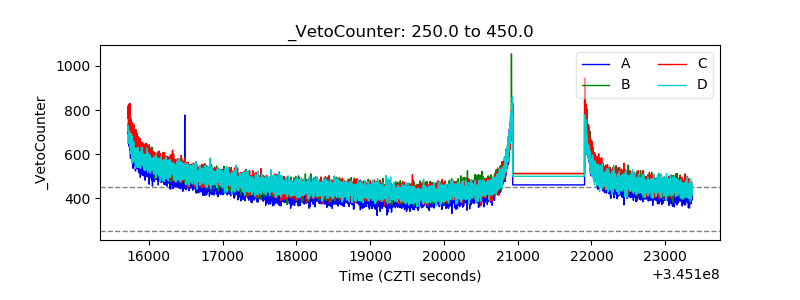 |