| Param | Original file | Final file |
|---|---|---|
| Filename | modeM0/AS1A10_057T05_9000004060_28099cztM0_level2.evt | modeM0/AS1A10_057T05_9000004060_28099cztM0_level2_quad_clean.evt |
| Size (bytes) | 566,786,880 | 79,217,280 |
| Size | 540.5 MB | 75.5 MB |
| Events in quadrant A | 3,729,072 | 488,133 |
| Events in quadrant B | 3,692,895 | 479,407 |
| Events in quadrant C | 3,928,281 | 458,998 |
| Events in quadrant D | 5,318,592 | 462,474 |
| Mode M0 | |||
|---|---|---|---|
| Quadrant | BADHDUFLAG | Total packets | Discarded packets |
| A | 0 | 15478 | 0 |
| B | 0 | 15383 | 0 |
| C | 0 | 16067 | 0 |
| D | 0 | 20787 | 0 |
| Mode M9 | |||
|---|---|---|---|
| Quadrant | BADHDUFLAG | Total packets | Discarded packets |
| A | 0 | 10 | 0 |
| B | 0 | 11 | 0 |
| C | 0 | 11 | 0 |
| D | 0 | 11 | 0 |
| Quadrant | Total seconds | Saturated seconds | Saturation percentage |
|---|---|---|---|
| A | 7322 | 116 | 1.584267% |
| B | 7321 | 135 | 1.844010% |
| C | 7321 | 211 | 2.882120% |
| D | 7321 | 239 | 3.264581% |
Noise dominated data is calculated using 1-second bins in cleaned event files. If a bin has >2000 counts, and if more than 50% of those come from <1% of pixels, then it is considered to be noise-dominated and hence unusable.
| Quadrant | # 1 sec bins | Bins with >0 counts | Bins with >2000 counts | High rate bins dominated by noise | Noise dominated (total time) | Noise dominated (detector-on time) | Marked lightcurve |
|---|---|---|---|---|---|---|---|
| A | 7922 | 7323 | 0 | 0 | 0.00% | 0.00% |  |
| B | 7921 | 7321 | 0 | 0 | 0.00% | 0.00% |  |
| C | 7921 | 7322 | 31 | 31 | 0.39% | 0.42% |  |
| D | 7921 | 7322 | 128 | 128 | 1.62% | 1.75% | 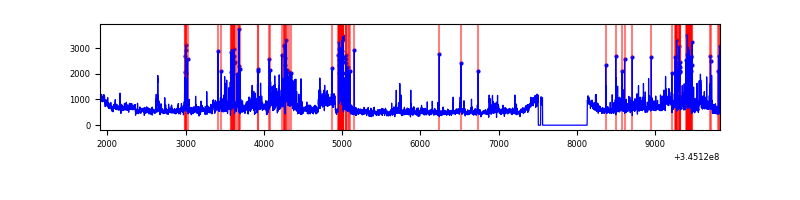 |
Top three noisy pixels from each quadrant. If the there are fewer than three noisy pixels in the level2.evt file, extra rows are filled as -1
| Pixel properties | Quadrant properties | ||||||
|---|---|---|---|---|---|---|---|
| Quadrant | DetID | PixID | Counts | Sigma | Mean | Median | Sigma |
| A | 5 | 98 | 71174 | 375.07 | 941 | 924 | 187.3 |
| A | 0 | 13 | 13418 | 66.71 | 941 | 924 | 187.3 |
| A | 13 | 254 | 12635 | 62.53 | 941 | 924 | 187.3 |
| B | 12 | 111 | 22137 | 119.68 | 921 | 898 | 177.5 |
| B | 11 | 111 | 20060 | 107.97 | 921 | 898 | 177.5 |
| B | 4 | 52 | 19287 | 103.62 | 921 | 898 | 177.5 |
| C | 15 | 208 | 244987 | 1166.96 | 890 | 895 | 209.2 |
| C | 14 | 238 | 143231 | 680.48 | 890 | 895 | 209.2 |
| C | 2 | 16 | 48910 | 229.55 | 890 | 895 | 209.2 |
| D | 8 | 195 | 863620 | 3940.41 | 909 | 884 | 218.9 |
| D | 2 | 250 | 641555 | 2926.16 | 909 | 884 | 218.9 |
| D | 1 | 52 | 210062 | 955.39 | 909 | 884 | 218.9 |
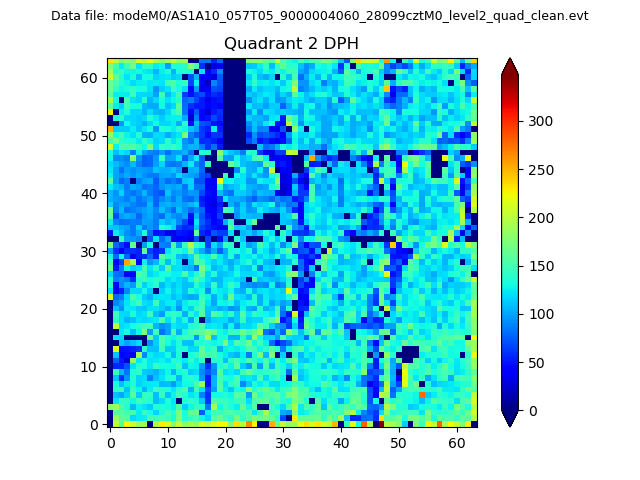
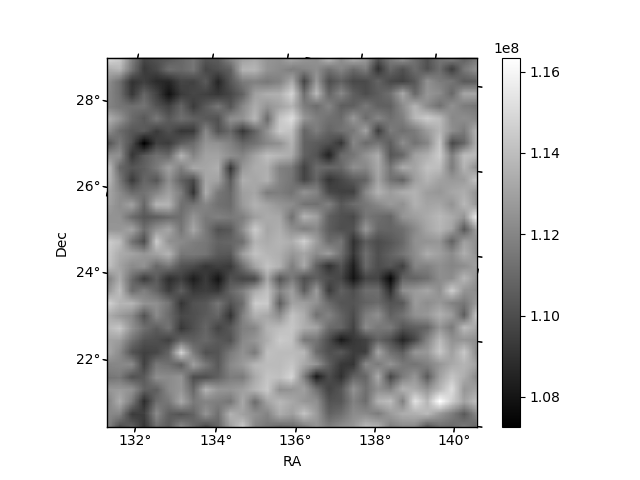
Histogram calculated using DETX and DETY for each event in the final _common_clean file
| Quadrant A | 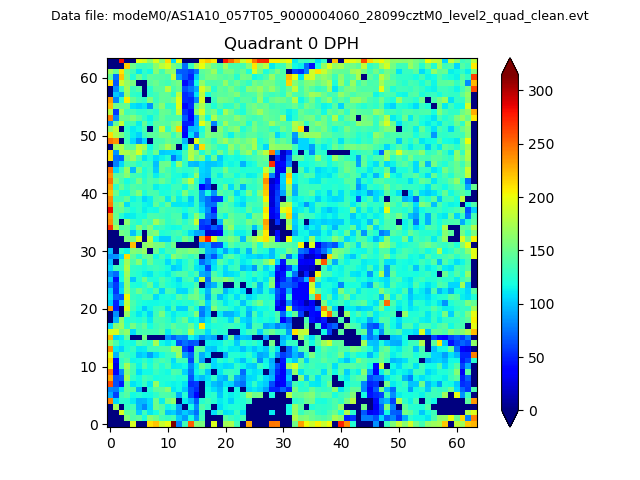 |
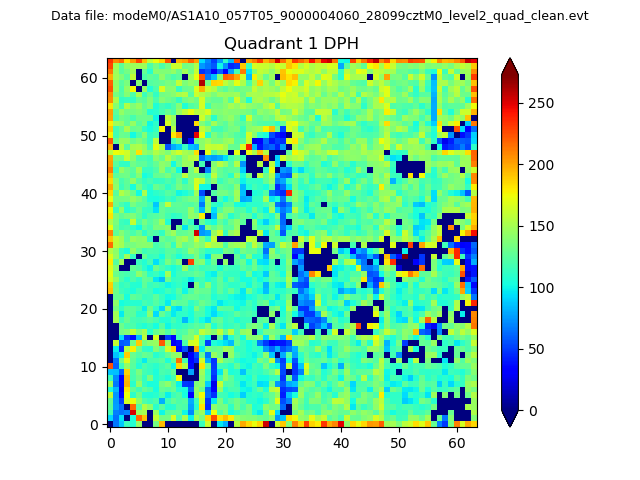 |
Quadrant B |
|---|---|---|---|
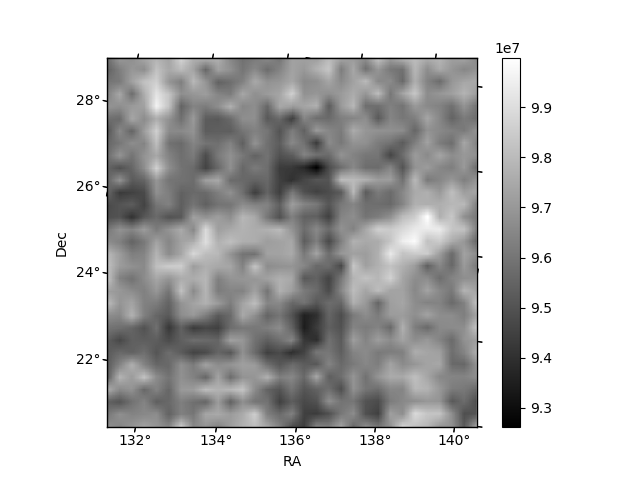
| Quadrant D | 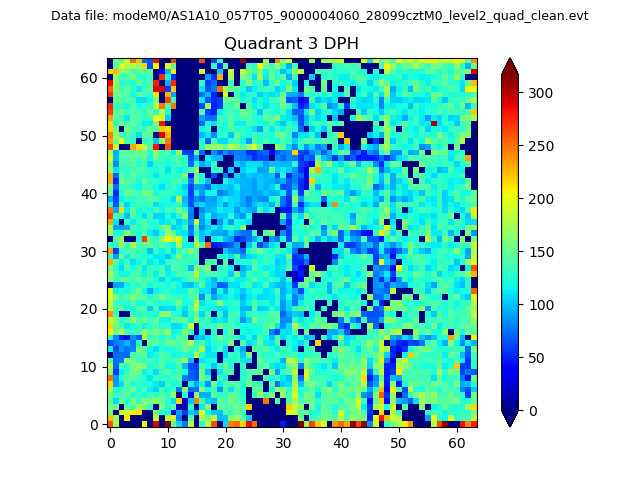 |
 |
Quadrant C |
| Plot type | Count rate plots | Images |
|---|---|---|
| Comparison with Poisson distribution Blue bars denote a histogram of data divided into 1 sec bins. Red curve is a Poisson curve with rate = median count rate of data. |
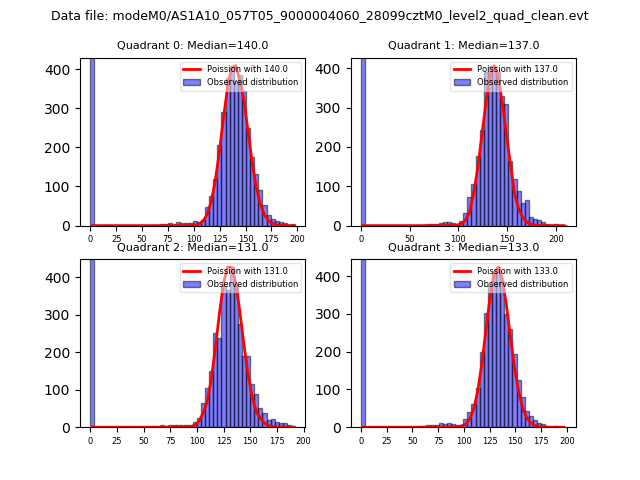 |
 |
| Quadrant-wise count rates Data is divided into 100 sec bins |
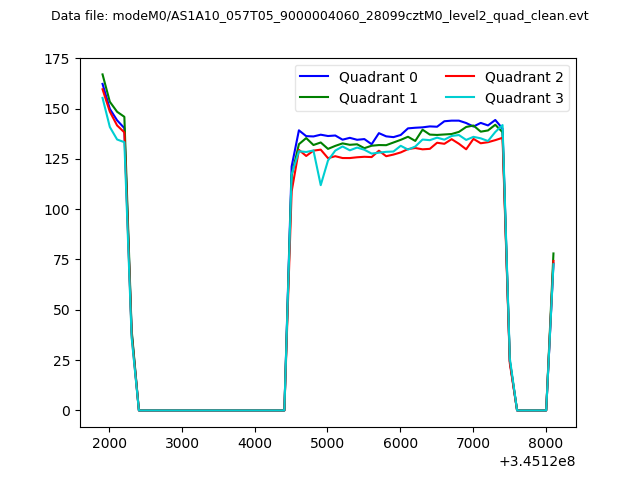 |
|
| Module-wise count rates for Quadrant A Data is divided into 100 sec bins |
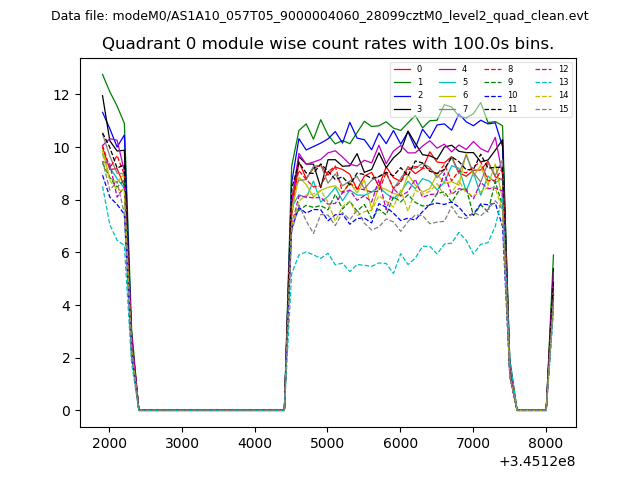 |
 |
| Module-wise count rates for Quadrant B Data is divided into 100 sec bins |
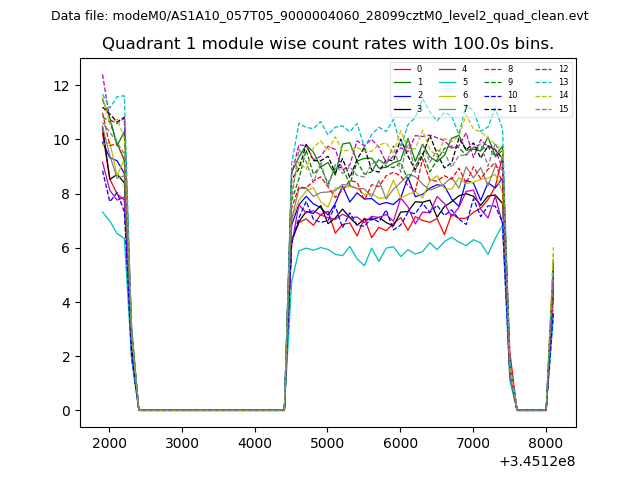 |
 |
| Module-wise count rates for Quadrant C Data is divided into 100 sec bins |
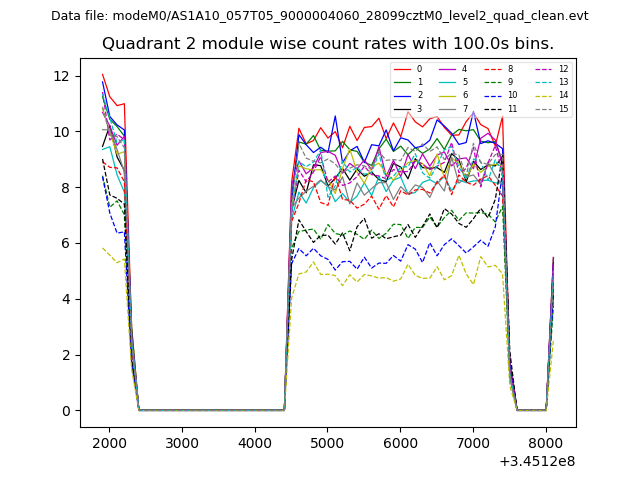 |
 |
| Module-wise count rates for Quadrant D Data is divided into 100 sec bins |
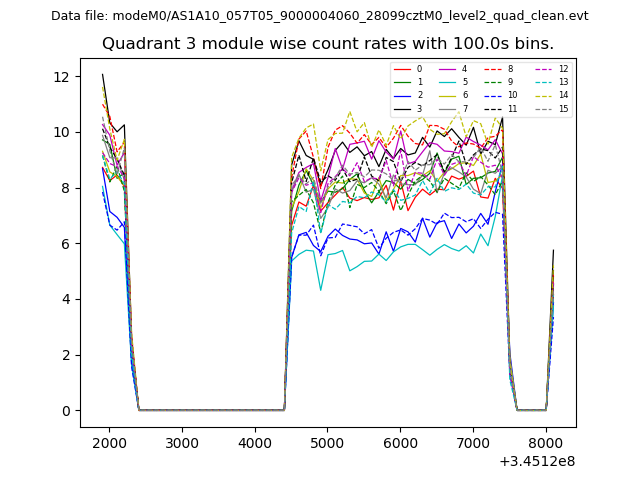 |
 |
| Parameter | Plot |
|---|---|
| CZT HV Monitor | 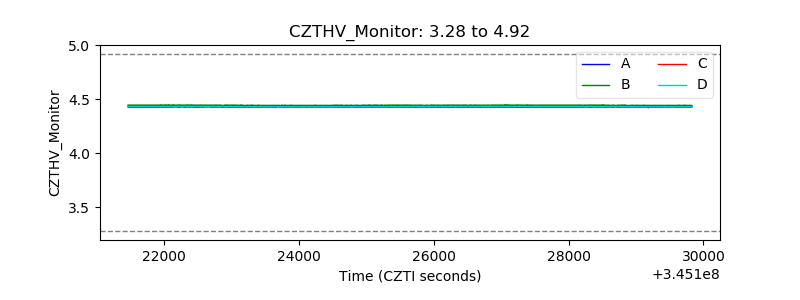 |
| D_VDD | 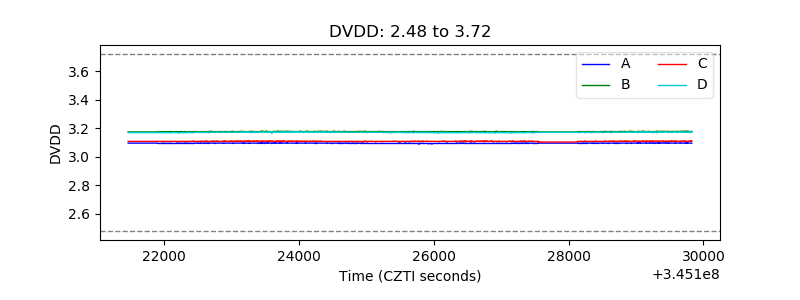 |
| Temperature 1 | 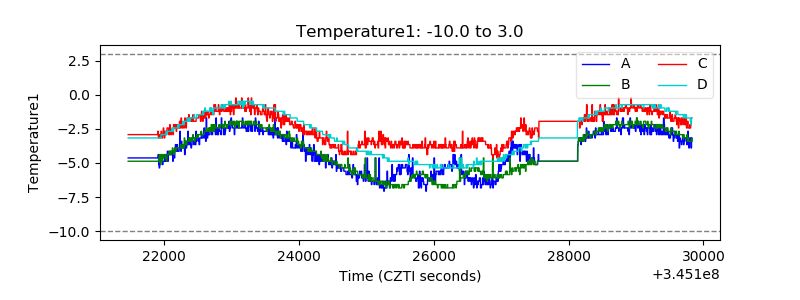 |
| Veto HV Monitor | 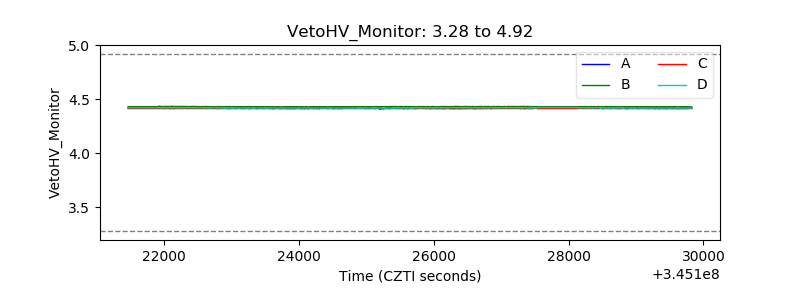 |
| Veto LLD | 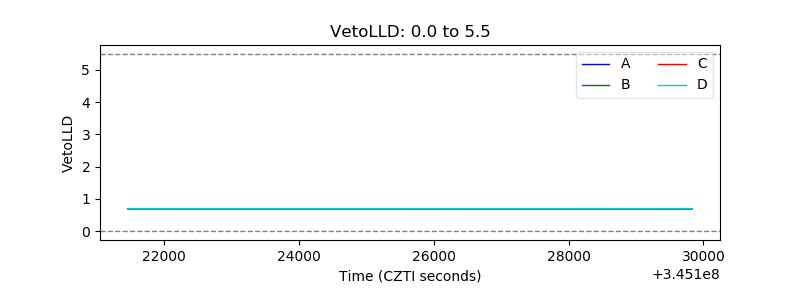 |
| Alpha Counter | 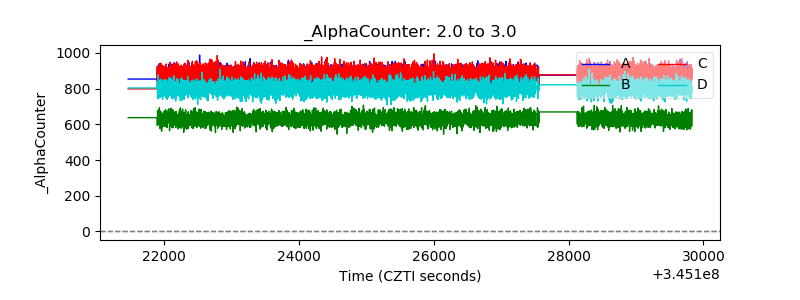 |
| _CPM_Rate | 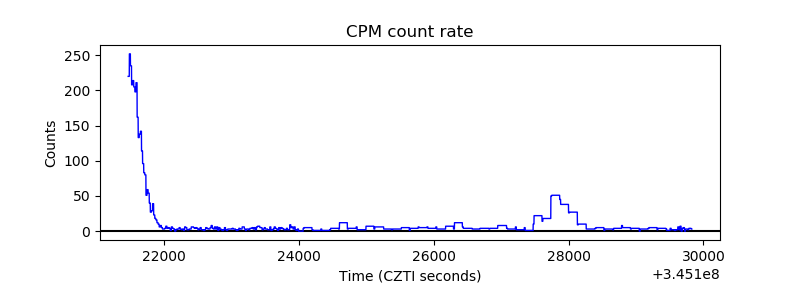 |
| CZT Counter | 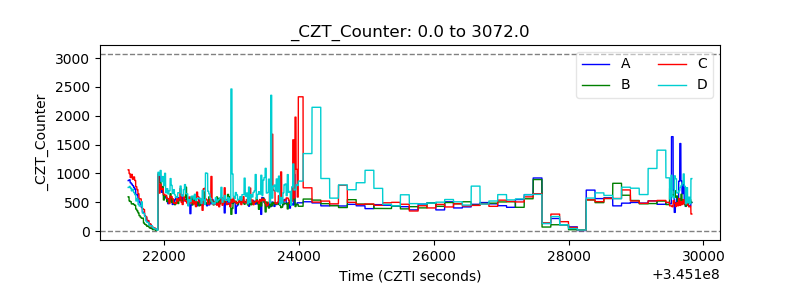 |
| +2.5 Volts monitor | 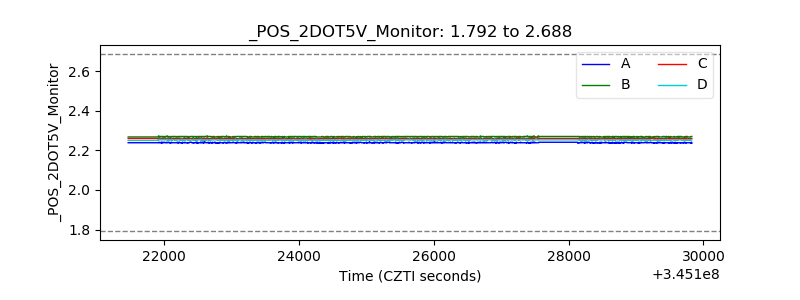 |
| +5 Volts monitor |  |
| _ROLL_ROT | 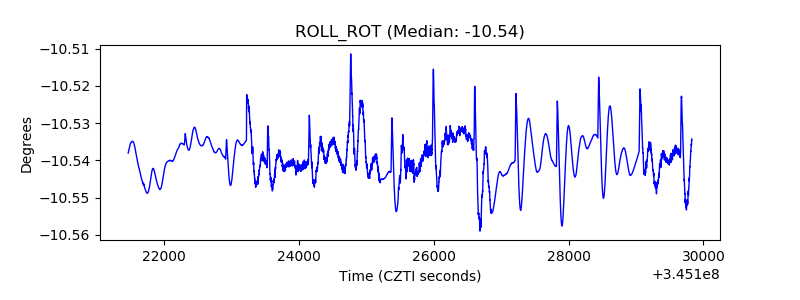 |
| _Roll_DEC | 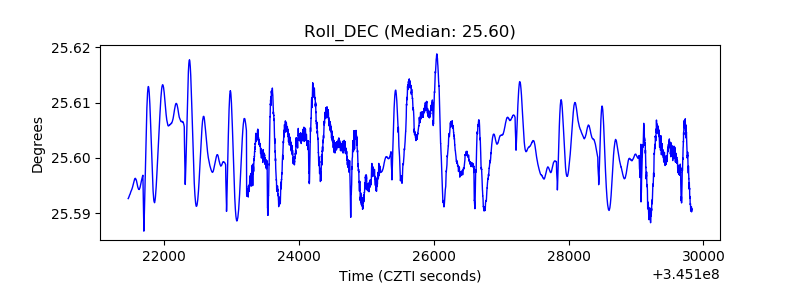 |
| _Roll_RA | 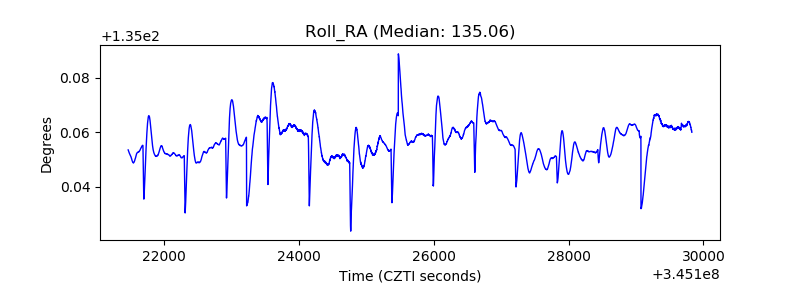 |
| Veto Counter | 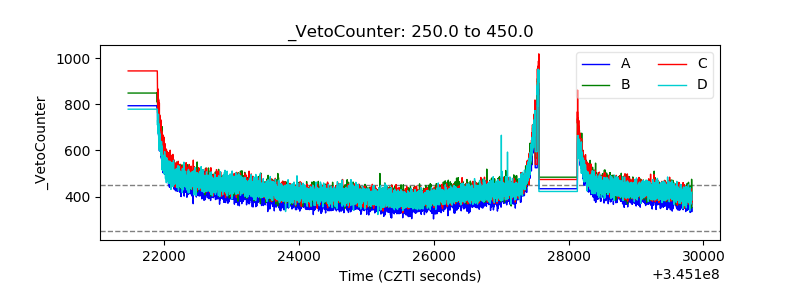 |