| Param | Original file | Final file |
|---|---|---|
| Filename | modeM0/AS1A10_057T05_9000004060_28100cztM0_level2.evt | modeM0/AS1A10_057T05_9000004060_28100cztM0_level2_quad_clean.evt |
| Size (bytes) | 587,341,440 | 81,181,440 |
| Size | 560.1 MB | 77.4 MB |
| Events in quadrant A | 3,969,934 | 498,443 |
| Events in quadrant B | 3,802,799 | 488,967 |
| Events in quadrant C | 4,014,814 | 468,999 |
| Events in quadrant D | 5,483,330 | 471,605 |
| Mode M0 | |||
|---|---|---|---|
| Quadrant | BADHDUFLAG | Total packets | Discarded packets |
| A | 0 | 16510 | 0 |
| B | 0 | 16006 | 0 |
| C | 0 | 16588 | 0 |
| D | 0 | 21723 | 0 |
| Mode M9 | |||
|---|---|---|---|
| Quadrant | BADHDUFLAG | Total packets | Discarded packets |
| A | 0 | 9 | 0 |
| B | 0 | 9 | 0 |
| C | 0 | 9 | 0 |
| D | 0 | 9 | 0 |
| Quadrant | Total seconds | Saturated seconds | Saturation percentage |
|---|---|---|---|
| A | 7624 | 167 | 2.190451% |
| B | 7625 | 176 | 2.308197% |
| C | 7624 | 248 | 3.252886% |
| D | 7624 | 322 | 4.223505% |
Noise dominated data is calculated using 1-second bins in cleaned event files. If a bin has >2000 counts, and if more than 50% of those come from <1% of pixels, then it is considered to be noise-dominated and hence unusable.
| Quadrant | # 1 sec bins | Bins with >0 counts | Bins with >2000 counts | High rate bins dominated by noise | Noise dominated (total time) | Noise dominated (detector-on time) | Marked lightcurve |
|---|---|---|---|---|---|---|---|
| A | 8464 | 7626 | 0 | 0 | 0.00% | 0.00% | 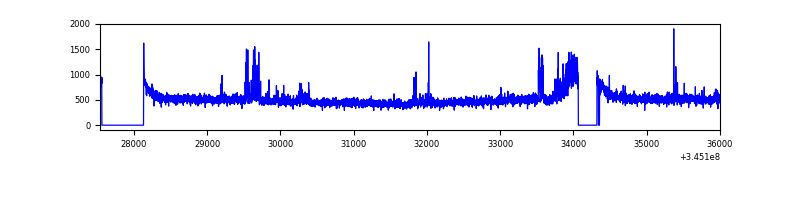 |
| B | 8465 | 7627 | 0 | 0 | 0.00% | 0.00% | 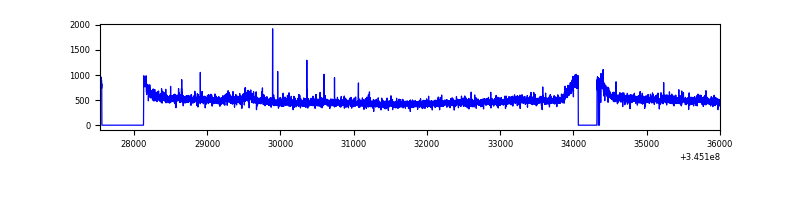 |
| C | 8464 | 7626 | 20 | 20 | 0.24% | 0.26% | 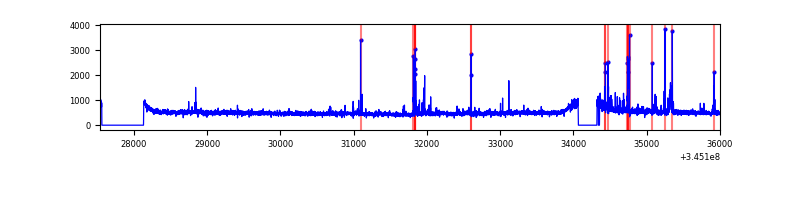 |
| D | 8464 | 7626 | 157 | 157 | 1.85% | 2.06% | 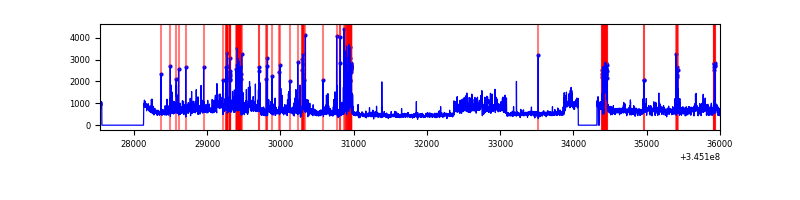 |
Top three noisy pixels from each quadrant. If the there are fewer than three noisy pixels in the level2.evt file, extra rows are filled as -1
| Pixel properties | Quadrant properties | ||||||
|---|---|---|---|---|---|---|---|
| Quadrant | DetID | PixID | Counts | Sigma | Mean | Median | Sigma |
| A | 5 | 98 | 191644 | 974.48 | 971 | 950 | 195.7 |
| A | 0 | 13 | 15030 | 71.95 | 971 | 950 | 195.7 |
| A | 14 | 238 | 12847 | 60.8 | 971 | 950 | 195.7 |
| B | 12 | 111 | 22922 | 118.5 | 952 | 927 | 185.6 |
| B | 4 | 52 | 21455 | 110.59 | 952 | 927 | 185.6 |
| B | 11 | 111 | 21087 | 108.61 | 952 | 927 | 185.6 |
| C | 15 | 208 | 213987 | 979.59 | 918 | 920 | 217.5 |
| C | 14 | 238 | 148030 | 676.35 | 918 | 920 | 217.5 |
| C | 3 | 233 | 44104 | 198.54 | 918 | 920 | 217.5 |
| D | 8 | 195 | 1092050 | 4896.24 | 932 | 905 | 222.9 |
| D | 2 | 250 | 507579 | 2273.57 | 932 | 905 | 222.9 |
| D | 12 | 1 | 115422 | 513.87 | 932 | 905 | 222.9 |
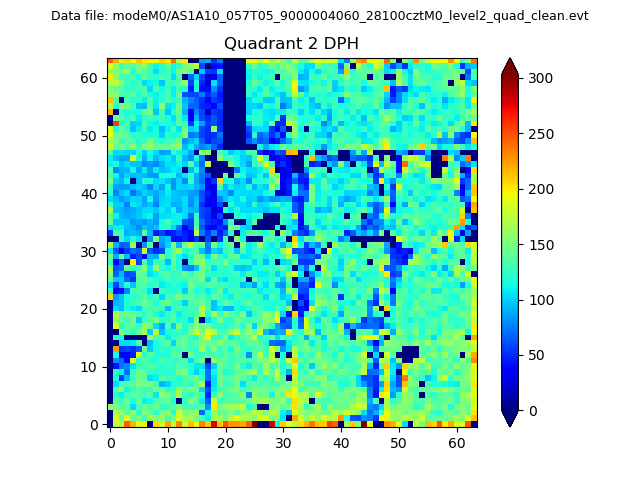
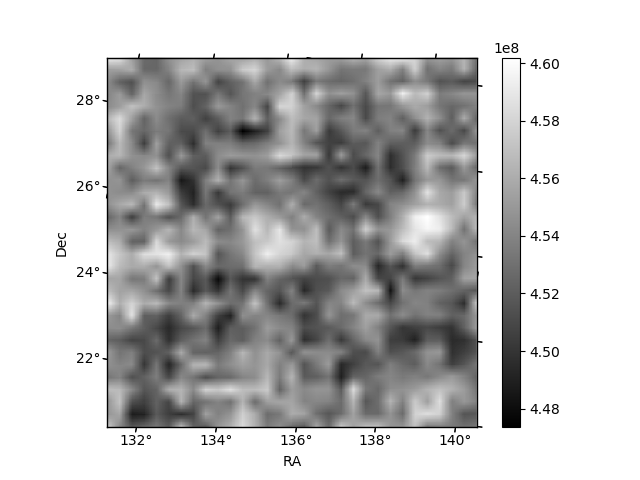
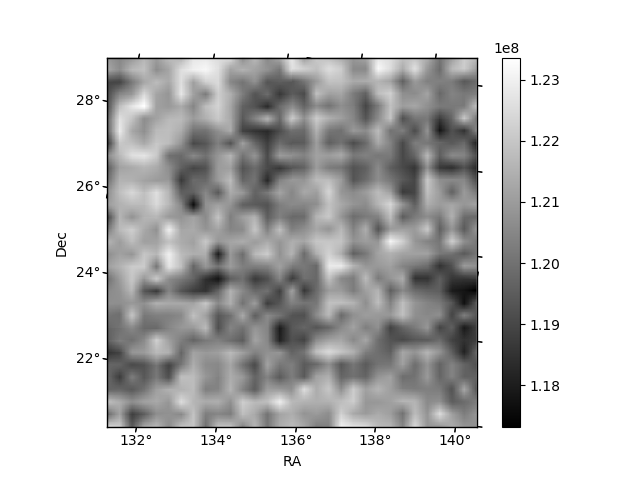
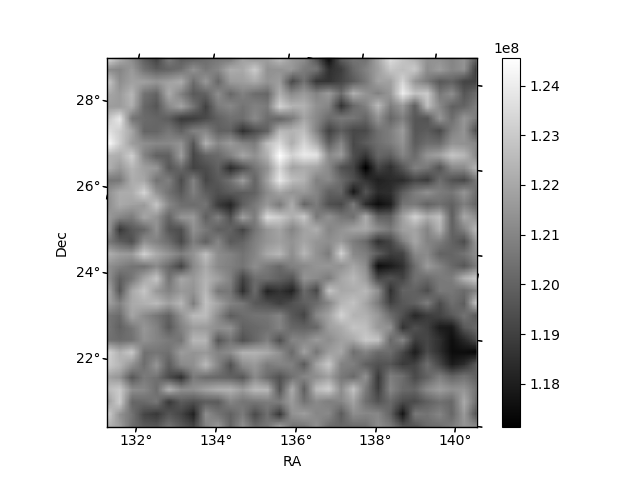
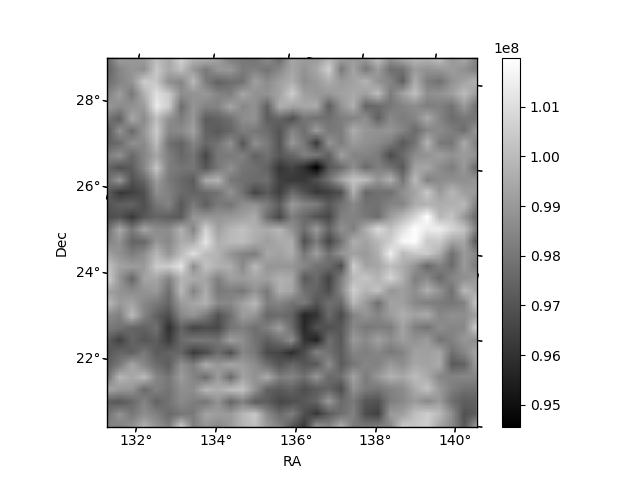
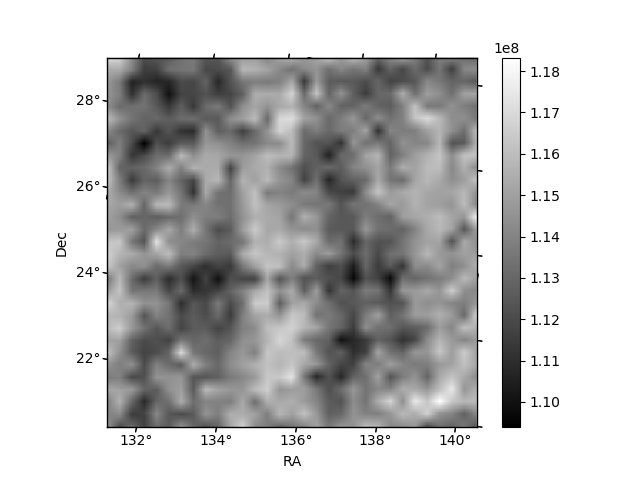
Histogram calculated using DETX and DETY for each event in the final _common_clean file
| Quadrant A | 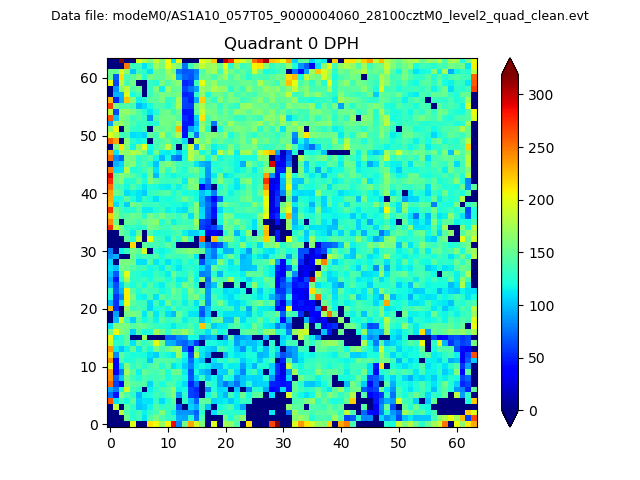 |
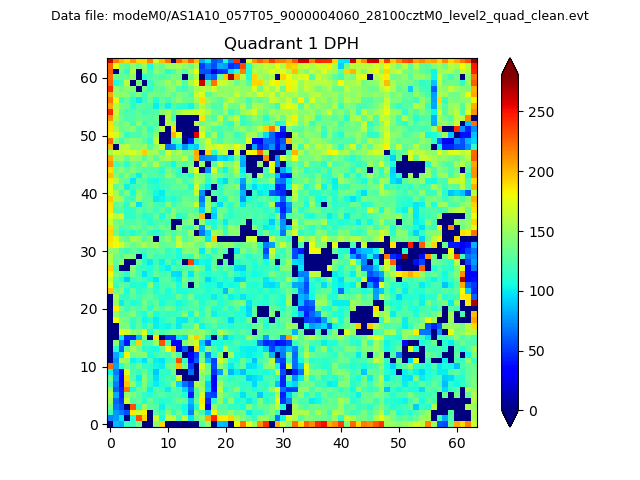 |
Quadrant B |
|---|---|---|---|
| Quadrant D | 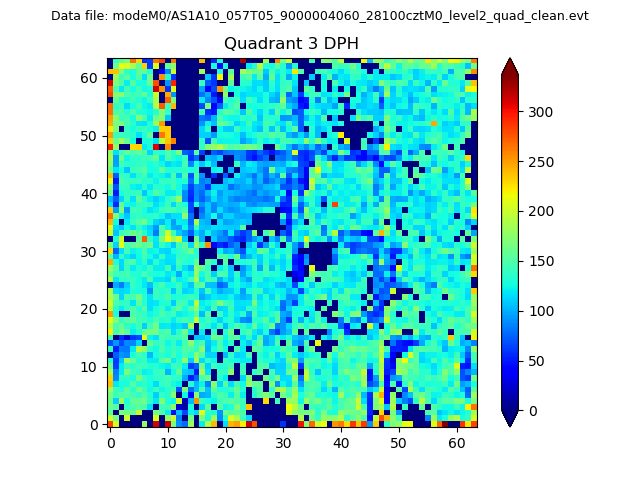 |
 |
Quadrant C |
| Plot type | Count rate plots | Images |
|---|---|---|
| Comparison with Poisson distribution Blue bars denote a histogram of data divided into 1 sec bins. Red curve is a Poisson curve with rate = median count rate of data. |
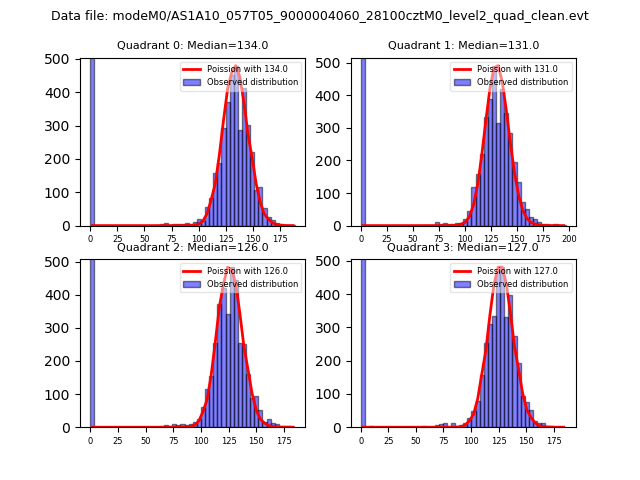 |
 |
| Quadrant-wise count rates Data is divided into 100 sec bins |
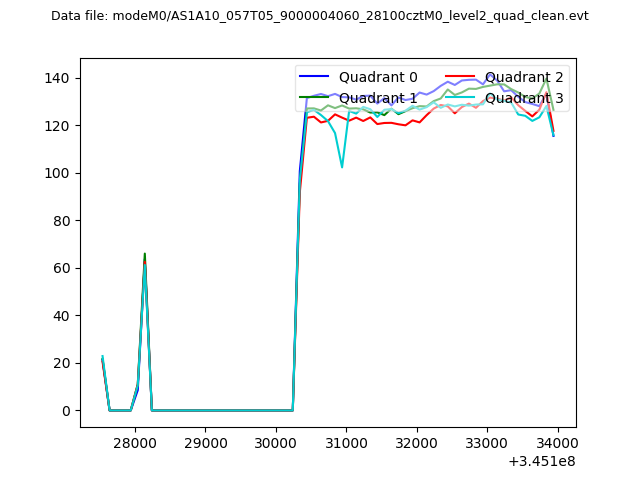 |
|
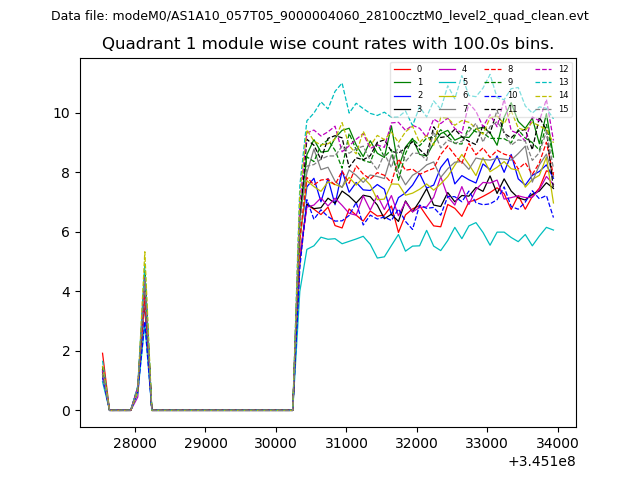
| Module-wise count rates for Quadrant A Data is divided into 100 sec bins |
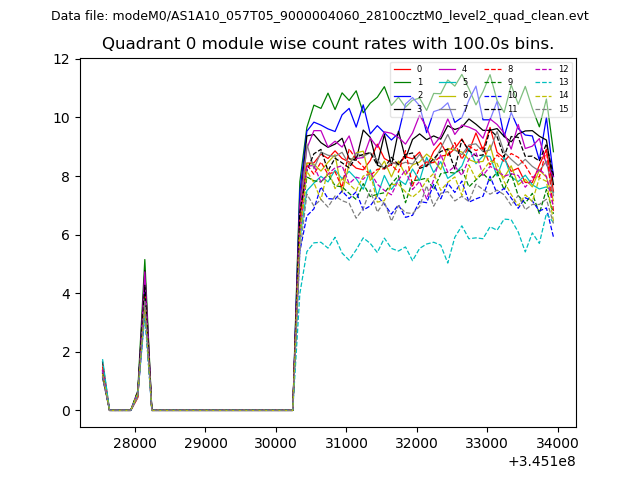 |
 |
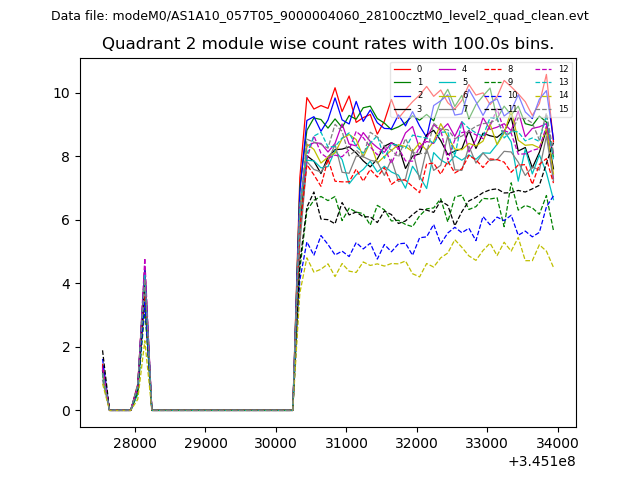
| Module-wise count rates for Quadrant B Data is divided into 100 sec bins |
 |
 |
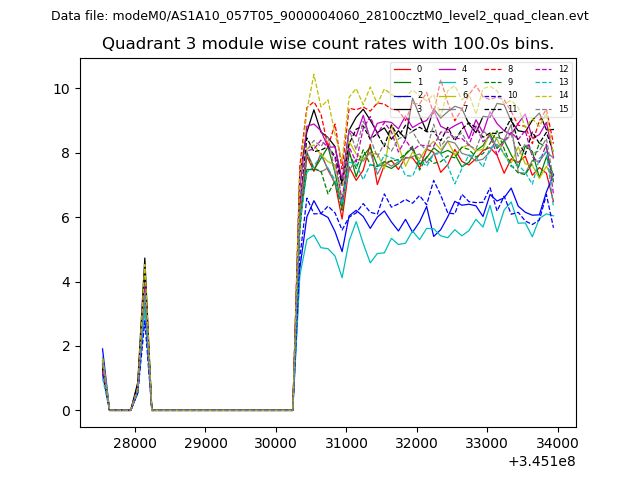
| Module-wise count rates for Quadrant C Data is divided into 100 sec bins |
 |
 |
| Module-wise count rates for Quadrant D Data is divided into 100 sec bins |
 |
 |
| Parameter | Plot |
|---|---|
| CZT HV Monitor | 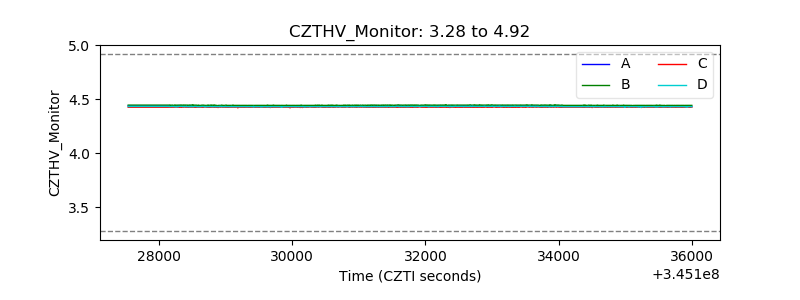 |
| D_VDD | 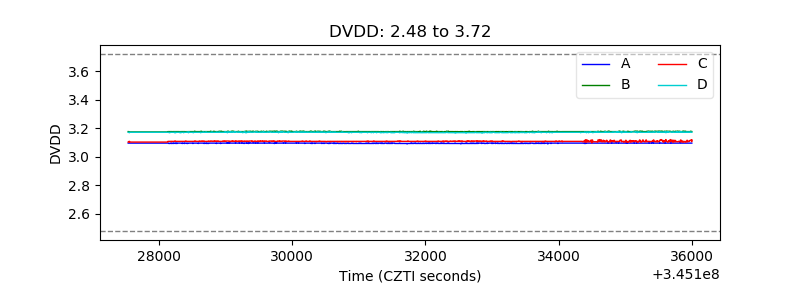 |
| Temperature 1 | 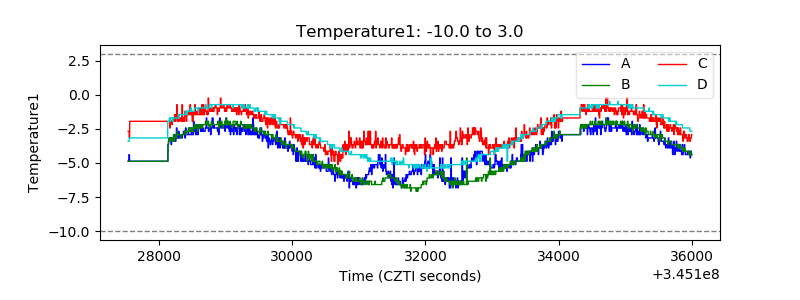 |
| Veto HV Monitor | 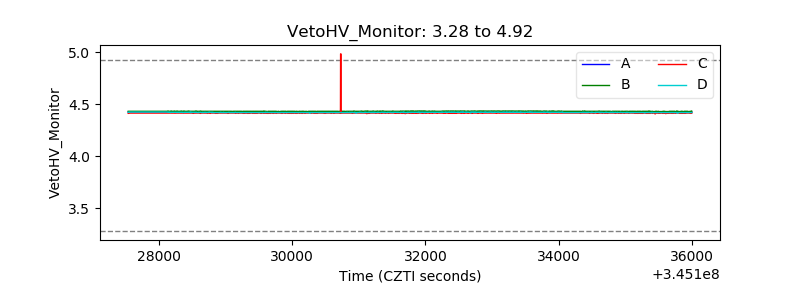 |
| Veto LLD | 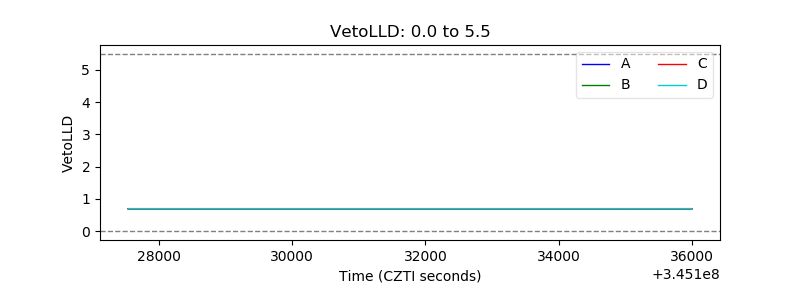 |
| Alpha Counter | 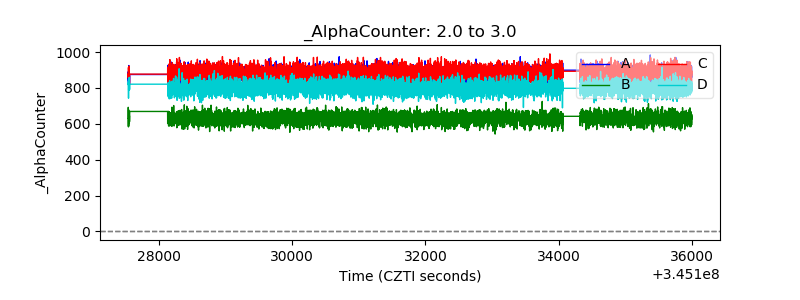 |
| _CPM_Rate | 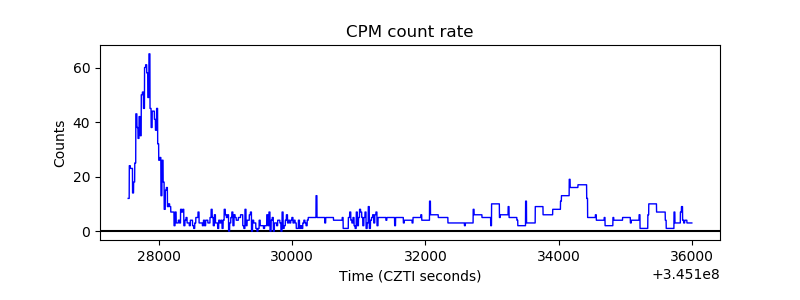 |
| CZT Counter | 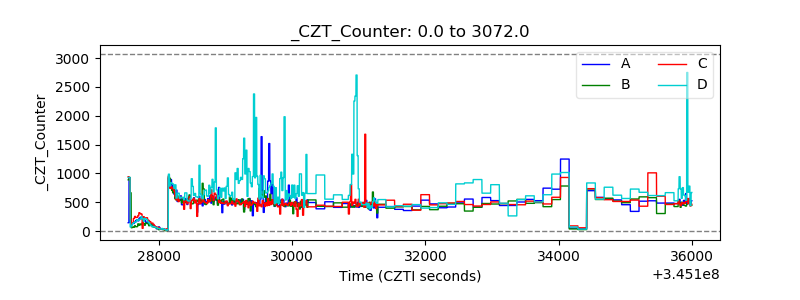 |
| +2.5 Volts monitor |  |
| +5 Volts monitor | 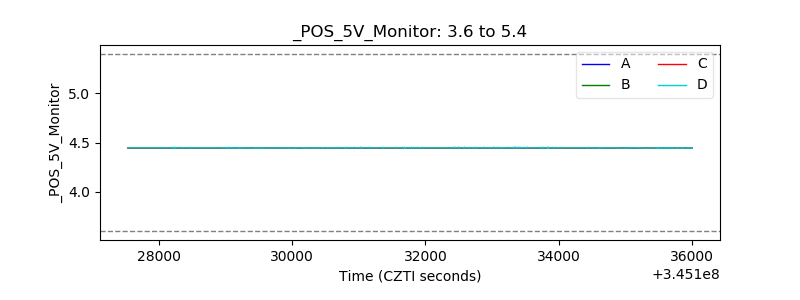 |
| _ROLL_ROT | 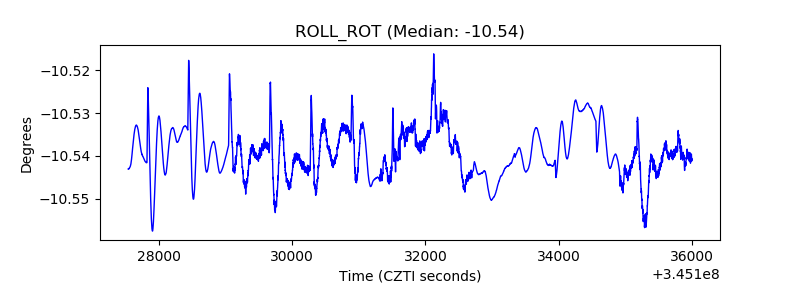 |
| _Roll_DEC | 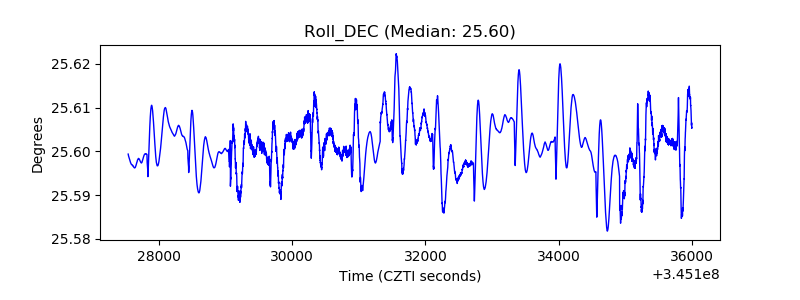 |
| _Roll_RA | 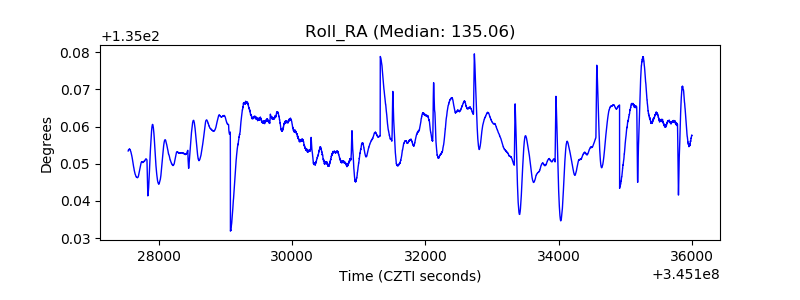 |
| Veto Counter | 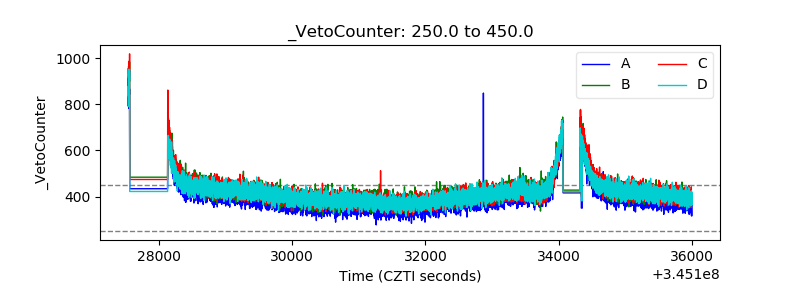 |