| Param | Original file | Final file |
|---|---|---|
| Filename | modeM0/AS1A10_057T05_9000004060_28101cztM0_level2.evt | modeM0/AS1A10_057T05_9000004060_28101cztM0_level2_quad_clean.evt |
| Size (bytes) | 561,810,240 | 81,426,240 |
| Size | 535.8 MB | 77.7 MB |
| Events in quadrant A | 3,724,359 | 503,899 |
| Events in quadrant B | 3,585,349 | 496,266 |
| Events in quadrant C | 3,892,151 | 473,994 |
| Events in quadrant D | 5,309,659 | 475,211 |
| Mode M0 | |||
|---|---|---|---|
| Quadrant | BADHDUFLAG | Total packets | Discarded packets |
| A | 0 | 15574 | 0 |
| B | 0 | 15326 | 0 |
| C | 0 | 16255 | 0 |
| D | 0 | 21150 | 0 |
| Mode M9 | |||
|---|---|---|---|
| Quadrant | BADHDUFLAG | Total packets | Discarded packets |
| A | 0 | 3 | 0 |
| B | 0 | 3 | 0 |
| C | 0 | 3 | 0 |
| D | 0 | 3 | 0 |
| Quadrant | Total seconds | Saturated seconds | Saturation percentage |
|---|---|---|---|
| A | 7418 | 82 | 1.105419% |
| B | 7419 | 113 | 1.523116% |
| C | 7419 | 233 | 3.140585% |
| D | 7419 | 124 | 1.671384% |
Noise dominated data is calculated using 1-second bins in cleaned event files. If a bin has >2000 counts, and if more than 50% of those come from <1% of pixels, then it is considered to be noise-dominated and hence unusable.
| Quadrant | # 1 sec bins | Bins with >0 counts | Bins with >2000 counts | High rate bins dominated by noise | Noise dominated (total time) | Noise dominated (detector-on time) | Marked lightcurve |
|---|---|---|---|---|---|---|---|
| A | 7678 | 7419 | 1 | 1 | 0.01% | 0.01% | 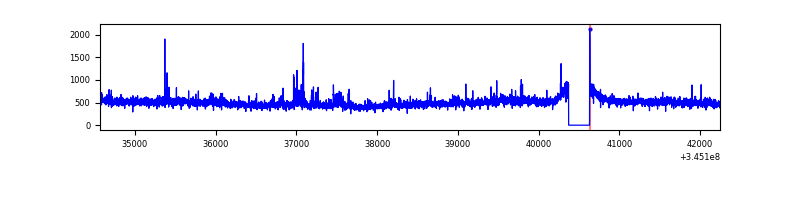 |
| B | 7679 | 7420 | 0 | 0 | 0.00% | 0.00% | 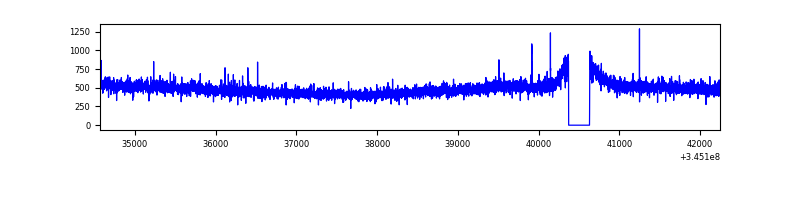 |
| C | 7679 | 7420 | 25 | 25 | 0.33% | 0.34% | 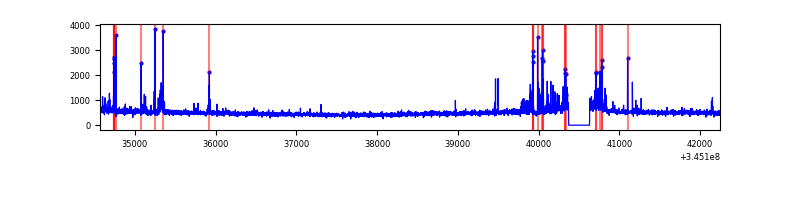 |
| D | 7679 | 7420 | 59 | 59 | 0.77% | 0.80% | 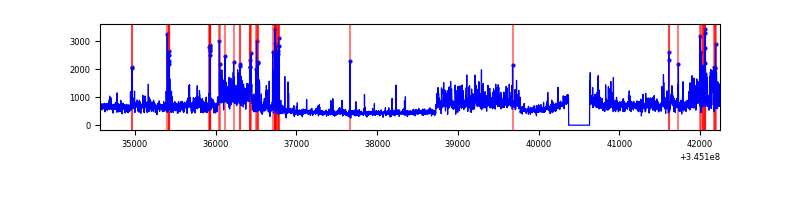 |
Top three noisy pixels from each quadrant. If the there are fewer than three noisy pixels in the level2.evt file, extra rows are filled as -1
| Pixel properties | Quadrant properties | ||||||
|---|---|---|---|---|---|---|---|
| Quadrant | DetID | PixID | Counts | Sigma | Mean | Median | Sigma |
| A | 5 | 98 | 127660 | 685.02 | 924 | 906 | 185.0 |
| A | 6 | 16 | 12136 | 60.69 | 924 | 906 | 185.0 |
| A | 13 | 254 | 11993 | 59.92 | 924 | 906 | 185.0 |
| B | 12 | 111 | 21605 | 118.12 | 906 | 881 | 175.4 |
| B | 11 | 111 | 19673 | 107.11 | 906 | 881 | 175.4 |
| B | 14 | 111 | 17501 | 94.73 | 906 | 881 | 175.4 |
| C | 15 | 208 | 293045 | 1430.42 | 871 | 876 | 204.3 |
| C | 14 | 238 | 140158 | 681.9 | 871 | 876 | 204.3 |
| C | 3 | 233 | 29938 | 142.28 | 871 | 876 | 204.3 |
| D | 8 | 195 | 1270545 | 5923.55 | 892 | 866 | 214.3 |
| D | 1 | 52 | 251618 | 1169.86 | 892 | 866 | 214.3 |
| D | 2 | 250 | 198117 | 920.25 | 892 | 866 | 214.3 |
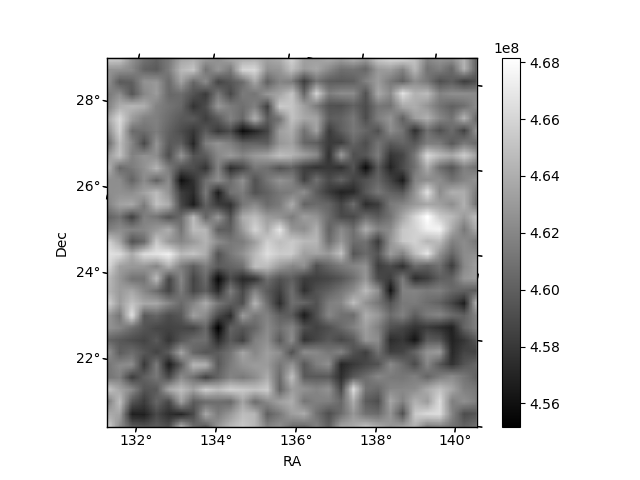
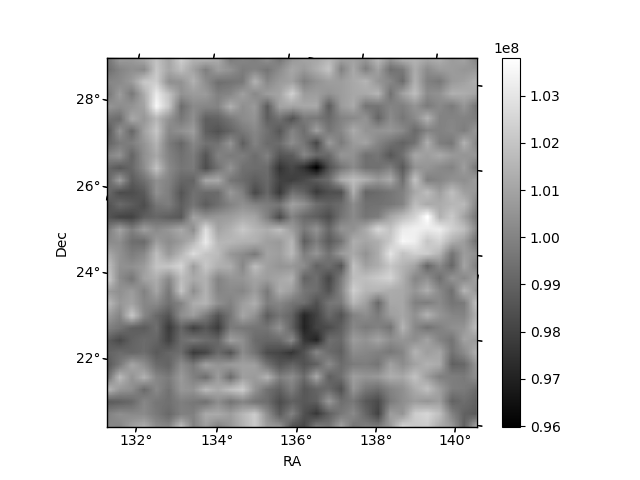
Histogram calculated using DETX and DETY for each event in the final _common_clean file
| Quadrant A | 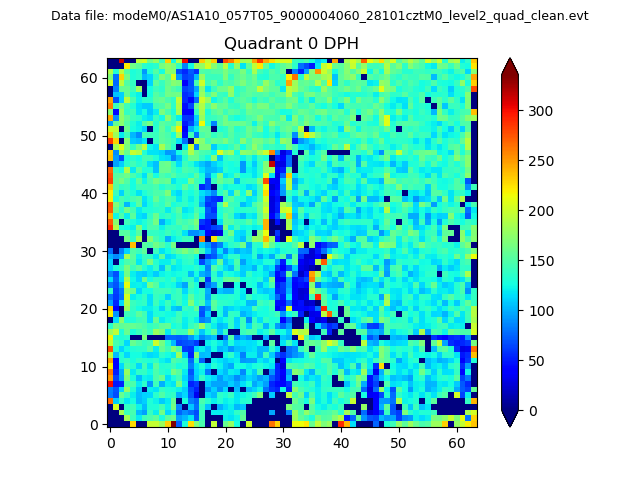 |
 |
Quadrant B |
|---|---|---|---|
| Quadrant D | 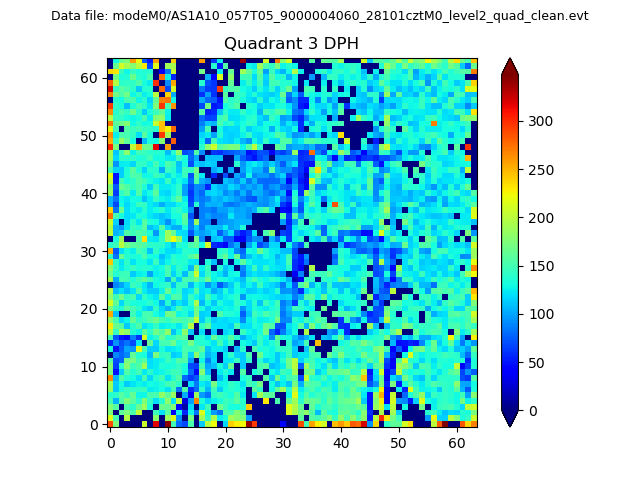 |
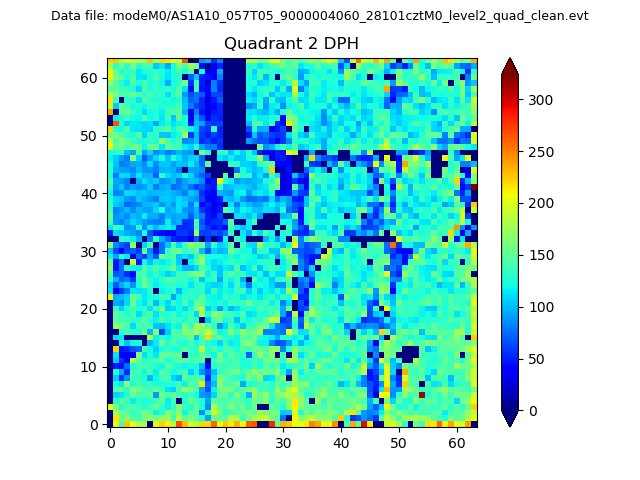 |
Quadrant C |
| Plot type | Count rate plots | Images |
|---|---|---|
| Comparison with Poisson distribution Blue bars denote a histogram of data divided into 1 sec bins. Red curve is a Poisson curve with rate = median count rate of data. |
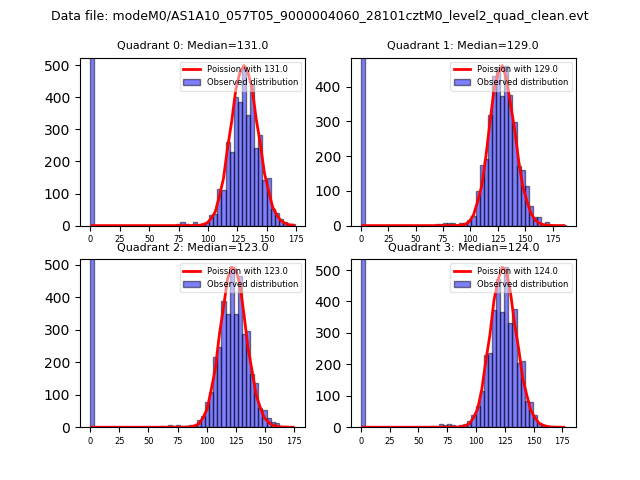 |
 |
| Quadrant-wise count rates Data is divided into 100 sec bins |
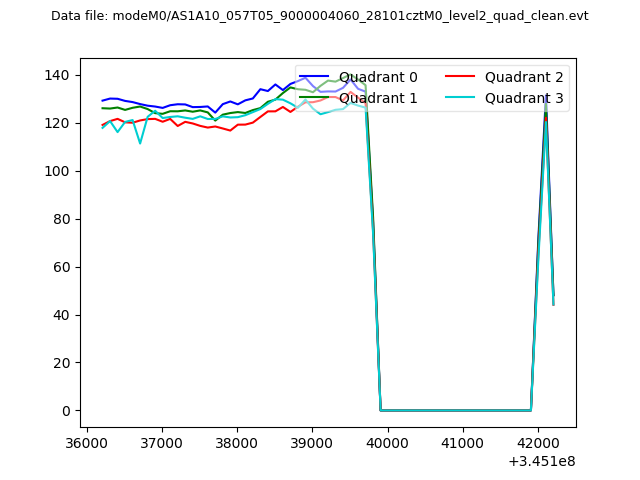 |
|
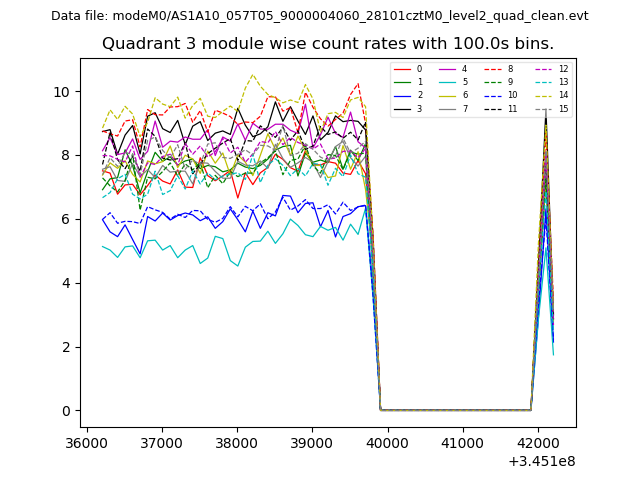
| Module-wise count rates for Quadrant A Data is divided into 100 sec bins |
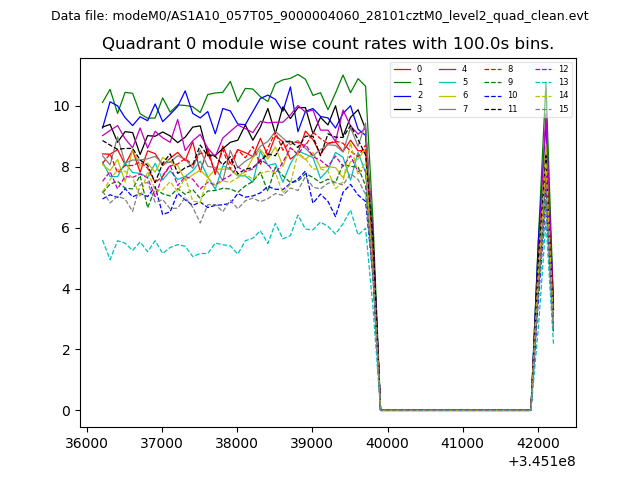 |
 |
| Module-wise count rates for Quadrant B Data is divided into 100 sec bins |
 |
 |
| Module-wise count rates for Quadrant C Data is divided into 100 sec bins |
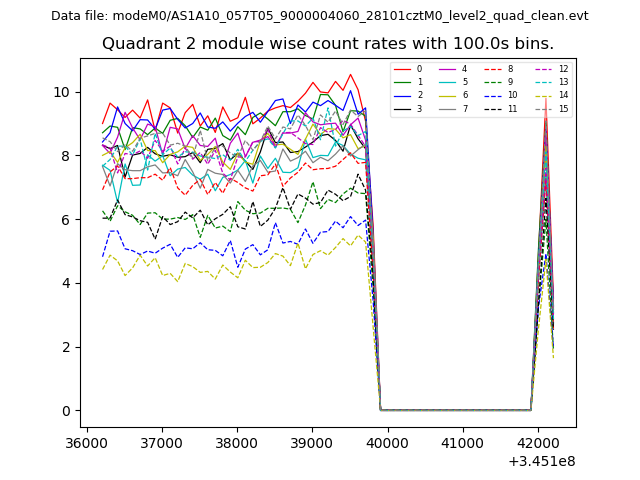 |
 |
| Module-wise count rates for Quadrant D Data is divided into 100 sec bins |
 |
 |
| Parameter | Plot |
|---|---|
| CZT HV Monitor | 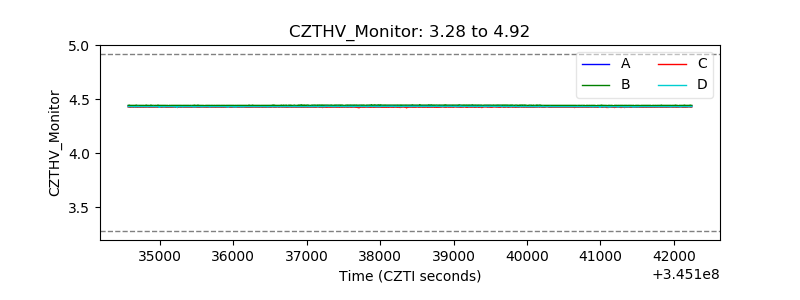 |
| D_VDD | 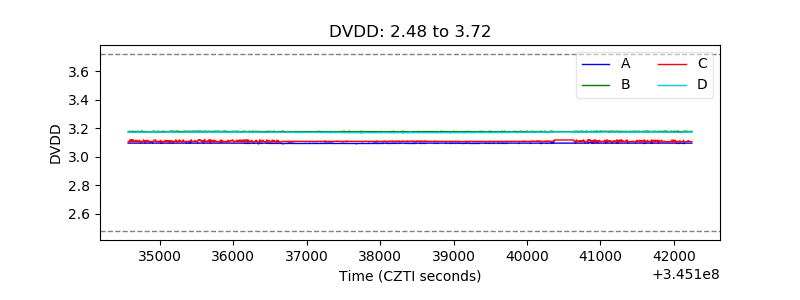 |
| Temperature 1 | 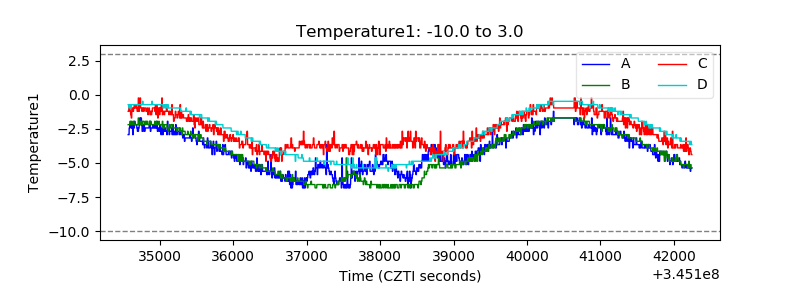 |
| Veto HV Monitor | 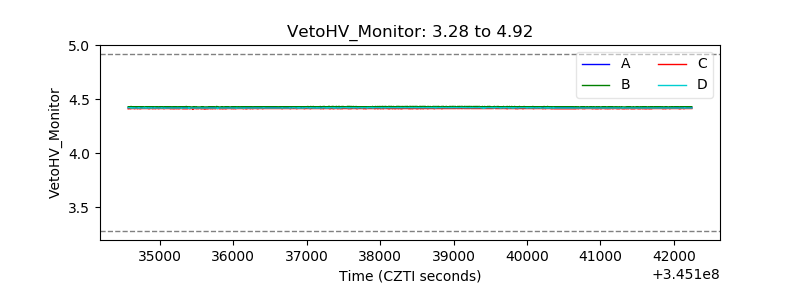 |
| Veto LLD | 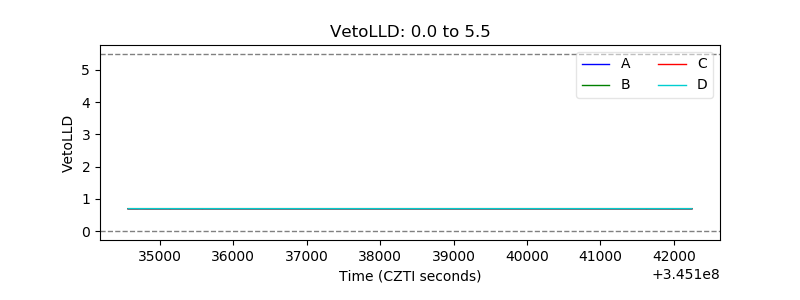 |
| Alpha Counter | 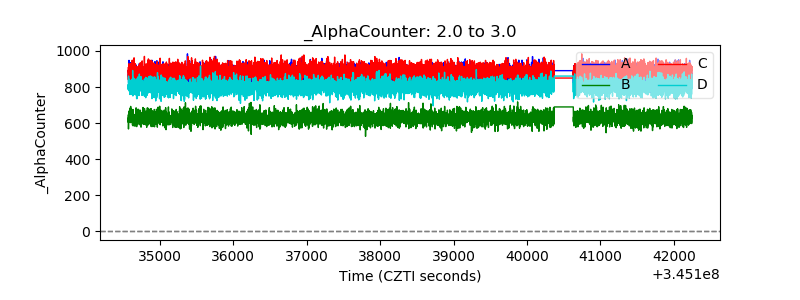 |
| _CPM_Rate | 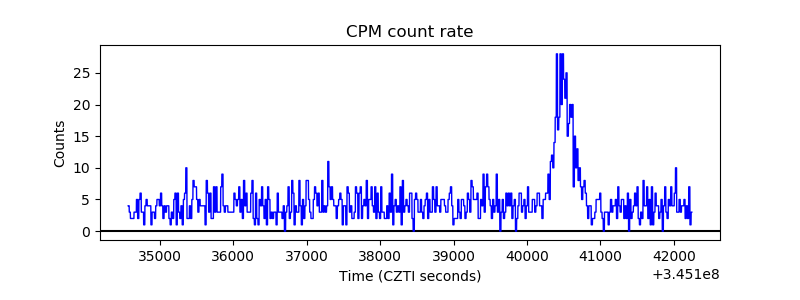 |
| CZT Counter | 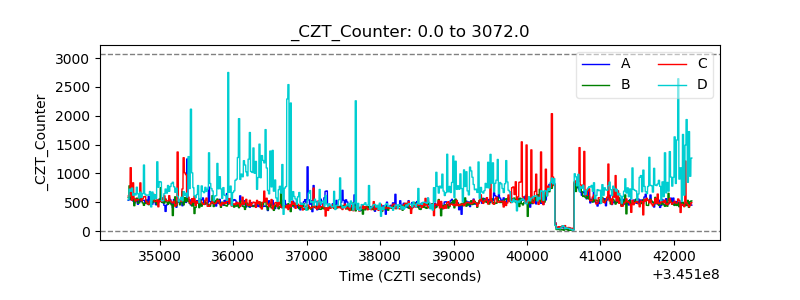 |
| +2.5 Volts monitor |  |
| +5 Volts monitor |  |
| _ROLL_ROT | 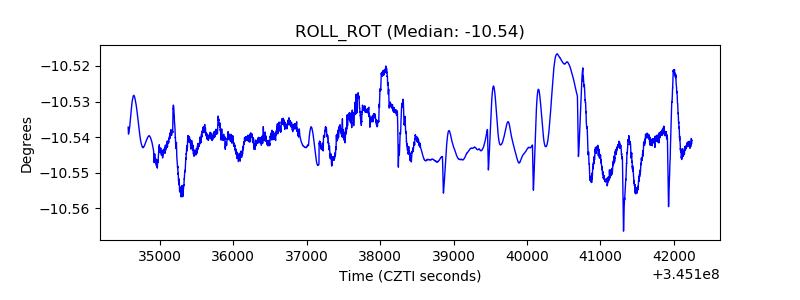 |
| _Roll_DEC | 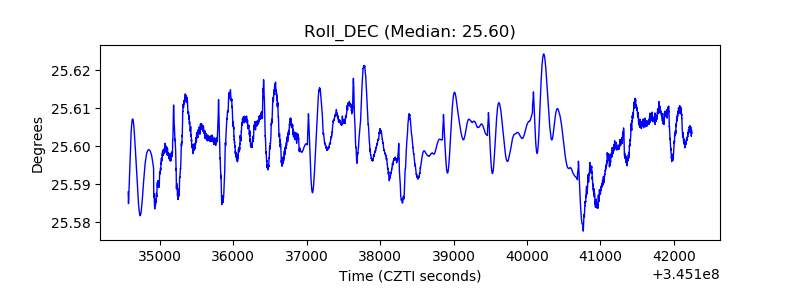 |
| _Roll_RA |  |
| Veto Counter | 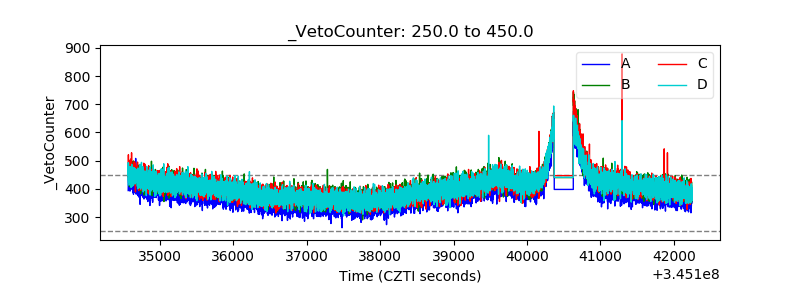 |